A little over a week ago my wife and I were at a local restaurant in CT (called Posa) with a few friends (I had the delicious Branzino). While we were waiting for our appetizers (Bufala Mozzarella) I overheard a gentleman at the table next to us saying, “this market is crazy, it’s a bubble, it’s going to crash, it can’t keep going up.”
Famous last words from a guy who likely missed the rally in the last six months and is desperately looking for an entry point…
Between the election anxiety, market anxiety, covid anxiety and 24/7 news flow about each of these items, I thought Taylor Swift’s song, “You Need To Calm Down” was the right theme for this week’s article (with 6 and 8 year old daughters, we hear a lot of Taylor around the Hayes household):
So oh-oh, oh-oh, oh-oh, oh-oh, oh-oh
You need to calm down, you’re being too loud
And I’m just like oh-oh, oh-oh, oh-oh, oh-oh, oh-oh (oh)
You need to just stop
The Time to Buy Insurance is Before the Hurricane
When I was a young analyst I attended an Insurance Sector conference at the NYSSA (New York Society of Security Analysts). They were talking about whether “price hardening” would ever come back to the sector as there had not been a major catastrophe in some time and inflation was non-existent.
In the insurance industry, catastrophic events are a lose/win event for insurers. The bad news is they have to pay out claims. The good news is they can charge excessive premiums for years after the event – as the demand for coverage goes up – along with the perceived risk.
By nature, humans struggle with recency bias and extrapolate what has recently happened – to persist indefinitely into the future.
Like the “well-meaning” gentleman at the table next to us advised his dinner partner “it has to crash,” I can assure you he was singing a different tune in January when all was well and the world was sanguine (and insurance was cheap).
While most people look at the VIX as a measure of volatility, I look at it as a barometer of stock market insurance pricing.
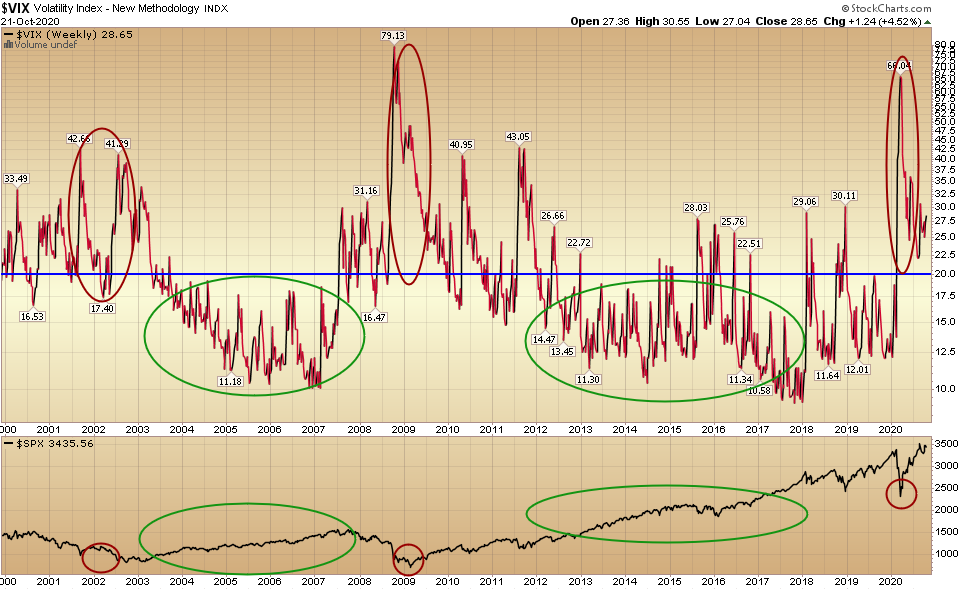
When pricing options, you pay the highest price for insurance AFTER the catastrophe. So in effect, if you want to “predict” a catastrophe and purchase insurance, buy it when the demand is low and no one wants it. It is at times like this that precede “cat loss” events for the stock market.
If you look at the chart above, when volatility (price of insurance/buying puts) spiked and stayed elevated above 20, it was at or near the bottom of the market. On the flip side, you can see two instances when the VIX traded down to 10 (end of 2018 and 2007). The “catastrophic event” occurred AFTER the demand for insurance (and pricing) was at record lows.
Right now we are elevated at 28.5 on the VIX (after spiking to over 66 earlier in the year).
Insurance rarely pays out when premiums are costly – as the sellers are amply compensated for the modest door dings that may occur during the term. In other words, the excess premium they collect – relative to actual risk – enables them to win even if there is a fender bender (but not a full out wreck).
This means the buyer of insurance can be “right” (and get a 5-10% market correction) and still lose money because they overpaid for the insurance. They would only win in a 20-30% drawdown – which never happens when everyone is positioned for it. The sellers of insurance know this and take advantage of their recently shell-shocked fearful buyers.
When everyone is buying the same policy, no one has an edge and sellers are happy to meet the fear-based demand. As the old saying goes, “when the ducks are quacking, feed them.” How do you measure the price of insurance? Just look at the VIX (volatility index).
The key takeaway here is: YOU GET PAID FOR BUYING THE STOCK MARKET (OR SELLING INSURANCE) WHEN INSURANCE IS EXPENSIVE. YOU GET PAID FOR BUYING INSURANCE (OR SHORTING THE MARKET) WHEN INSURANCE IS CHEAP NO ONE WANTS IT.
Right now insurance is expensive. So while there could be a 5-10% “fender bender” in the short term, your insurance “premium cost” is so expensive that it won’t pay out.
Math is Helpful
When you look around at many of the small businesses that were effected by COVID – as well as those impacted with “front-facing” jobs in leisure/hospitality and travel, it is hard for many to understand why the stock market is doing so well.
The Stock Market is a “discounting mechanism” that looks out 6-18 months in anticipation of what is coming. What is coming is the lagged impact of UNPRECEDENTED fiscal and monetary policy.
According to the IMF’s most recent semiannual Fiscal Monitor report, to date Governments around the world have committed $11.7 trillion in Fiscal Stimulus.
Central Banks have buttressed this effort with an additional $7.5 trillion of liquidity with purchases of corporate and government securities. That’s before the potential $2T of additional stimulus that may come in the U.S. at some point in coming days or months.
So the dose of medicine is well over $20T when all is said and done.
What’s the magnitude of the ailment? According to the IMF, the global economy will contract by 4.4% this year. On an ~$83.4 trillion Global Economy (GDP), a 4.4% contraction is ~$3.66 trillion of contraction.
The dose of medicine ($20T) is >5x the magnitude of the ailment ($3.66T).
Thinking about it another way, the value of the global stock markets is ~$90 trillion. Adding ~$20T of stimulus, aid and liquidity (or ~22% of the total value) is not only going to cushion a lot of the short term blow, it’s going to yield an overflow of money chasing the same (or slightly greater) number of assets.
So while small businesses will hurt in the short term, in the intermediate term it will lead to a global boom like we haven’t seen since the last time (post-WWII) this level of stimulus was instituted globally (and in particular by the US):
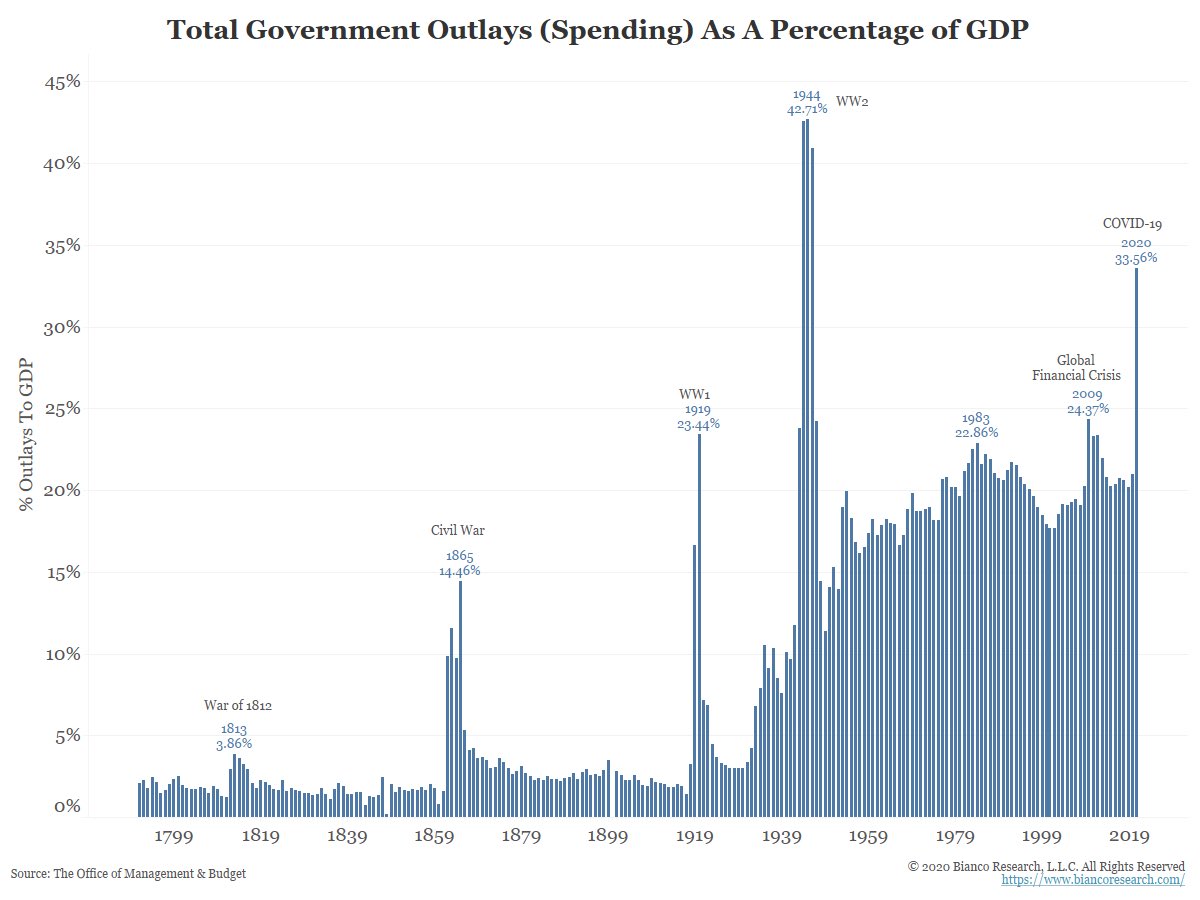
Source: Bianco
The 1950’s-1960’s were a boom time and secular bull market in the US. Debt to GDP dropped from ~120% to the mid-50’s% in a matter of years – due to growth in GDP. The same will happen this decade.
But it’s a Bubble!
Do these stocks look like they are in a bubble?
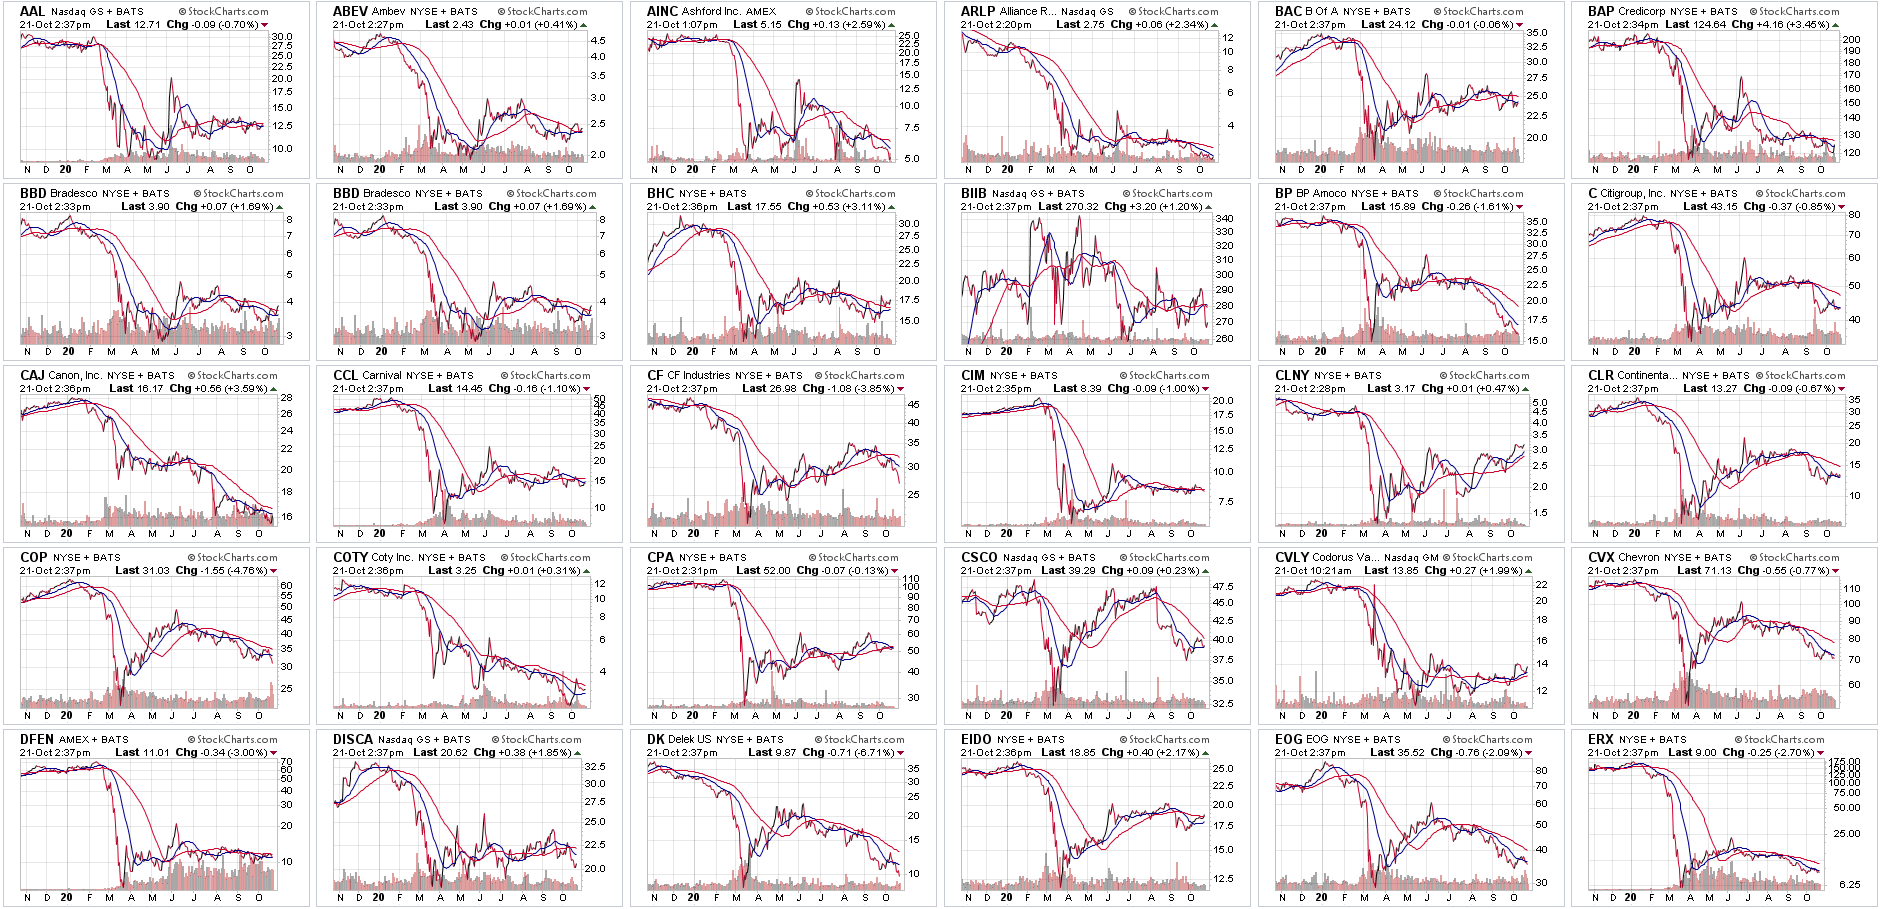
How about these?
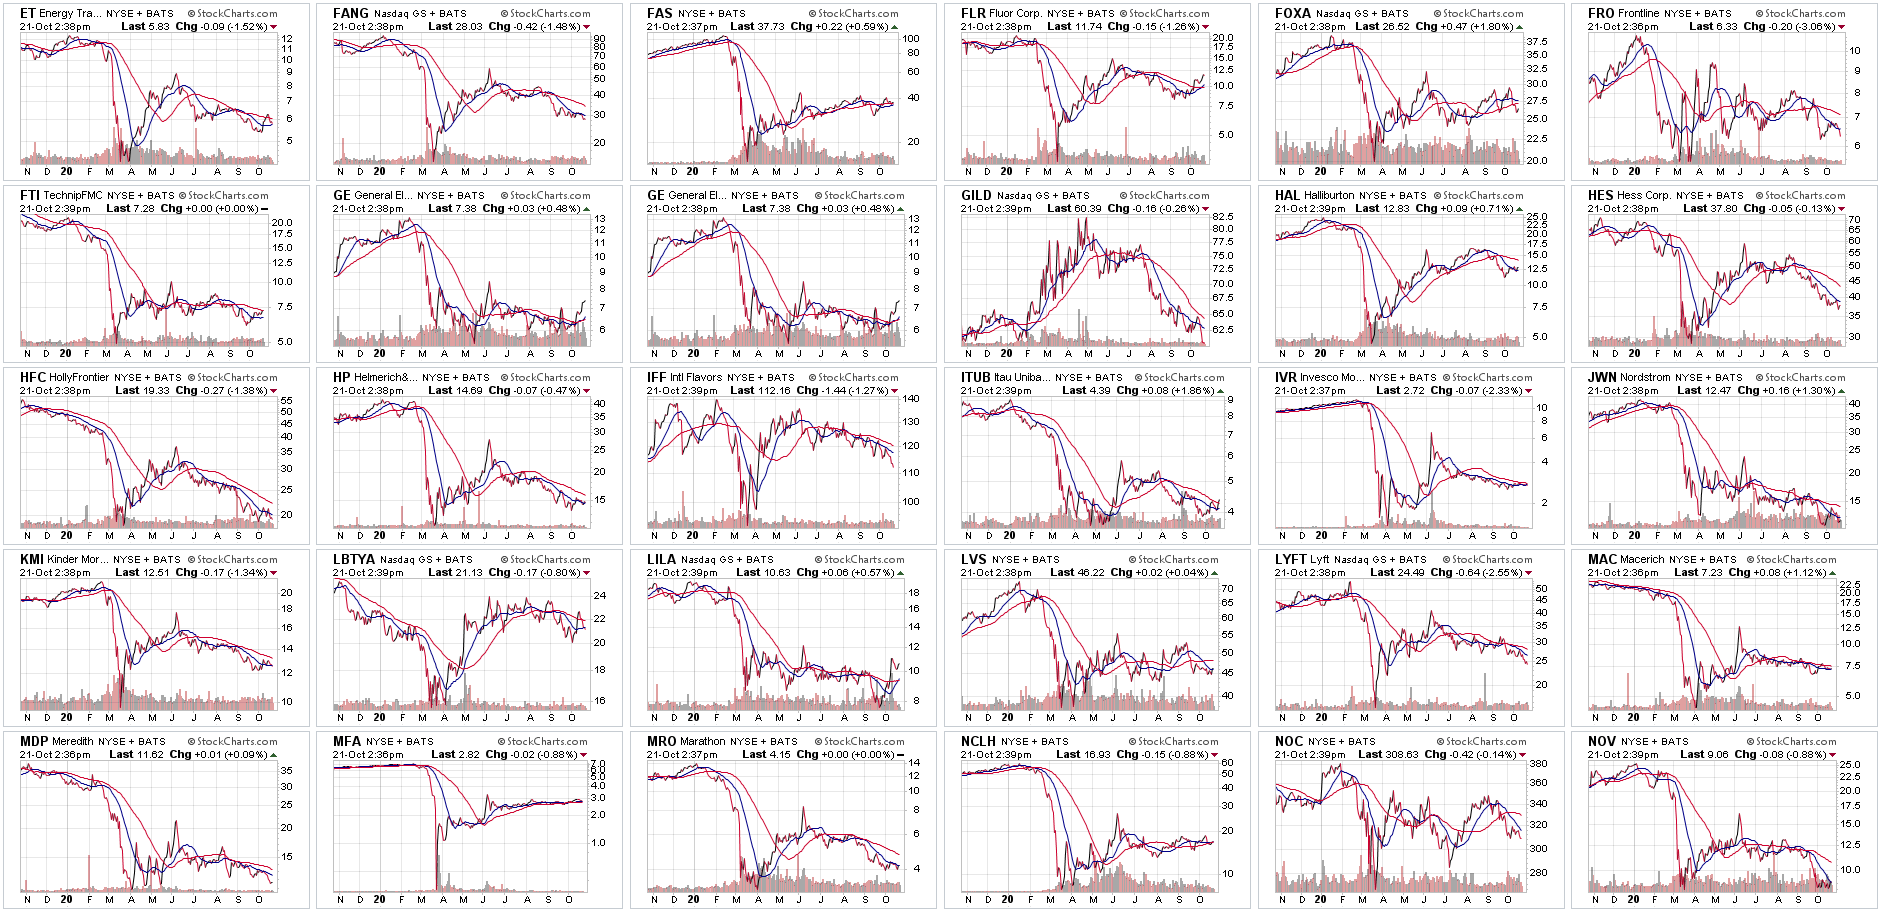
And these?
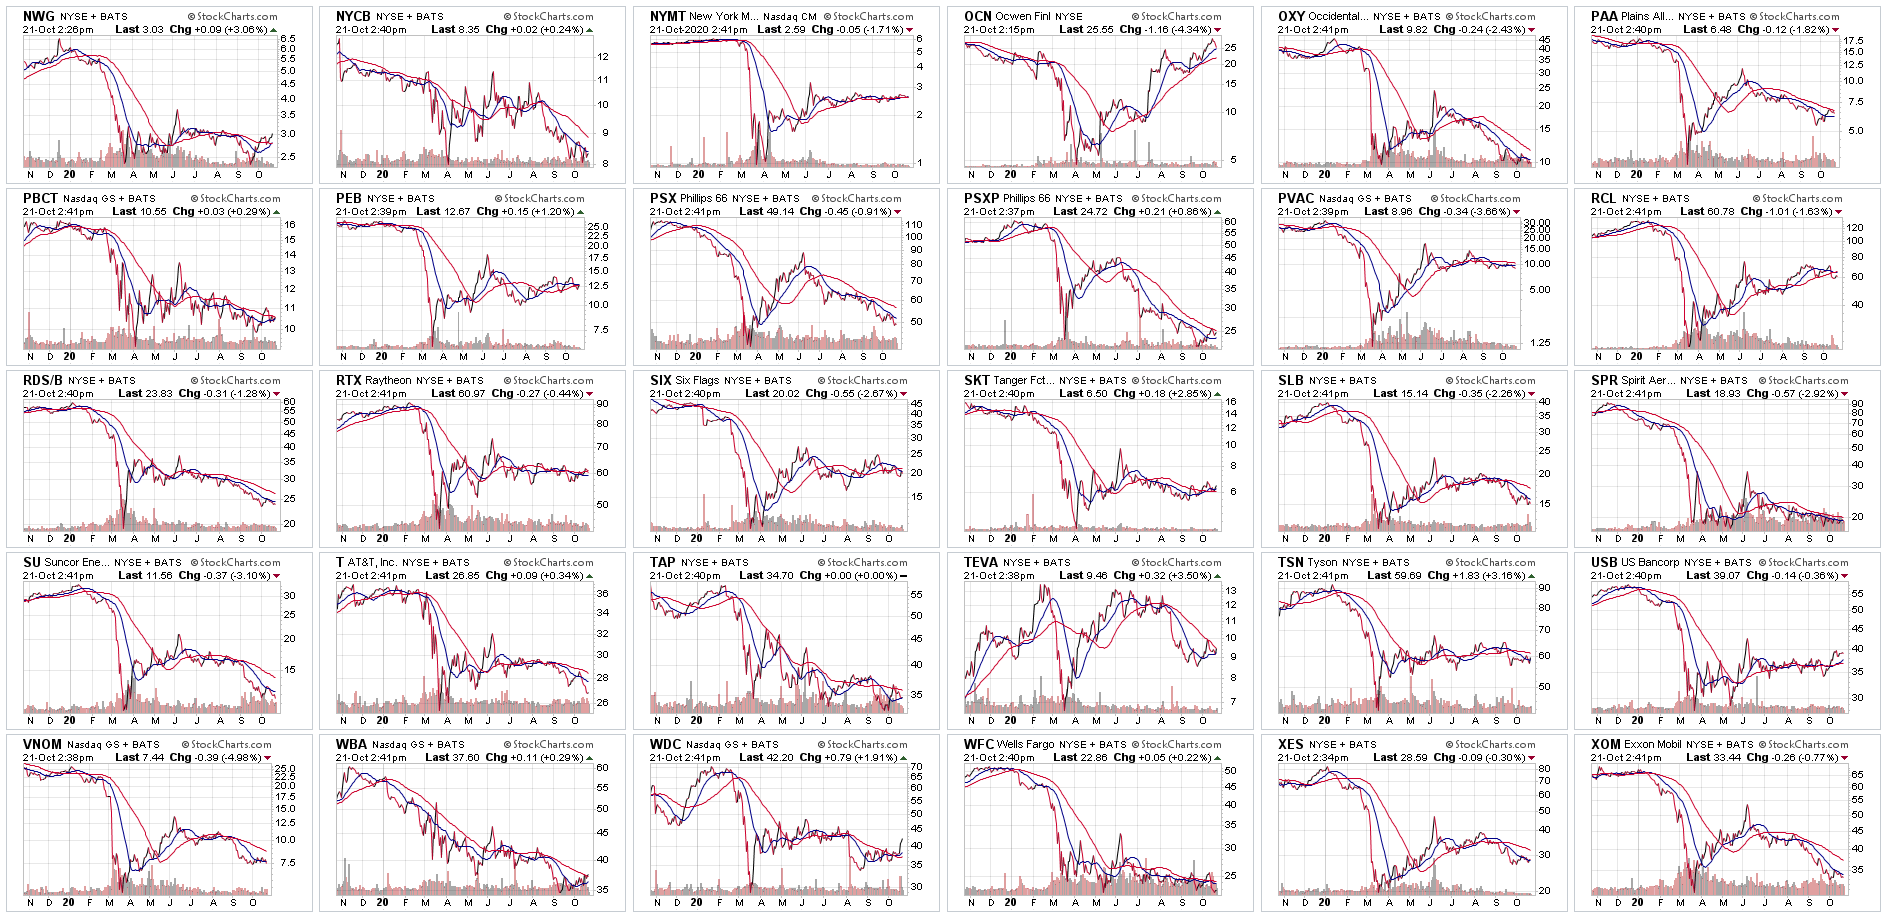
These are largely cyclical and value stocks that outperform at the beginning of a new cycle – which we are now starting (after 2 consecutive quarters of negative GDP are now in the rear-view mirror).
As in every new cycle, these groups will outperform in the early part of the new cycle when GDP growth rates are at their highest (off easier comps). The catalysts as we have covered in recent weeks are:
- Vaccines (soon)
- Treatments (better by the day)
- Earnings (coming in better than expected – 86% beat rate for Q3)
- Election Outcome (Nov. 3 – or later…)
- Stimulus ($500B-$2T sometime between now and February 2021)
The Illusion of the Bubble

The FAANGM stocks above have thrived in a “stay at home” work environment that dominated in the first half of the year and pulled forward earnings power for these core companies.
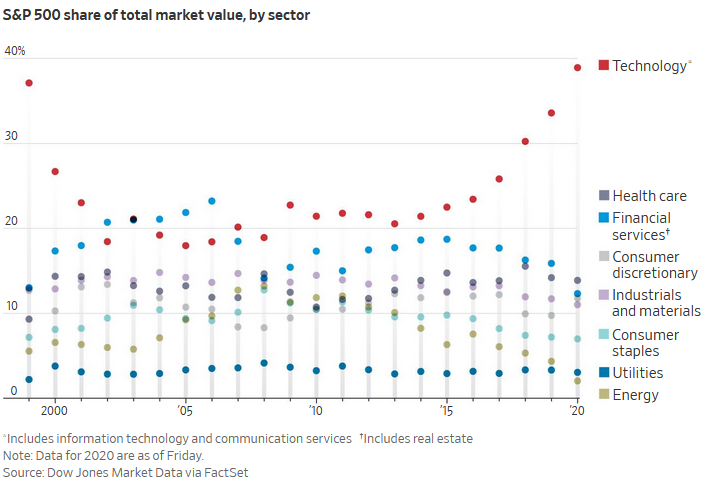
Source: WSJ
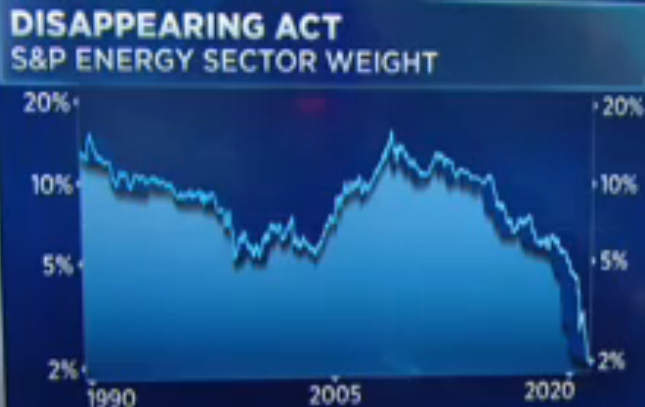
Source: CNBC
We haven’t seen this magnitude of sector weight dispersion since 2000 – when there was an abrupt shift from Tech back to value/cyclicals. Another way to visualize this change is to look at the S&P 500 (cap-weighted) index versus the S&P 500 (equal-weighted) index.
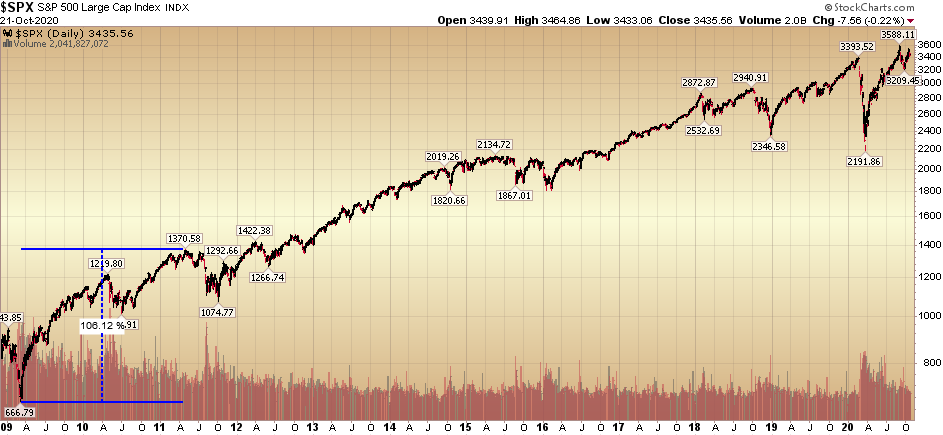
Cap Weighted Index
Equal Weighted Index is essentially flat for ~3 years.
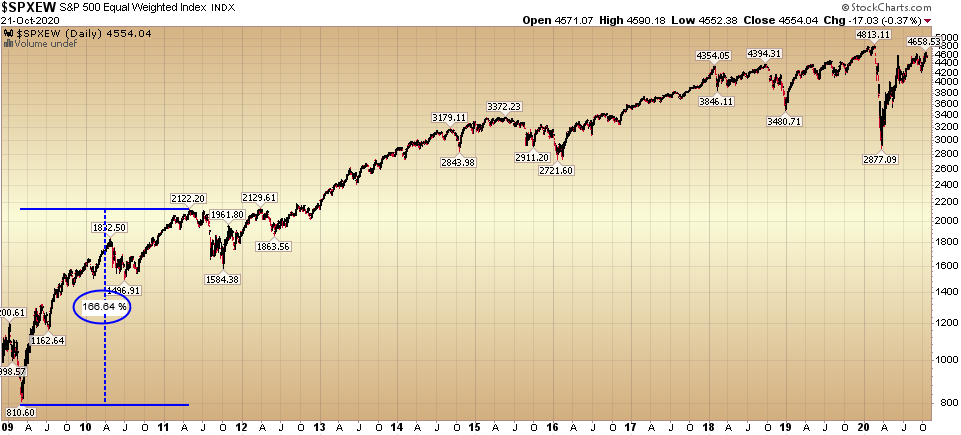
As you can see above, the equal weighted S&P 500 outperformed the cap-weighted S&P 500 in the first 8 quarters of the recovery (new cycle). The same will happen this time.
Equal-Weighted S&P (1st 8 quarters of last cycle): 166% gain
Cap-Weighted S&P (1st 8 quarters of last cycle): 106% gain
As the yield curve continues to steepen, cyclicals will take up the mantle and the weighting of tech (and its over-weighted components) will start to be displaced by a continued expansion of market breadth. It’s steepening right under our noses:
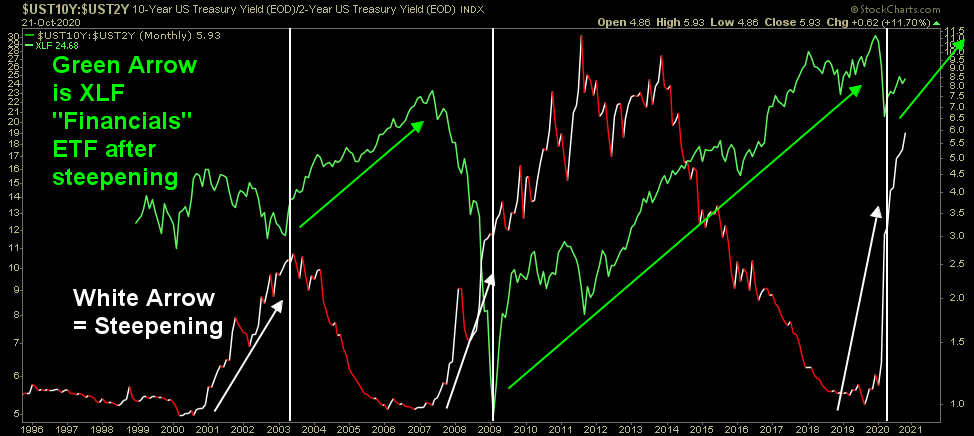
Banks are just getting started. Either someone has just cracked Nuclear Fusion, or Energy is a generational buy at these levels as well. The global population (and middle class) is still growing faster than renewable alternatives. The time to buy is when no one wants them (Banks/Energy). We continue to do so (selectively and methodically) in the highest quality names.
If you take nothing else from this week’s note, this is the most important point: Expect a moderation/rotation of weighting/leadership in the S&P 500.
According to Investopedia, Baron Rothschild, an 18th-century British nobleman and member of the Rothschild banking family, is credited with saying that “the time to buy is when there’s blood in the streets.” He should know. Rothschild made a fortune buying in the panic that followed the Battle of Waterloo against Napoleon. But that’s not the whole story. The original quote is believed to be “Buy when there’s blood in the streets, even if the blood is your own.”
As Brutus so eloquently said to Cassius in Julius Ceasar,
“There is a tide in the affairs of men
Which, taken at the flood, leads on to fortune.”
Brutus speaks these words in Act IV, scene ii in order to convince Cassius that it is time to begin the battle against Octavius and Antony. He speaks figuratively of a “tide” in the lives of human beings: if one takes advantage of the high tide, one may float out to sea and travel far; if one misses this chance, the “voyage” that one’s life comprises will remain forever confined to the shallows, and one will never experience anything more glorious than the mundane events in this narrow little bay. Brutus reproaches Cassius that if they do not “take the current” now, when the time is right, they will lose their “ventures,” or opportunities. (Source: SparkNotes)
Now Brutus wasn’t perfect, but he certainly made a compelling point. He had the timing right, but after his initial win against Octavius he lets up (by celebrating too soon) and gives Anthony time to regroup against him.
Brutus’ fate may be worth remembering after Energy has its next big run; ring the register and move on – the future lies elsewhere…
Now onto the shorter term view for the General Market:
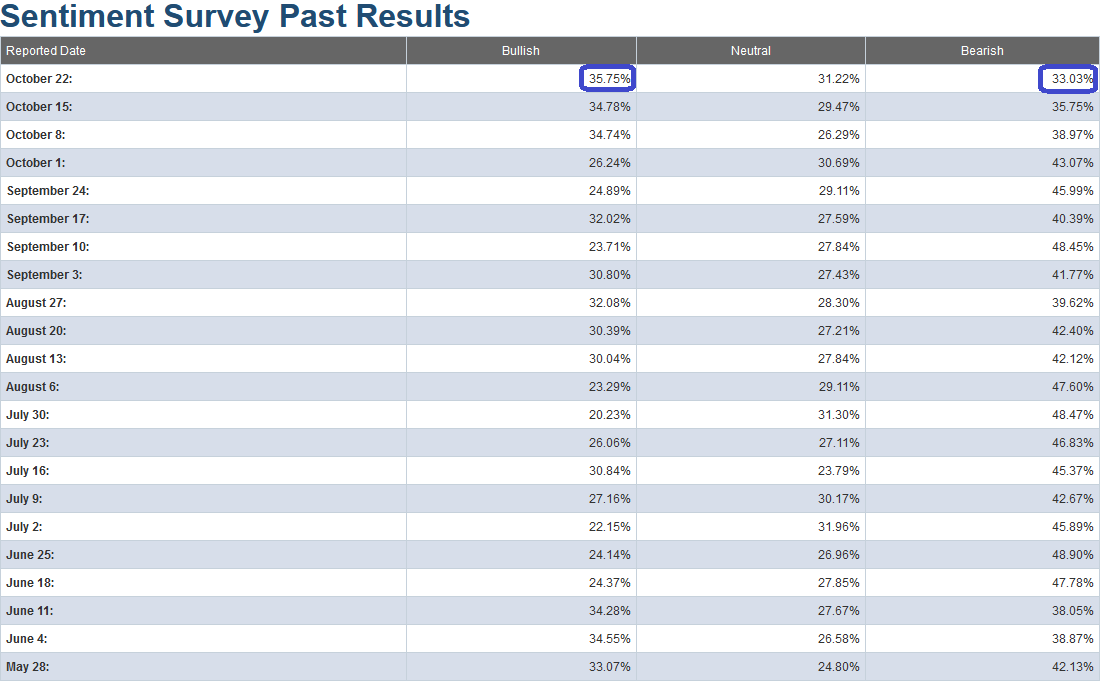
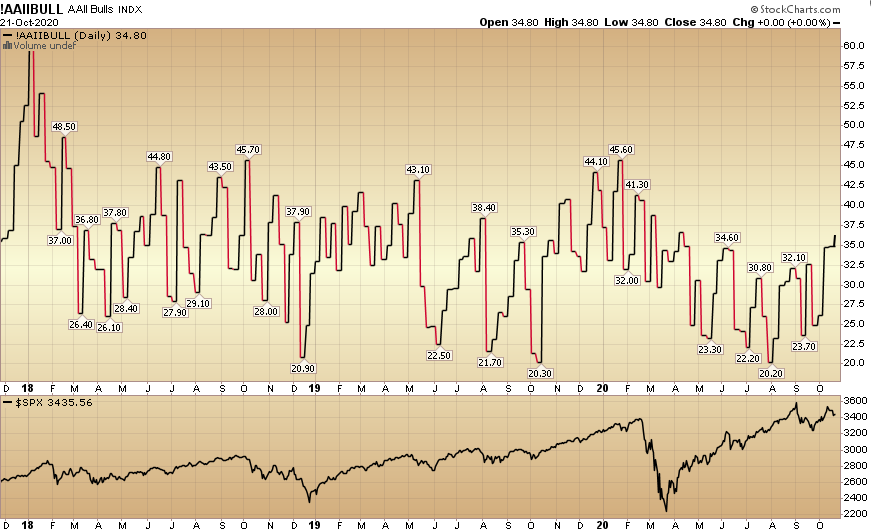
In this week’s AAII Sentiment Survey result, Bullish Percent (Video Explanation) ticked up to 35.75% from 34.78% last week. Bearish Percent fell to 33.03% from 35.75% last week. Enthusiasm is starting to manifest, but we have a little way to go before hitting euphoria.
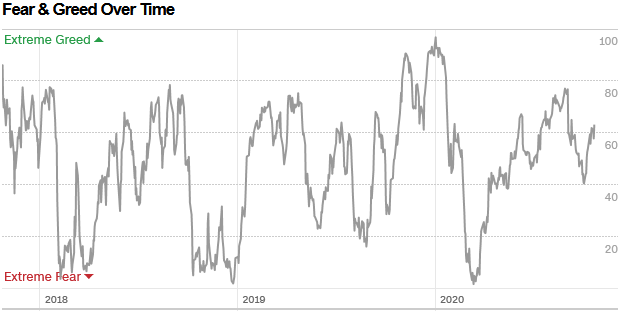
The CNN “Fear and Greed” Index moved up from 55 last week to 63 this week. This is still mid-range. You can learn how this indicator is calculated and how it works here: (Video Explanation)
 And finally, this week the NAAIM (National Association of Active Investment Managers Index) (Video Explanation) jumped up from 73.05% equity exposure last week, to 102.93% this week. This is extreme and worth watching closely, however bear in mind that prior to 2020, the last time we got a read this high was 2018 (and it was the middle of a rally, not the end).
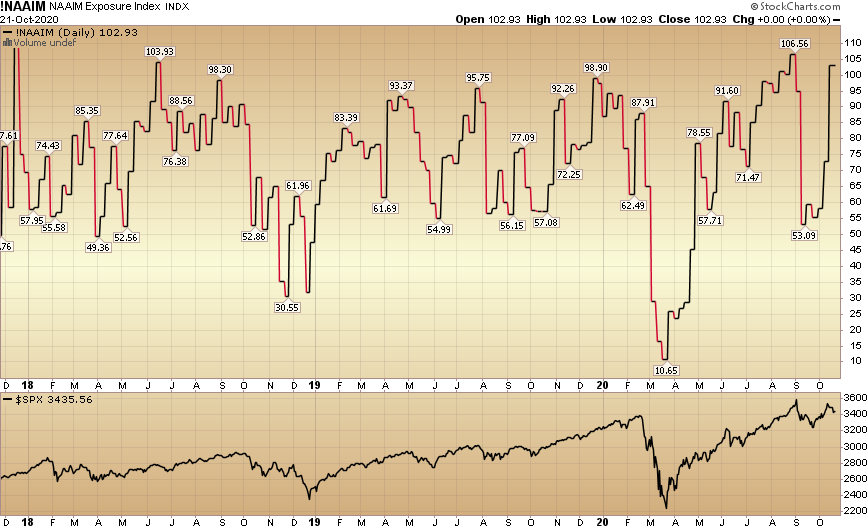
Our message for this week:
As I have repeated for over a month, the catalyst for change (a continuation of the move into Cyclicals) will likely come from science at this point. Don’t bet against science.
We have a number of variables to deal with in the next two weeks.
- Big Tech Reports Earnings Next Week.
- Continued Slow Walk on the Stimulus Package.
- Election Outcome (will the corporate tax rate go up?).
If we do get the “expected volatility,” you can bet that the trampoline will be put out to insure that none of the buyers of premium are paid out. Maybe a fender bender, but no “total loss” is in the cards.
If anything, the opposite is true; we may finally see the VIX normalize below 20 before the end of the year.
That’s when it may make more sense to explore buying insurance – not when everyone wants it…