

The theme of this week is “peak everything.” Peak inflation, peak yields, peak commodities, possibly peak margins, peak growth, peak cash and most importantly peak pessimism…
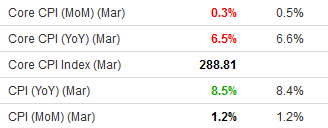
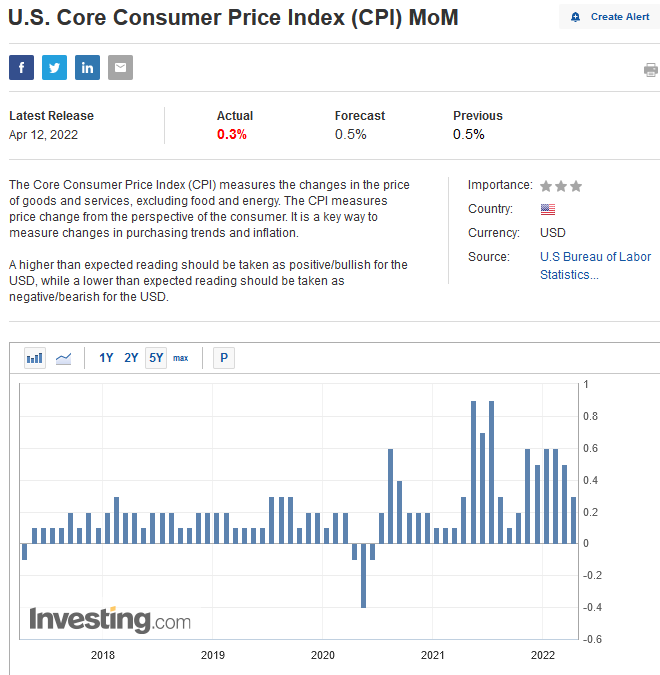
After Tuesday’s Core CPI number came in below expectations, consensus started to come around to the idea that inflation may finally be peaking:
 The base effects we discussed in recent podcast|videocast(s) should start to be felt in earnest in coming months. This simply means that prices had accelerated meaningfully in late Spring of last year and the comps will get easier and easier. This does not mean prices and wages will collapse overnight, but it is likely we are going to see the rate of change flatten aggressively in coming months despite the Russia War, the China Shutdowns and their impact on commodities and the supply chain. God willing we get a positive surprise on either front and the impact could be more material and quicker.
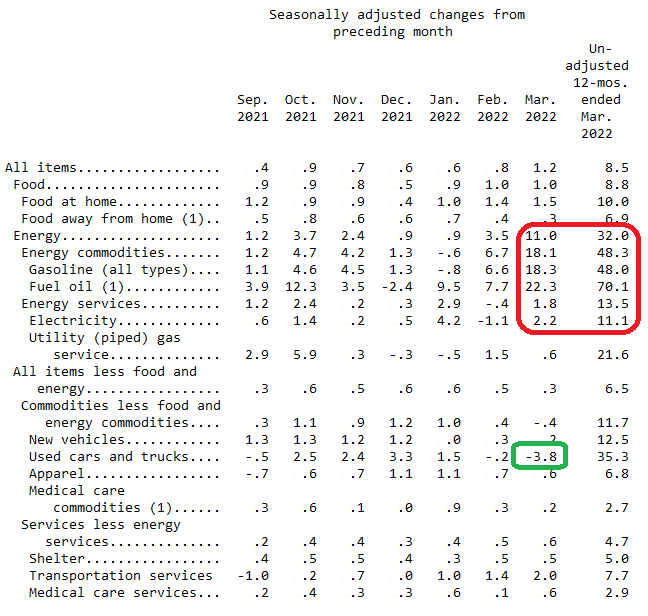
One key green shoot that came out of this report is that Used Car prices (which were a large contributor to CPI) are rolling over as expected. The Administration’s plan to release 1M bbl/day for six months is starting to have a modest impact and China shutdowns are also contributing to some of the relief on oil prices – which should be seen in future reports:
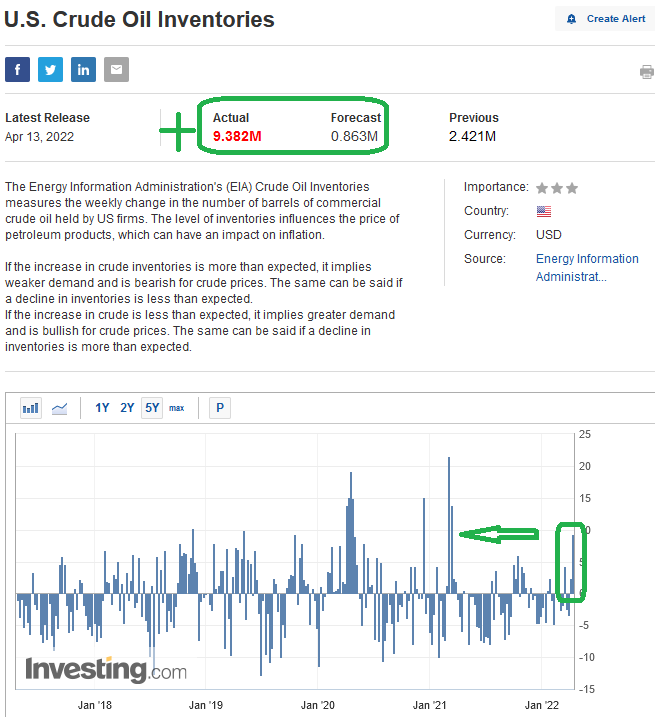
 This week we had the biggest build of Crude inventories since October 2021:
“Gentlemen Prefer Bonds”
This quote is attributed to Andrew Mellon who (according to Wikipedia) was an American banker, businessman, industrialist, philanthropist, art collector, and politician. From the wealthy Mellon family of Pittsburgh, Pennsylvania, he established a vast business empire before moving into politics. He served as United States Secretary of the Treasury from March 9, 1921, to February 12, 1932, presiding over the boom years of the 1920s and the Wall Street crash of 1929.
What is often NOT recounted regarding this quote is that Mellon was not referring to ALL bonds, but rather “Tax Free” bonds. He is widely remembered for seemingly favoring the wealthy over the middle and lower class by cutting taxes for higher income earners. His rationale was that the wealthy were being taxed so heavily (73% marginal tax rate at the time) that they invested the bulk of their money into tax-free bonds, thereby avoiding paying taxes on the income. He hoped that tax reform would encourage high earners to move their savings from tax-exempt state and municipal bonds to taxable, higher yield industrial stocks. Once the tax rates for the wealthy were reduced, the tax revenues to the country actually increased materially – which was his plan all along.
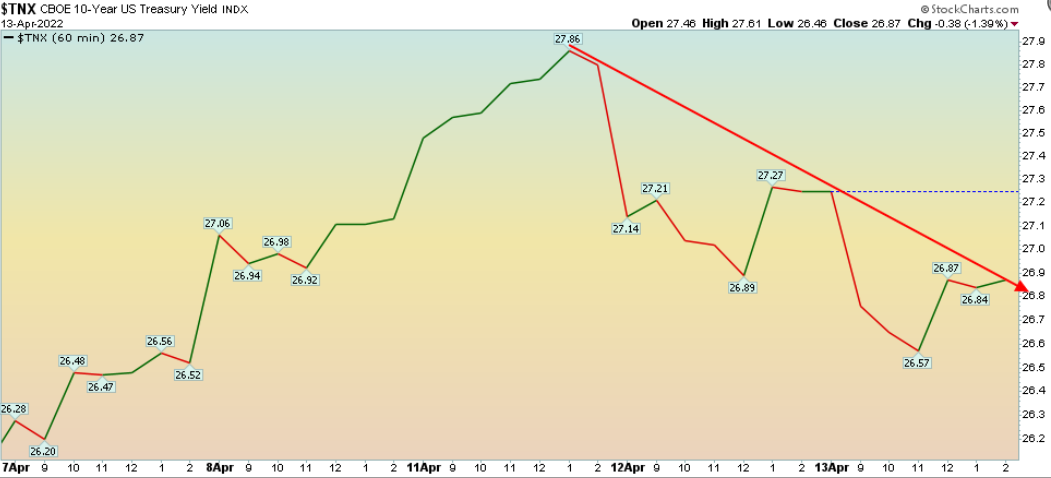
In last week’s article, we showed this chart of long-bonds – as represented by the ETF TLT: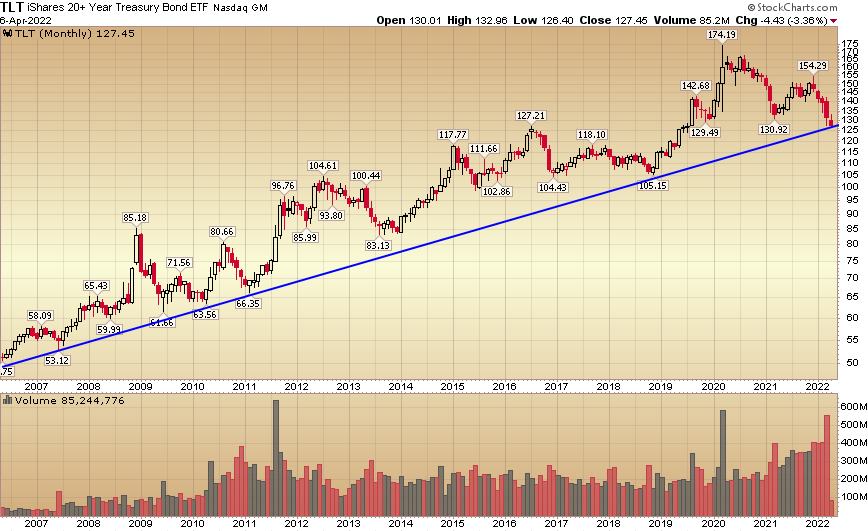 We proposed the idea that we may be approaching an inflection point where yields would stop accelerating upward and foreign bidders would step in at these levels to benefit from the relative yield play unfolding as the Fed stepped out of the market. The catalyst appears to have been the inflation prints this week. The 10yr yield finally appears to be retreating in recent sessions. We’ll see if it persists:
Institutional Sentiment – Bank of America Fund Manager Survey
Speaking of bonds, yesterday I put out a summary of the Bank of America Global Fund Manager Survey for April:
April 2022 Bank of America Global Fund Manager Survey Results (Summary)
One of the key charts that that stood out was positioning – as it relates to bonds:
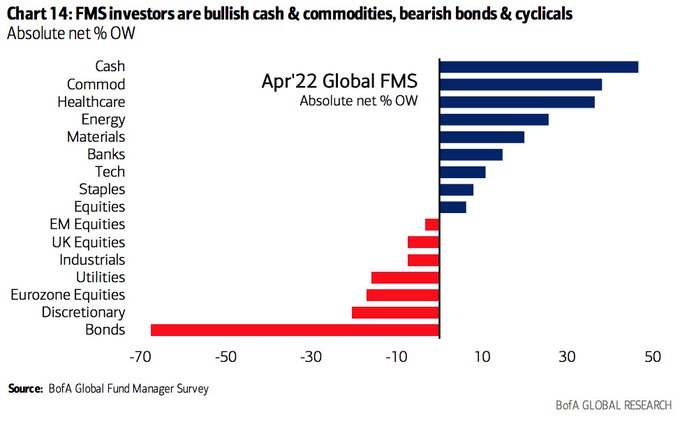
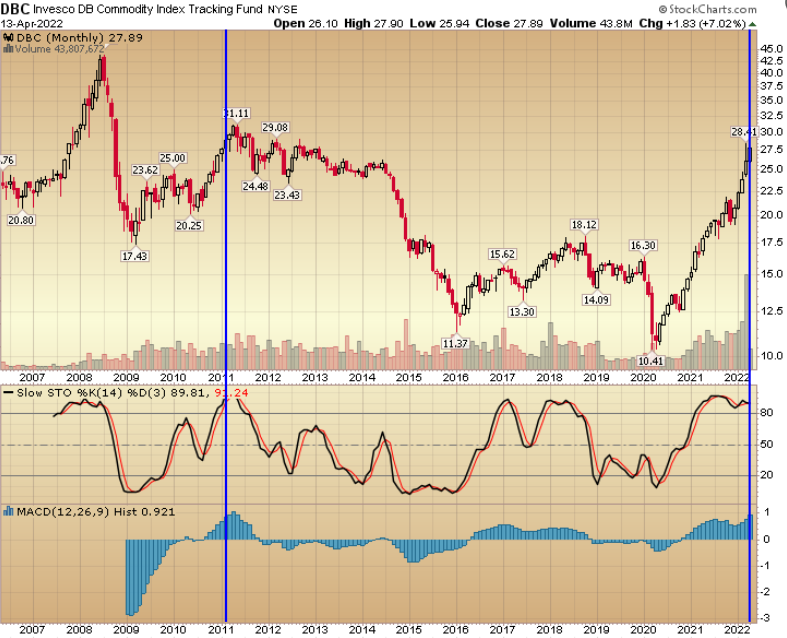
Managers have been panicking out of bonds into Commodities and Cash. As we always say, when the boat gets too crowded on one side of the trade, it’s time to take the other side. Not only are we getting close to a turn on Bonds, we may be coming up on a “peak” in commodities in the near term. This chart gives us clues:
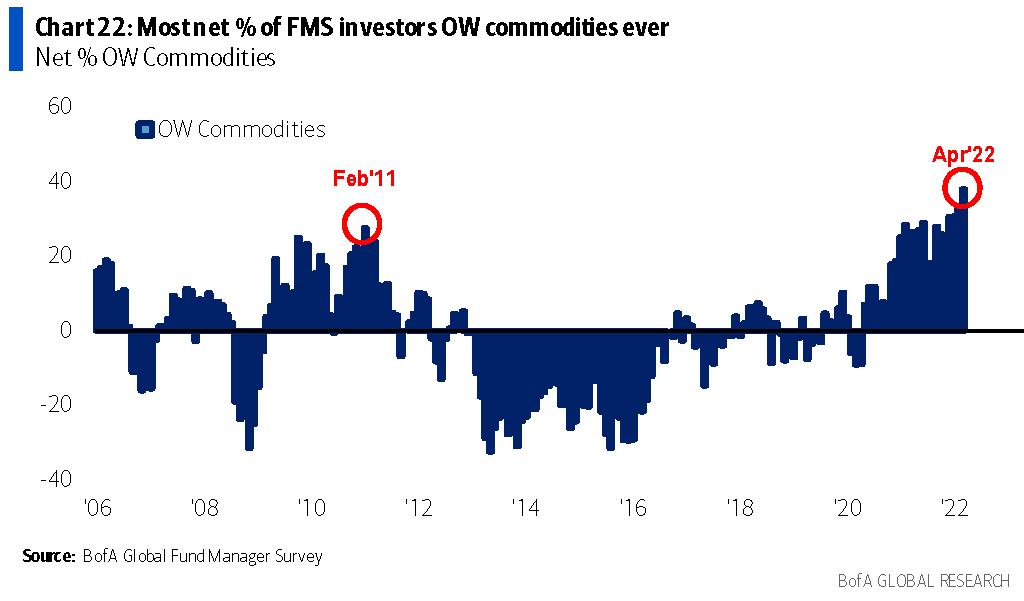
Managers are the most overweight commodities since February 2011. The peak was just eight weeks later (see blue vertical line below for February 2011):
Here’s the extreme sentiment and crowding that supports a similar reversal in coming months:
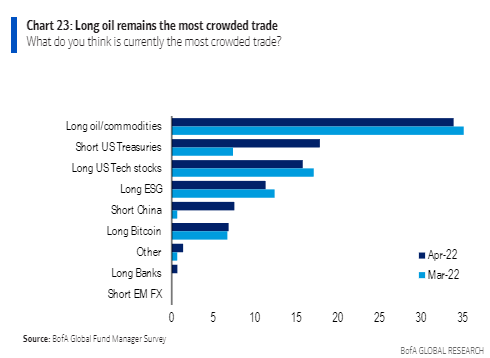
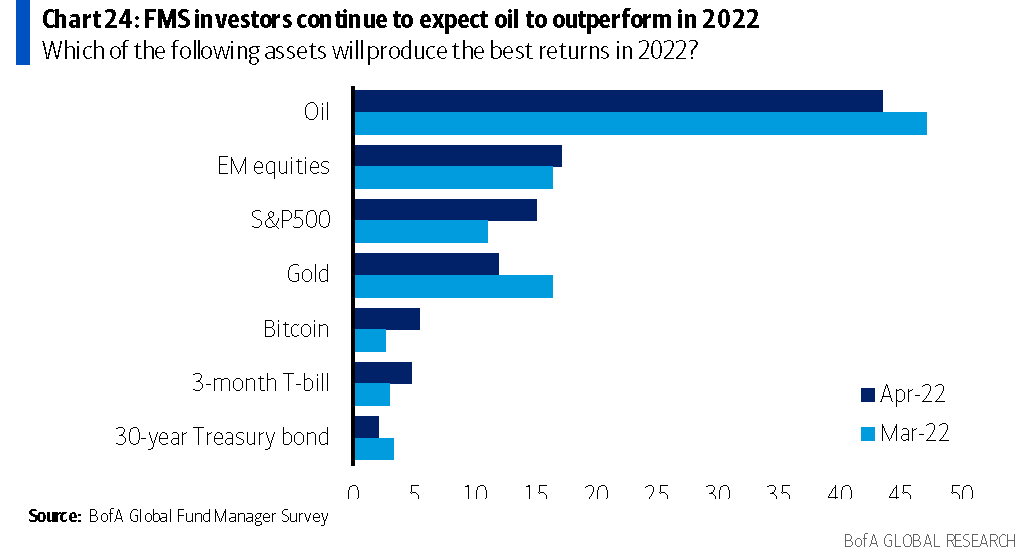
As was the case in 2011, this crowded positioning and euphoric outlook can persist for a couple more months before rolling over, but why pick up the last few nickels in front of a steam roller? The time to “crowd into” energy was fall 2020 when we were pounding the table, not today. We could revisit later in the year after a material pullback, but for now WE SIT ON OUR HANDS and focus on brighter horizons. We look through the windshield to see where the puck may be GOING, not the rear-view mirror where it has already GONE. We are now out of most energy stocks EXCEPT several natural gas names.
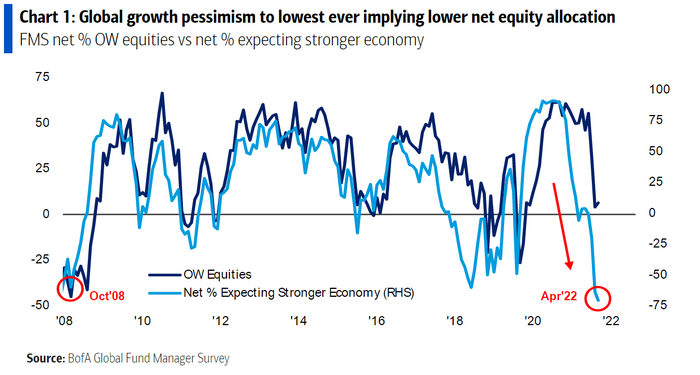
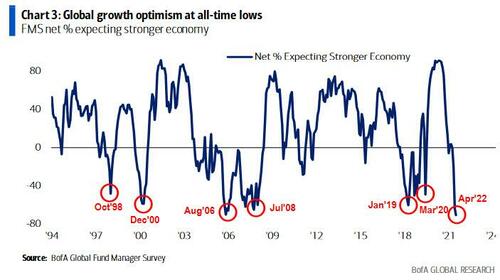
Another chart that stood out from the BofA survey was overall sentiment. Pessimism is now parallel to December 2008 levels – which was a generational buy opportunity. I do not think that such low levels of sentiment represent the same “buy everything” opportunity of late 2008, but I do think there are still several sectors/stocks that are generational buy opportunities at these levels. I’ve covered them extensively on public media appearances and our weekly VideoCast.
As you can see above (in the crowded trades), while everyone is crowding into the commodity trade – after it is long in the tooth – they are shorting what is down and likely ready to recover (China and Bonds).
Alibaba
Abhishek Vishnoy – a reporter from Bloomberg – reached out for my thoughts on China stocks/Alibaba this week. Here’s what I sent him:
China began aggressive fiscal stimulus and monetary easing in November of last year. It will be felt in the economy and seen in the numbers on a lagged basis – usually 6-9 months after commencement. The curve-ball this time is that the “zero covid” policy and lockdowns have offset the benefits of the easing – in the short term. As for China Tech – this is a temporary situation and will likely result in the big getting bigger and the small being unable to weather the short-term vicissitudes of a mercurial leadership posture. As this storm passes, and covid winds down in China, the biggest players will emerge with more share, more pricing power and more strength.
As it relates to the temporary price weakness of Alibaba, Tencent, JD, etc. I would liken it to a rental property. If you were renting out a house (with a $500,000 fair market value) for $4,000 per month – and it went vacant for a couple of months and had no income – would you take the first offer to sell that came along for $350,000? That is what sellers of Alibaba and Tencent are doing at these prices. We have had a year of “temporary impairment” of earning power due to government crackdowns, zero-covid policy stance and tight monetary and fiscal policy (up until last November). The government has reversed course on easing, nearly completed the crackdown, and are licensing the covid pill from Pfizer to produce generically (this pill – when available – will be the end of “zero covid”). Owners of these unreplaceable franchises (Alibaba and Tencent) who are “selling in the hole” – due to temporary headwinds – are no different than a landlord who sells their property at a 40% discount to fair value because it temporarily went vacant for a few months. It makes no sense and is a decision that will be deeply regretted a year out.
Then, of course, when the reports that “Munger” had sold 1/2 of his Alibaba position, the AMA questions and DMs just rolled in…
While it was an unpleasant surprise – and we would have preferred to see Munger buying more shares versus selling – here’s the number one thing you need to know about the Daily Journal/Munger sale:
IF YOU BOUGHT ALIBABA BECAUSE CHARLIE MUNGER BOUGHT ALIBABA, YOU SHOULD SELL YOUR POSITION. IF YOU BOUGHT ALIBABA BECAUSE YOU DID YOUR OWN RESEARCH AND BELIEVE IT’S A GENERATIONAL BUYING OPPORTUNITY AT THESE LEVELS/VALUATION, THEN THE HEADLINE DOES NOT MATTER.
As far as speculation on why the Daily Journal sold, it’s a useless exercise. While “insider buying” in a stock can be a useful indicator – as people only buy stock for 1 reason – (they expect it to go up over time), they sell for a multitude of reasons (that you will never know). The quantitative data over decades shows that insider buying can be indicative and insider selling has zero signal value.
Now, as for my GUESS about what happened (for entertainment purposes only):
My take on The Daily Journal sale of 1/2 their Alibaba position:
Either:
- Pressure from shareholders to “sell in the hole” + fear over margin debt used to finance the position and its impact on corporate liquidity. We saw some push back in the questioning to Charlie during the DJCO annual meeting Q&A regarding this subject. Best guess: Charlie said, “you sell it if your want to then, but I’m stepping down as Chairman.” (which he did) When people want out of a position, they dump 100% of the position & take loss, not 50%.
- They started converting their US ADS BABA shares to Hong Kong 9988 shares (as we did months ago) to offset the de-listing risk. They are not required to report (foreign holdings) in their US filings, so you would never know if they owned HK shares unless they verbally disclosed it.
These two suggestions are for entertainment purposes only and have no bearing on our investment in Alibaba. The short-term headwinds of covid shutdowns will ultimately be offset by the pig (of stimulus) working through the python (of the Chinese economy) that began in Oct/November of 2021. It’s already showing up, but the pessimism is so thick that no one can see it YET:
Actual-Estimate-Previous
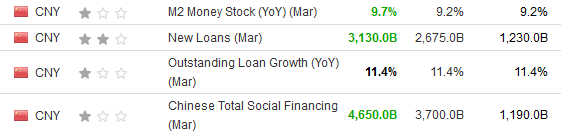
While the rest of the world is tightening policy, China is the only developed country that has been AGGRESSIVELY easing. As the shutdowns ease, the impact of the policy will begin to show up meaningfully in the economy – as we are now approaching six months since inception of the policy pivot.
Now onto the shorter term view for the General Market:
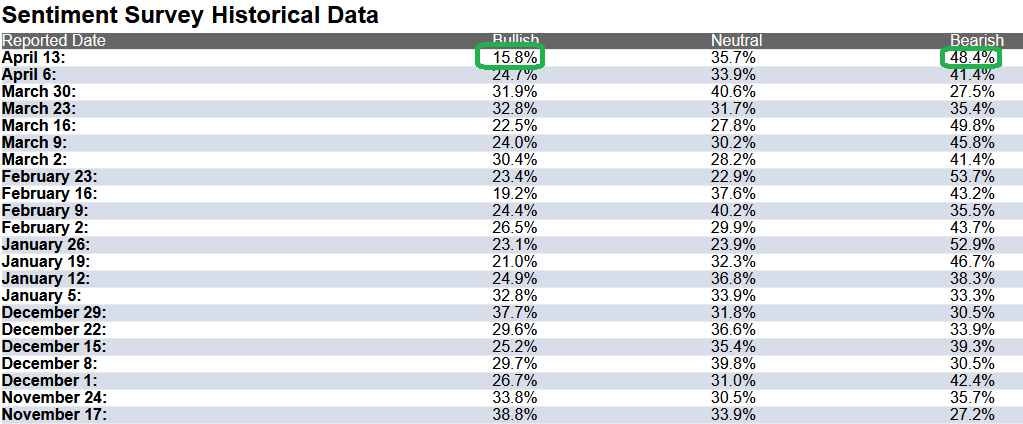
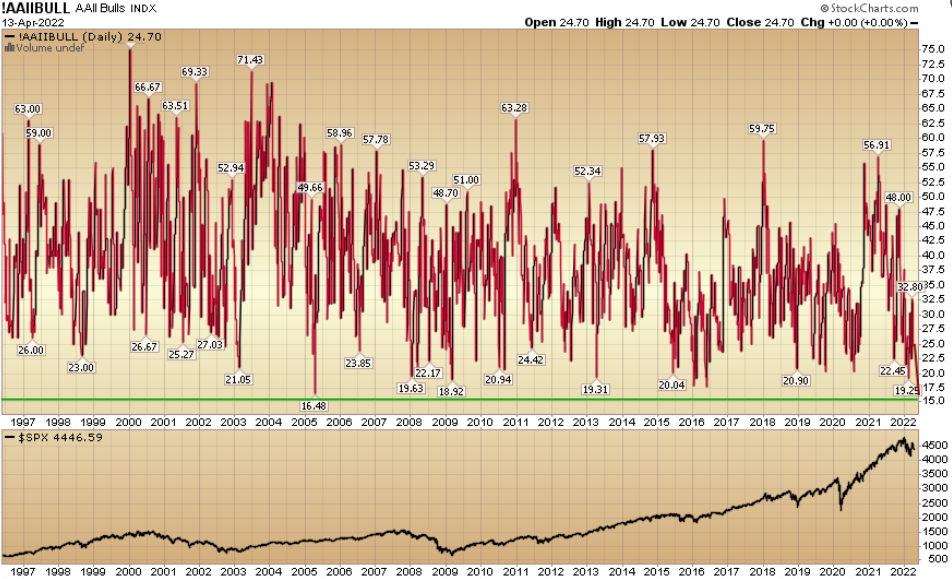
In this week’s AAII Sentiment Survey result, Bullish Percent (Video Explanation) collapsed to 15.8% this week from 24.7% last week. This is the most pessimistic sentiment in the history of the survey. Bearish Percent jumped to 48.4% from 41.4%. Retail investors have never been more fearful in history.
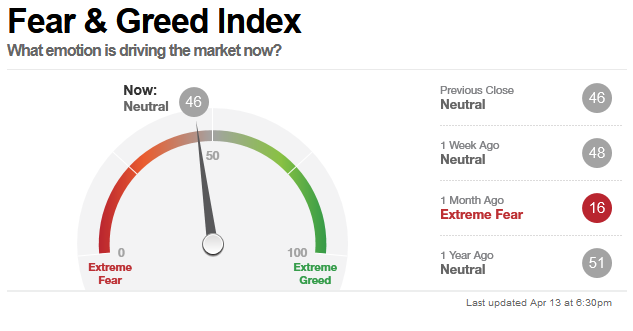
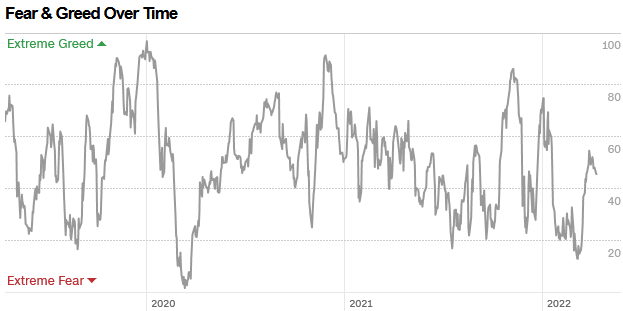
The CNN “Fear and Greed” Index ticked down from 48 last week to 46 this week. Sentiment is still cautious in the market. You can learn how this indicator is calculated and how it works here: (Video Explanation)
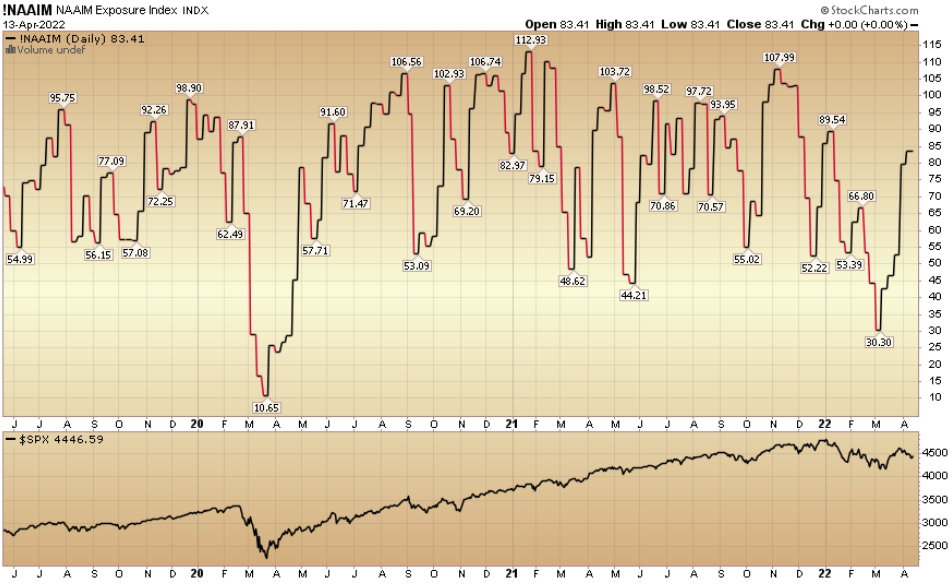
And finally, the NAAIM (National Association of Active Investment Managers Index) (Video Explanation) moved up to 83.41% this week from 79.72% equity exposure last week.
Our podcast podcast|videocast will be out on Thursday or Friday this week. Each week, we have a segment called “Ask Me Anything (AMA)” where we answer questions sent in by our audience. If you have a question for this week’s episode, please send it in at the contact form here.


