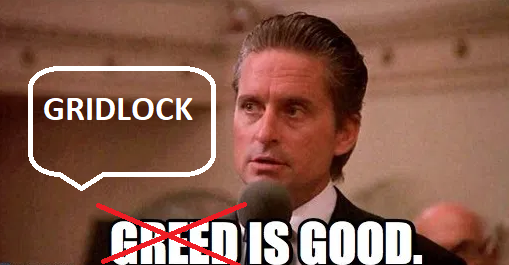
Each week, I usually choose a song that embodies the theme of the Stock Market. This week, I chose a character that Wall Street knows all too well, Gordon Gekko (from the 1987 classic film Wall Street). In his famous speech, the character played by Michael Douglas, made the case that “Greed is Good” – in a takeover attempt of a bloated, inefficient company:
Today, we’re going to make the case that “Gridlock is Good.”
The Election
As we are now 82 days out from the Election, it is paramount that we understand the implications of the Election results (as they relate to the stock market). The punchline is (for the stock market) – that it does not matter which party wins – so long as no one wins COMPLETE power (sweep of Executive, Senate and House). Here’s the data from 1928-2018 (compliments of Bank of America):
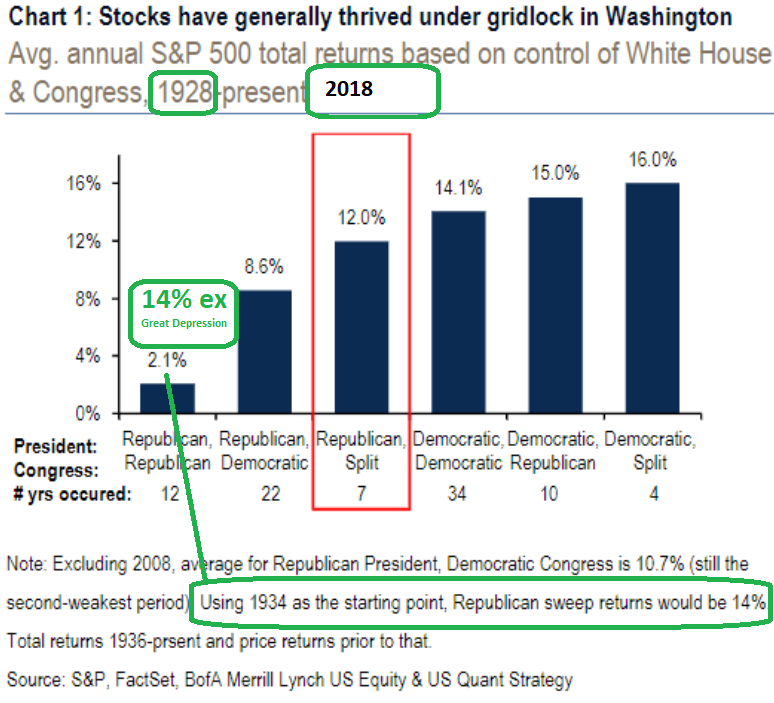
So while the table above looks relatively benign (once you scrub the Great Depression from the data), this time is actually different. Here’s why:
While a Republican (14%) or Democrat (14.1%) sweep yielded approximately the same average returns (once you scrub the black swan Great Depression), this time – the announced policy prescription – will have a mathematical impact on the the value of the stock market.
Republicans and Democrats are rather similar over time. Republicans like to Borrow and spend. Democrats like to Tax and spend. As the private equity folks reading this know all too well, “borrow and spend” looks/works better in the short term because you can show earnings power today that you would not be able to show if you had to reinvest all of your profits due to lack of borrowing. Borrow and grow always looks better than Tax and slow – in the short term.
The current Republican Administration has vowed to continue the tax cuts and possibly introduce further cuts on Capital Gains and for the Middle Class. The thesis is that growth will cover the borrowing in the long term if you spur economic growth in the short term. It worked in the 80’s and it worked in the 50’s. If you recall the Debt to GDP (ratio) from WWII – in the late 1940’s – exceeded 120%. It was down to the mid-60%’s by 1953 and growth took off…
Democratic Tax Platform
- The Democratic Ticket has committed to increasing the Corporate Tax rate from 21% to 28% (and possibly 35%).
- The Democratic Platform Taxes long-term capital gains and qualified dividends at the ordinary income tax rate of 39.6% (versus 20% long-term capital gains rate today).
- The VP (Senator Kamala Harris) has proposed a financial transactions tax, “I would tax Wall Street stock trades at 0.2%, bond trades at 0.1%, and derivative transactions at 0.002%.”
How the Corporate Tax Rate Effects Your Retirement Portfolio Value
What’s different this time is that the corporate tax rate is at play. The value of the stock market is determined by 4 factors:
1. Earnings.
2. Multiple (P/E) applied to Earnings.
3. Expected Growth Rate.
4. Discount Rate (interest rates).
The most important of the four factors is Earnings. By increasing the corporate tax rate, (which would only happen in the event of a full Democratic sweep of the Executive Branch, House and Senate) David Kostin – Goldman Sach’s head of U.S. equity strategy – said in a recent note:
The 2020 elections add to the earnings uncertainty created by the coronavirus. The odds of a Democratic sweep in November have increased substantially since February and now stand above 50%. If enacted, we estimate that the Biden tax plan would reduce our S&P 500 earnings estimate for 2021 by $20 per share, from $170 to $150.
The S&P 500 closed near all-time highs yesterday (at 3,380). Using Goldman Sach’s estimates (which are slightly higher than consensus), means the stock market is trading at 19.88x 2021 earnings (3,380/170 = 19.88). This P/E ratio of 19.88x (multiple of earnings) is slightly above the 5-year average (17.0) and above the 10-year average (15.3). It is justified only on the basis of interest-rates staying LOW (10 year treasury now at .67%) and GROWTH expectations staying HIGH.
In the 34 years (since 1928) that Democrats have ruled with absolute power (sweep of Executive and Legislative Branches), you did not have such a material CORPORATE TAX INCREASE – imminent upon election. Democrats have consistently run on higher individual tax rates for the rich, but NOT higher corporate tax rates – as we had very high corporate tax rates relative to the rest of the world – until the change under the current Administration.
If Goldman is correct, and the combined tax increases lead to a $20 decline in S&P 500 earnings, it means we are currently trading at 22.5x 2021 earnings – which is unsustainable. Furthermore, GROWTH expectations would decline as the money companies save from paying the government is invested into growth, hiring, R&D and/or circulated to owners as dividends/buybacks. This would not be the case if the tax rate was increased by 33% (from 21% to 28%).
Not only would earnings come down for the S&P 500, but GROWTH rate expectations would come down – which means the 5 year average multiple would be too high (as that was afforded in a favorable tax environment). More likely we would revert back to the 10 year average multiple (P/E) that was in place when the corporate tax rate was higher – which is 15.3x earnings.
Where does that leave us? Here’s the math:
- $150 S&P Earnings for 2021 instead of $170.
- 15.3x Earnings Multiple for 2021 instead of current 19.88x.
Result: $150 x 15.3 = 2,295 S&P Price (32.1% lower than yesterday’s closing price). The same general formula would apply to the DOW. The DJIA closed at 27,976.84 yesterday. A similar drop would take the DOW down to 18,994.14 (approximately the same levels it was at prior to the corporate tax cuts being implemented).
So for an average middle class retirement account/pension of $2,000,000 – if in the stock market – it could drop to $1,357,988. For someone who is 30 it’s no big deal. For someone who is in their 50s-70s it could be devastating and near impossible to recover from.
So the new tax policy could cost the average retiree ~$642,011 of their life savings/nest egg. No one knows for certain, but if you have a better formula that shows a different mathematical result (not opinion), I’m all ears…
This is not a commentary on social policy or style. For many people, they would gladly pay $642,011 for a change in social/political policy that they feel would be better for them/the Country. For others, they simply cannot afford to pay that much for their political preferences/ideology.
The expected drop in equity value has nothing to do with the political Party – as historically the stock market has done just as well with a Democratic sweep (Executive, House, Senate) as it has with a Republican Sweep. They average returns are ~14%.
The difference this time is that we are starting with the most favorable tax/business environment that we have ever had. When that policy is changed it will have a deleterious impact on Stock Market value.
So what do we need to see to keep asset values/retirement accounts/pensions/nest eggs at these levels and growing?
GRIDLOCK
We need enough power in each Party so that not much will change (on the corporate tax/regulation front). In other words, checks and balances. Here are the four most likely outcomes (in no particular order):
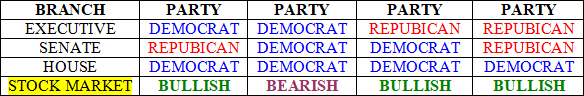
My strong suggestion is that if you vote Democrat for the Executive Branch (and you like your net worth), either don’t vote for the Senate and House, or vote the other party as a check on power (tax policy). IF the tax policy changes as proposed – so will everyone’s retirement account value (it’s simply math – see above).
It has nothing to do with the party label/ideology, but simply the formula for pricing stocks: Earnings x Multiple (function of rates and growth expectations). If earnings or the multiple (or both) go down, so will the value of the stock market and everyone’s retirement ability/value.
Something to keep in mind with regard to current polls. On last week’s VideoCast – Episode 42 I showed the election betting odds for Biden versus Trump. Neither President Trump’s chances, nor the Senate’s chances of staying Republican were very good. HOWEVER, I also asked if anyone could provide the same data from the 2016 election. I found it over the weekend, and what I learned shocked me:
As you can see at the link above, while President Trump is currently (updated as of yesterday) showing a 38.9% chance of winning in November – relative to Joe Biden at 58.2%, his odds of winning in August 2016 were even lower against Hillary Clinton:
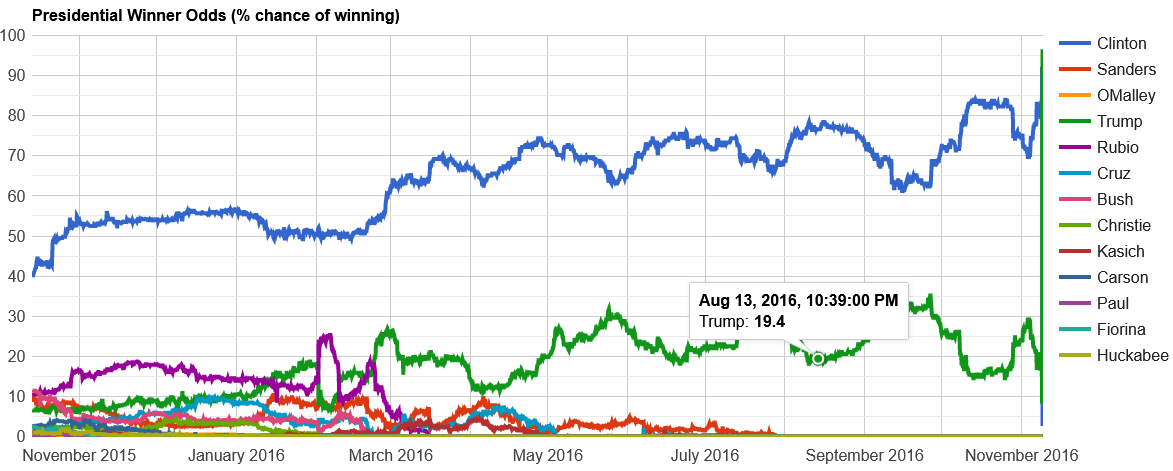
On August 13, 2016, Donald Trump had a 19.4% chance of winning the November election, relative to Hillary Clinton – who had a 76.3% chance of winning. This compares to August 13, 2020 where President Trump has a 38.9% chance of winning relative to Joe Biden’s current 58.2% chance.
In other words, no one knows what is going to happen at this point! Although, Julia La Roche did do a great article on Jeffrey Gundlach on Tuesday, and he had another strong prediction. Of note, he runs ~$100B in bonds and was one of the few who predicted the 2016 election correctly (hardly a large enough sample):
Gundlach, who called Trump’s 2016 election, predicts he’ll win again
The hopeful outcome for those who care about the stock market (or have a retirement account/pension of any amount), is that any one of the 3 “BULLISH” Gridlock outcomes I outlined above comes to pass. IF it is a blue sweep, and the tax change policy is implemented, the math will take over and bring down equity values with it (at least until rectified in the mid-term election of 2022).
Yeezus
Kanye West continues to get on ballots in swing states step-by-step. This may have an impact on Electoral Votes come November. It’s an open question, but well worth keeping an eye on:
Where Kanye West is and isn’t on the ballot for the 2020 election
As I covered in last week’s VideoCast, even if Kanye West does effect the Electoral Outcome for the Presidency (which is uncertain at this stage), he may also (at the same time) draw more voters out that would likely vote Democratic for the rest of the ticket – (i.e. Gridlock) – as there are no “Birthday Party” candidates running for the Senate or House.
Republicans would potentially win the Presidency and lose the Senate – in this case. All is pure speculation at this point, but my sense is that people are underestimating the popularity/draw and influence of Kayne West. He did not become a Billionaire – selling consumer products – without millions of young people/voters/followers buying them:
Kanye West Vaults From Broke to Billions With Yeezy in Demand
The data/developments in coming weeks will tell the story…
2020 VISION pic.twitter.com/5QQX7pIAFX
— ye (@kanyewest) August 12, 2020
From a stock market standpoint, you can be agnostic to which of the 3 “BULLISH” outcomes come to pass – and fearful of the one bearish outcome playing out. Every vote matters this time (as it relates to the stock market).
This is not a commentary on social policy or any other pluses/minuses/trade-offs. The key is whether the average potential retiree is willing to pay ~$642,011 from their own retirement in order fund the change they are looking for. In other words, you may get your cake – but you won’t be able to eat it too…
Jobs
COVID has had a material impact on jobs in the past few months – both in terms of losses as the virus spiked – and gains as we have begun to recover.
The good news is that we have regained ~43% of the jobs that were lost due to COVID – in just a few short months. That is a function of the Administration/Treasury, Congress and the Fed acting in record speed with massive action.
While Congress has not shown the same initiative in recent days, what was implemented in March/April should be a sufficient bridge to a vaccine/treatment/herd immunity scenario. More would be better (particularly a final $1,200 stimulus payment to lower and middle income households), but with M2 money supply growth up ~25% since March, that liquidity will work its way to “Main Street” over time.
After reaching the lowest unemployment rate since the early 1950’s earlier this year (3.5% in February), the virus caused unemployment to spike up to 14.7% in 30 days – as the Country was shut down in order to save lives. We have since fallen to 10.2% unemployment in just a few months, but there is a lot of work yet to go:
source: tradingeconomics.com
Continuing Claims, which is the number of people who qualify for unemployment benefits, spiked to 24.9M – but have since fallen 35.3% to 16.1M.
Initial Jobless claims spiked to 6.86M following the business shutdown. They have since fallen by 83.69% to – 1.18M in the past 6 months.
Unlike the Great Financial Crisis of 2008-2009, the Average Weekly Hours worked by non-farm payrolls did not plummet this time. They have quickly recovered to recent highs.
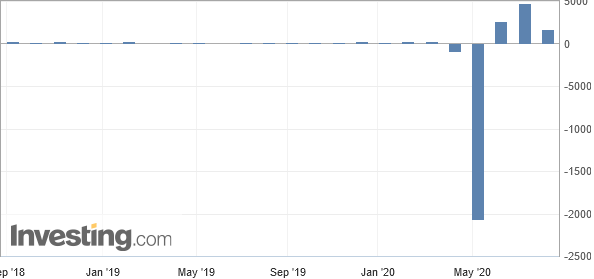
While we lost a total of 21.5M non-farm payroll jobs in March/April, we regained 9.25M in May-July. We have regained ~43% of the jobs lost (due to the COVID-19 business shutdown) in the past 3 months. Another $1T of stimulus would go a long way to bridge the people most directly impacted by this tragedy – but it is unclear whether Congress will pull it together to for the benefit of those in greatest need.
In the mean time, the Administration has extended the enhanced unemployment benefit (which doubles their normal state benefit) – by Executive Order. President Trump has also put a moratorium on Foreclosures and Evictions for those most at risk.
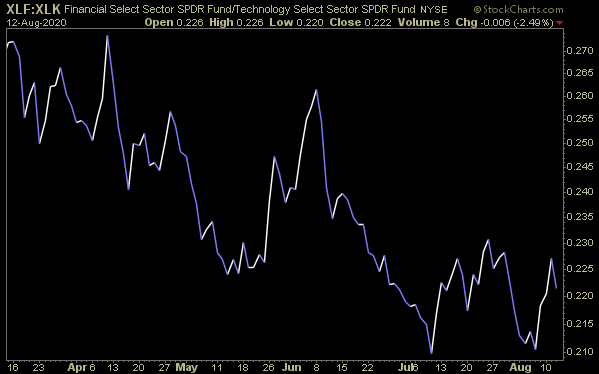
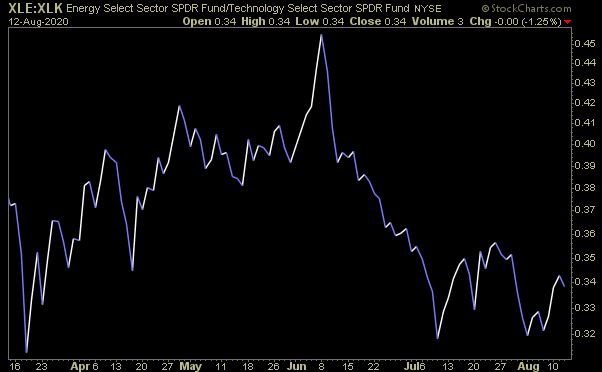
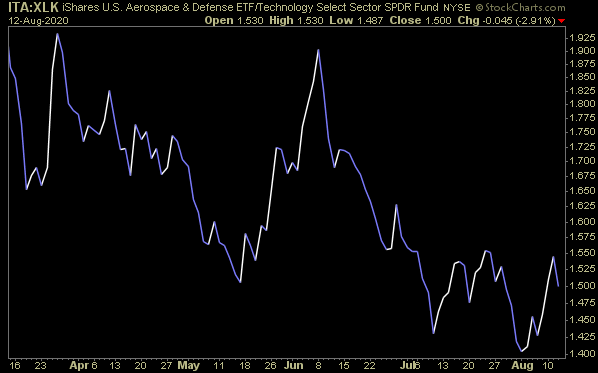
CYCLICALS UPDATE
In recent weeks, we have spent a lot of time talking about a rotation into cyclicals for the early stage of the recovery (when growth rates are high). As we get closer and closer to a vaccine/treatment/herd immunity, this trade will become more and more apparent.
This week we saw a nice bounce in the relative performance of the cyclical groups we have recently covered (Financials, Energy, Defense, Homebuilders) relative to Technology:
Ratio Chart – Financials (XLF): Technology (XLK)
 Ratio Chart – Energy (XLE): Technology (XLK)
Ratio Chart – Defense and Aerospace (ITA): Technology (XLK)
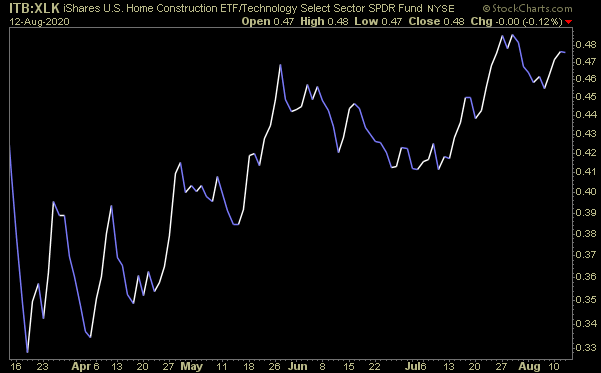
Ratio Chart – Homebuilders (ITB): Technology (XLK)
Now onto the shorter term view for the General Market:
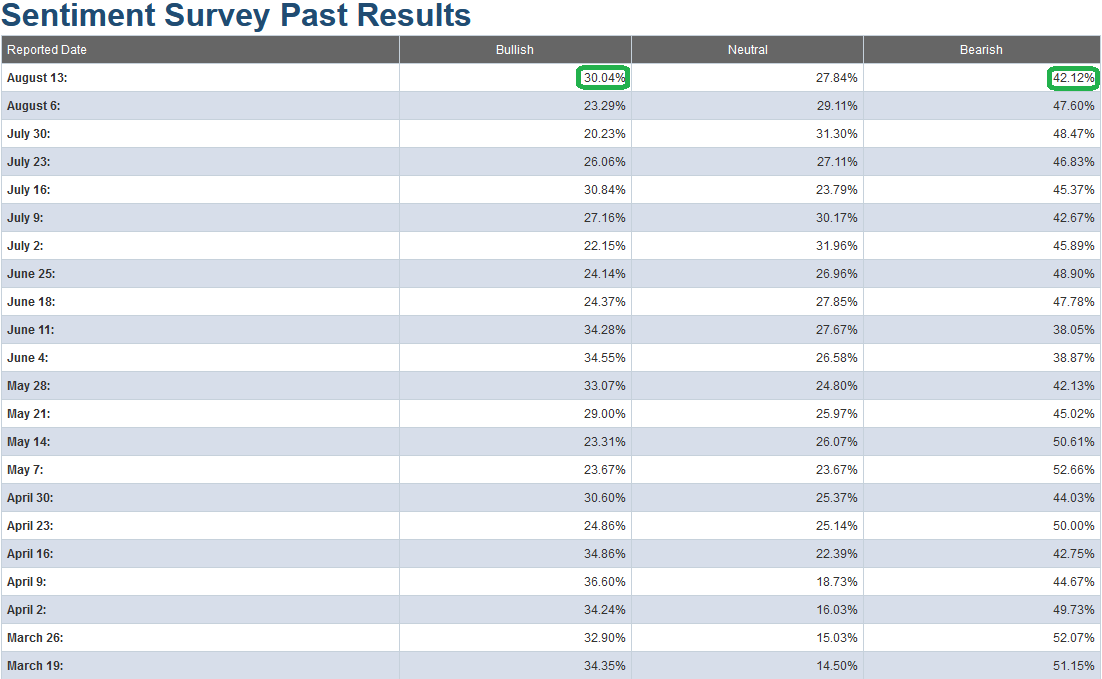
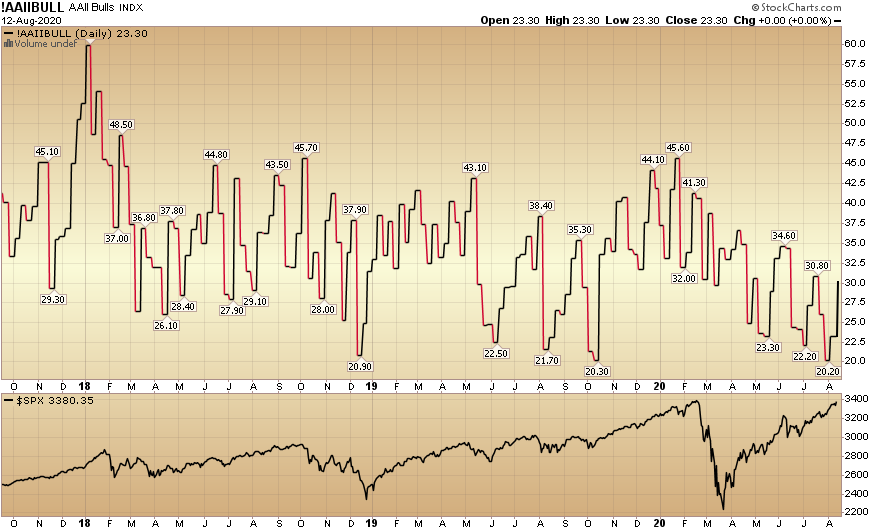
In this week’s AAII Sentiment Survey result, Bullish Percent (Video Explanation) rose to 30.04% from 23.29% last week. Bearish Percent dropped to 42.12% from 47.60% last week.
While a bit of optimism started to finally creep in this week, we are still nowhere near euphoric levels. By this metric, there is room to climb the “Wall of Worry,” but that could change in coming days/weeks when euphoric levels start to return. We have not seen a “Bullish Percent” read above 40 since February.
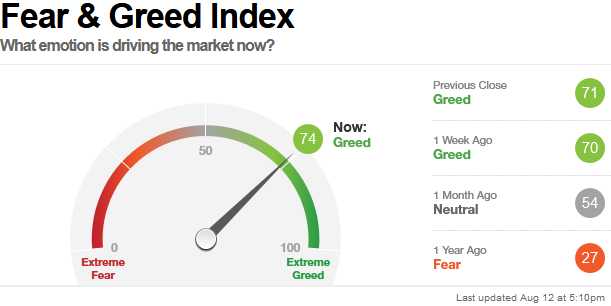
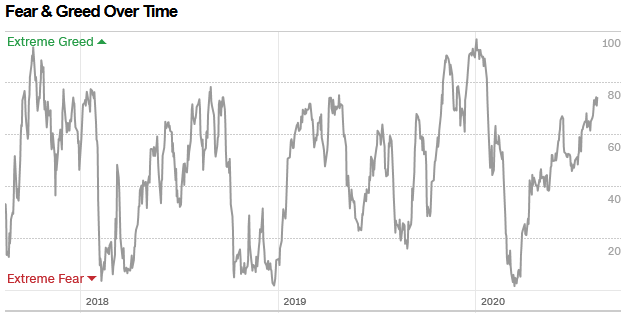
The CNN “Fear and Greed” Index moved up from 70 last week to 74 this week. While we are now near frothy conditions, we have still not hit an extreme/euphoric level (80-100) yet. You can learn how this indicator is calculated and how it works here: (Video Explanation)
And finally, this week the NAAIM (National Association of Active Investment Managers Index) (Video Explanation) cooled a bit from 97.44% equity exposure last week, to 94.55% this week. This is still an extreme level, so we must continue to keep an eye on it.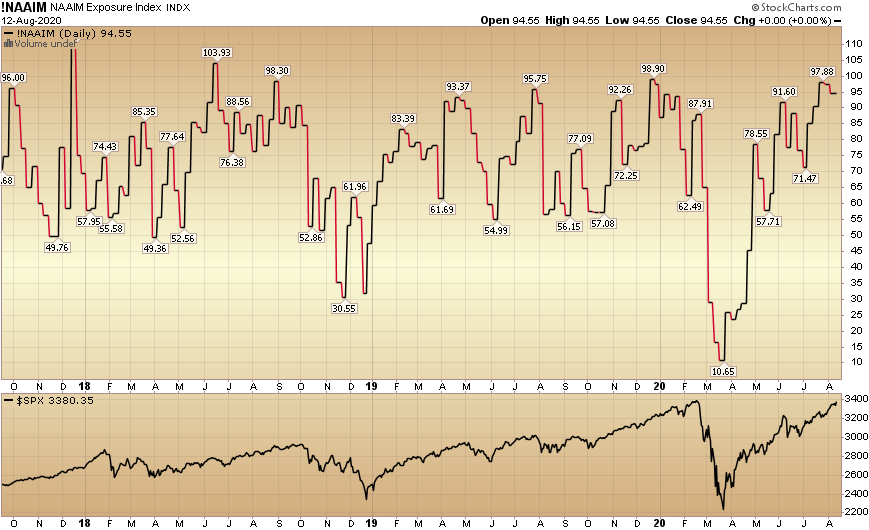
Our message for this week:
We remain very constructive in the intermediate term and will take advantage of any additional buying opportunities in laggard/cyclical names – should they arise over the Summer/Fall (on any pullbacks/corrections). I would not be surprised to see a bit of volatility/chop over the next few week(s) – likely AFTER making new highs in the S&P 500.
But for now, remember – no matter what your political/social ideology – as it pertains to the Stock Market, “Gridlock is Good!“