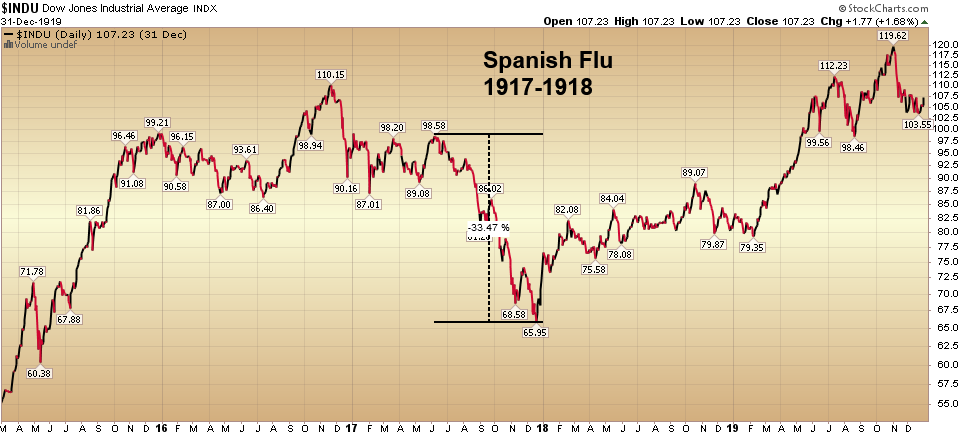
According to wikipedia, in 1917, military pathologists reported the onset of a new disease with high mortality that they later recognized as the flu. By late 1917, there had already been a first wave of the epidemic. October 1918 was the deadliest month of the whole pandemic. It is estimated to have killed ~50M people (~3% of the global population at the time).
In the chart above, you will see how the Dow Jones Industrial Average performed over this period. It is unclear whether the epidemic was known as early as 1916 (the market peak), but even if you go off an unrelated peak, the max drawdown for the market was 40%. If you use the 1917 market peak as your starting point, the drawdown was 33%. Note that the deadliest month of the flu was October 1918 when the market had already rallied 35% off the bottom.
Just as the market started discounting the worst case scenario in 1917, it was already discounting a recovery months before the worst case scenario actually occurred in 1918.
Let’s compare that to what we have seen so far:
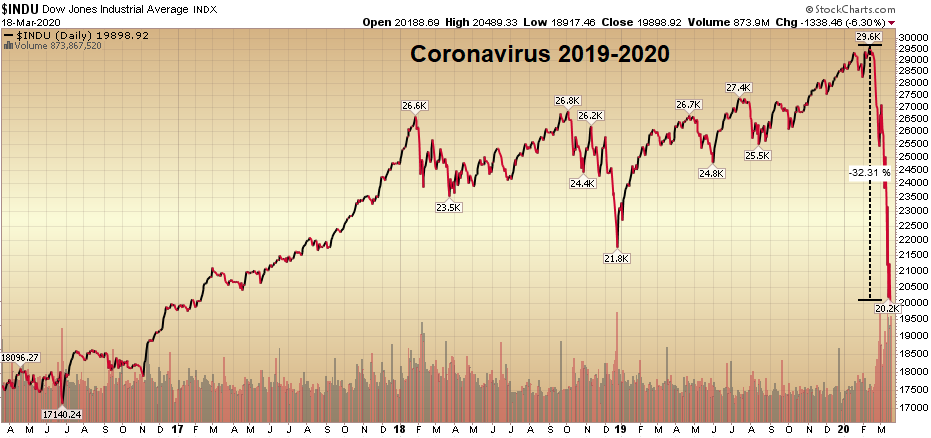
If you use the flu top from 1917 – when they actually knew about the epidemic, we have now fallen approximately the same amount (discounting the worst) as was seen in 1917 (~33%). The difference is that we have better medicine, methods and experience to mitigate the outcome – relative to what they had available in 1917-1918.
So while the worst was ahead in terms of the Spanish Flu in December of 1917, the worst was done for the stock market after the 33% drop. That does not mean we will repeat the exact trajectory, it’s just something to bear in mind moving forward. The market has already discounted a lot of pain based on its current drop. It will be just as quick to discount a recovery once the initial shock subsides.
As for “Coo coo ca choo” (from the article title), this was simply a phrase used in the Beatles song I Am the Walrus. According to the Urban Dictionary, a widely accepted variation of the meaning of “Coo coo ca choo” is a slang way to assure the state of things is entirely fine; an expression of reassuring goodness. I’m not saying we’re there yet, I’m just saying we will be (follow the guidelines and have faith)…
A Framework to Consider
No one can accurately pick the “bottom’ of the stock market, but here is a framework that might be helpful in how to think about it. There is opportunity for those who are willing to look out a year or so down the road.
If you owned a 100 unit apartment building that paid you rental income for the last ten years – and you knew would continue to pay you rent every year for the next twenty years and beyond – would you be willing to sell it at 50% off today (to another investor) just because it might not pay you any rent for the next 2-5 months?
That is what is happening with some major high quality companies (stocks) at present:
| Company | Ticker | Down from peak this year | Approx. Dividend Yield at Low |
| Wells Fargo | WFC | 52% | 7% |
| United Technologies | UTX | 56% | 3.70% |
| Pfizer | PFE | 27% | 4.70% |
| Cisco | CSCO | 35% | 3.80% |
| 3M Co. | MMM | 29.20% | 4.30% |
| AbbVie | ABBV | 27.40% | 6.64% |
| JP Morgan | JPM | 41.74% | 4.30% |
So while they could all go lower if news gets worse in the short term, you have to ask yourself what do you think their business will look like 12-24 months down the road? If the answer is that they will recover and likely do more business in future years (than last year), there may be opportunity in coming days and weeks to add prudently for the long term (and not worry about short term fluctuations).
If we can see cases peaking in the next 3-6 weeks and the stimulus package is large enough to hold people over ($1-2T), we may be nearing a bottom (in the stock market) right now. No one knows for sure. Right now the market has already discounted a considerable amount of economic contraction.
If the virus goes on beyond what we have seen in China (in time), it is possible we could drop significantly more, but that is a lower probability. There is no way to perfectly handicap this (until you know what the case curve/duration looks like), but regardless of what the general market does in coming weeks, I see opportunity on a company by company basis now and am nibbling each “down” day and sitting tight each green day.
Here is what is needed for a big turnaround:
1. $1T+ Fiscal Stimulus package passed (to start). It will probably be $2T when all is said and done in coming months.
2. An anti-viral/treatment approved for severe cases. There are a few possibilities we have covered in past notes and on Twitter.
3. New cases peak in the US.
4. Ideally, OPEC+ reverses their decision and cuts production. They are not doing themselves any favors right now. This would stabilize credit markets quickly.
5. Vaccine needed ideally by Fall.
Now onto the shorter term view for the General Market:
This week Bank of America put out its monthly Global Fund Manager Survey. If you haven’t read my summary, you can find it below. The most important point (in my view) was looking at the last time managers were this underweight financials/banks (July 2016) and what happened next:
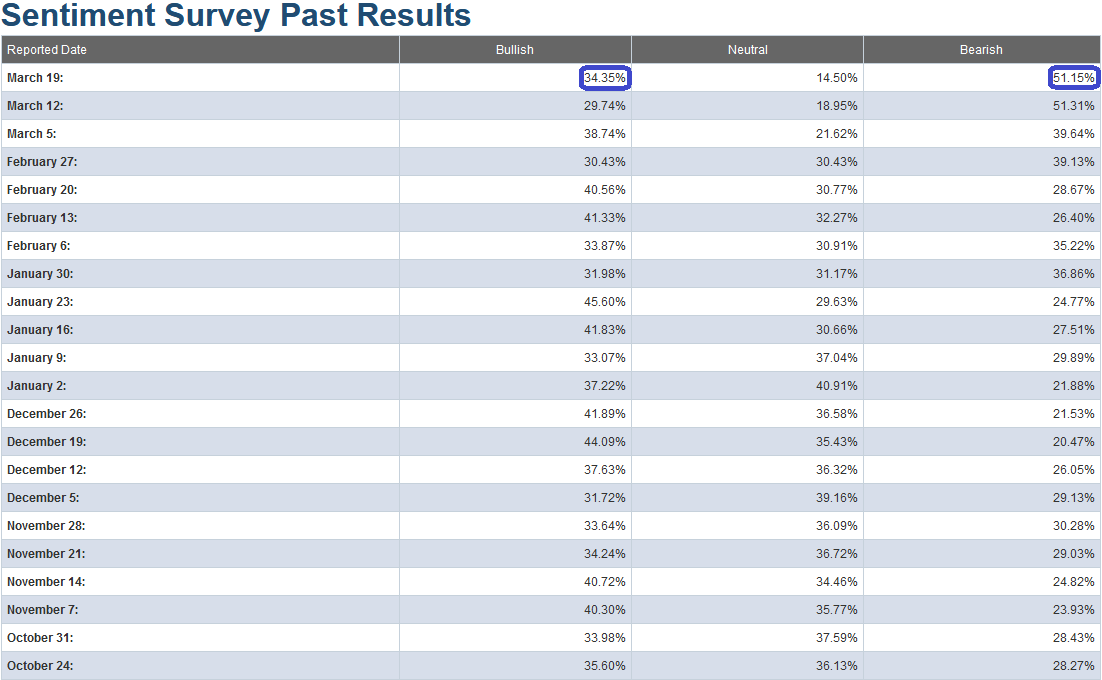
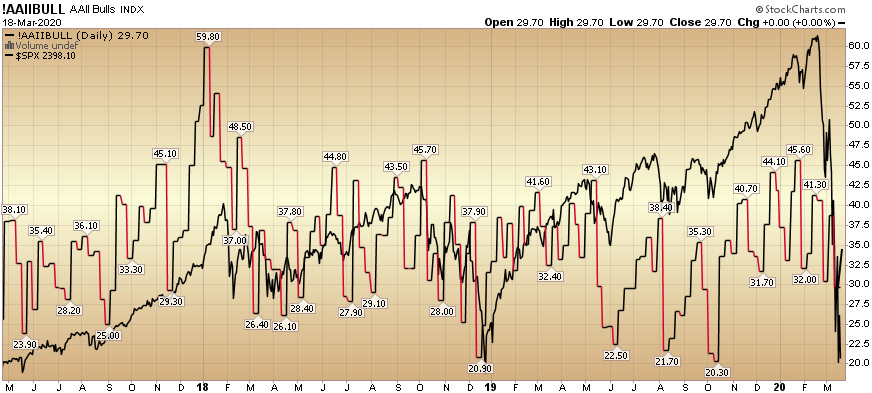
This week’s AAII Sentiment Survey result (Video Explanation) Bullish Percent rose to 34.35% from 29.74% last week. Bearish Percent ticked down to 51.15% from 51.31% last week. Neutrality dropped from 18.95% last week to 14.50% this week. While bearishness is at an elevated level, Bullishness is still a bit high to call complete capitulation. My sense is yesterday’s price movement was not fully reflected in this survey as most participants submit their survey throughout the week.
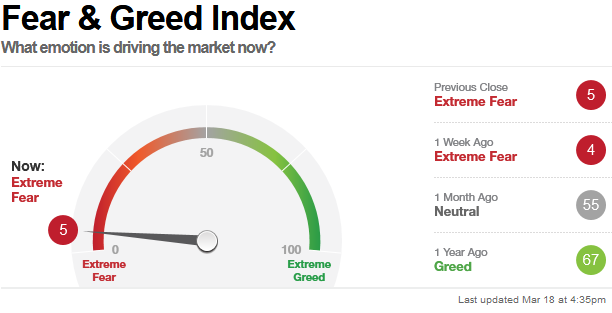
The CNN “Fear and Greed” Index rose from 4 last week to 5 this week. We are at an extreme in sentiment on this measure. You can learn how this indicator is calculated and how it works here: (Video Explanation)
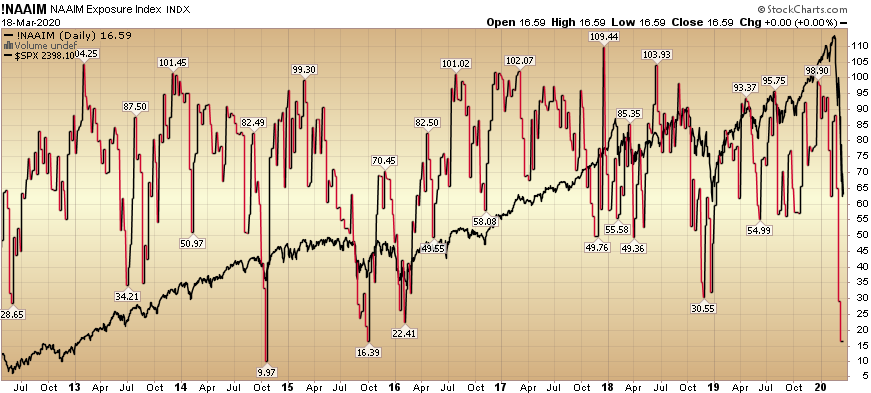
And finally, this week the NAAIM (National Association of Active Investment Managers Index) (Video Explanation Here) dropped from 29.03% equity exposure last week, to 16.59% this week.
Our message for this week is similar to last week:
We are selectively and slowly adding to those stocks/sectors which are nearing valuation levels that we would define as “pricing in at/near the worst case scenario.”
Most stocks do not yet meet this measure (as the “worst case” is unlikely to materialize), but for those that do we are adding and will continue to do so as opportunity presents itself in coming days and weeks.
But for now, it’s day by day and opportunistic execution…