
Key Market Outlook(s) and Pick(s)
On Friday, I joined Liz Claman on Fox Business’ The Claman Countdown to discuss markets, the economy, Iran, energy, and a lot more. Thanks to Liz and Brooke Haliscak for having me on:
On Wednesday, I joined Stuart Varney on Fox Business’ Varney & Co. to discuss markets, the economy, Iran, oil, Pfizer ($PFE), and a lot more. Thanks to Stuart and Maggie Edwards for having me on:
On Friday, I joined Brian Sozzi on Yahoo! Finance to discuss markets, the economy, Iran, energy, earnings, and a lot more. Thanks to Brian and Justin Oliver for having me on:
Long Live the Consumer
When everyone is running away from the consumer, that’s exactly when you want to be moving toward it.
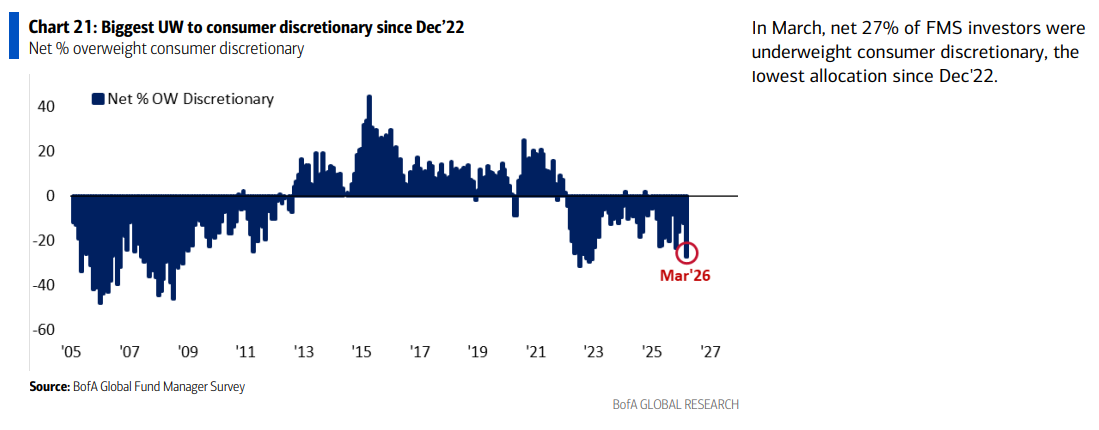
Consumer sentiment was already in the gutter heading into the Iran conflict, and recent weeks have only accelerated the mass exodus out of anything consumer-related, serving up a silver platter of opportunities to add exposure to some of our favorite beaten-down names, whether it’s the VF Corps, the Disneys, or the Papa John’s of the world.
Fund managers are completely offside and have reached peak pessimism toward the sector, with allocations falling back to October 2022 lows. Meanwhile, consumer sentiment has fallen toward extreme lows not seen outside of the 2022 inflation shock, COVID, the European debt crisis, the GFC, the Gulf War, and the stagflation of the 1980s.
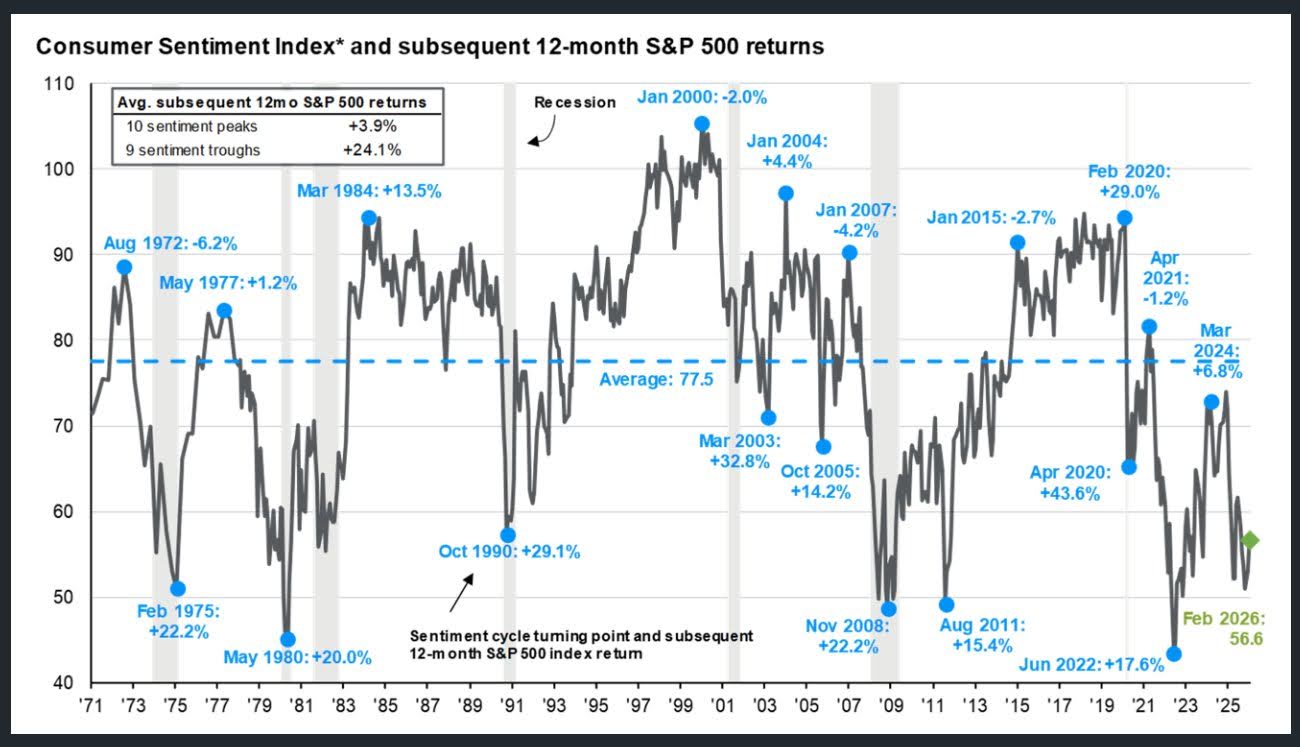
If there’s one thing history has proven time and time again, it’s that these pockets of dislocation are where the best buying opportunities are born. The pessimists always sound smart in the short term, but it’s the optimists who make the money over the long run. At these washed-out extremes, either sentiment is right and the world falls apart, or it isn’t and things get better. And if the world really does end, we have far bigger problems than our stocks.
With that in mind, these are the levels where you want to be a buyer, and consumer names often offer the biggest bang for your buck as things resolve.
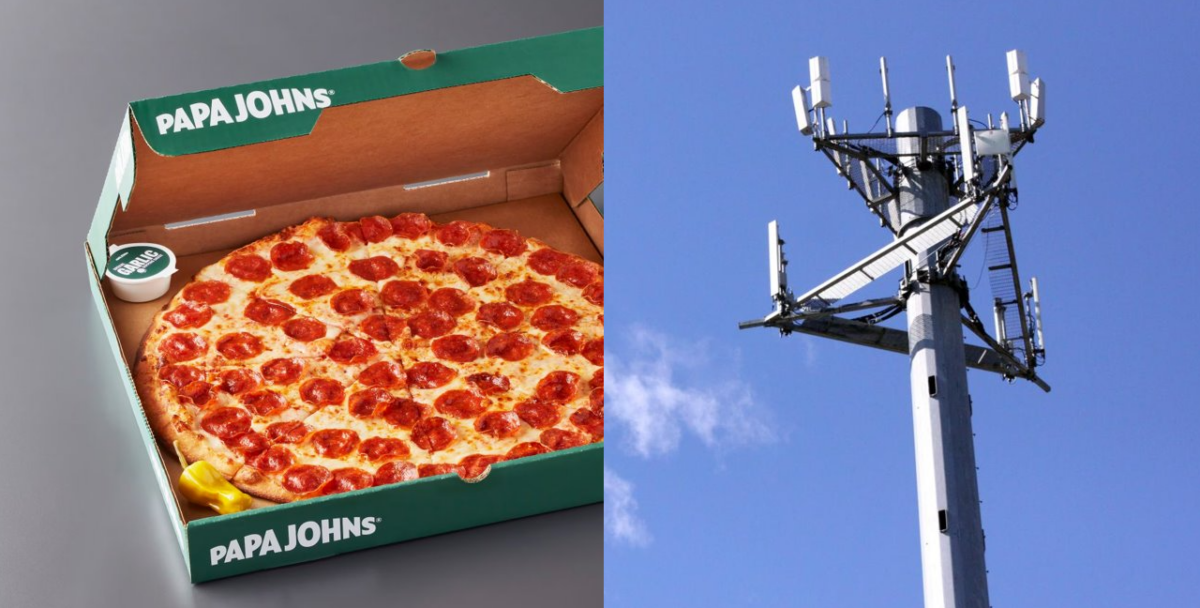
That brings us to one of our favorite beaten-down names in the restaurant space, Papa John’s:
PZZA Update
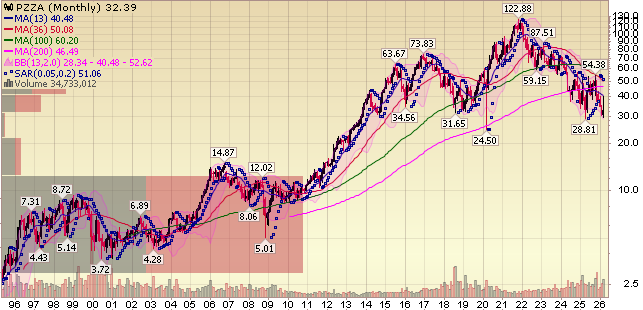
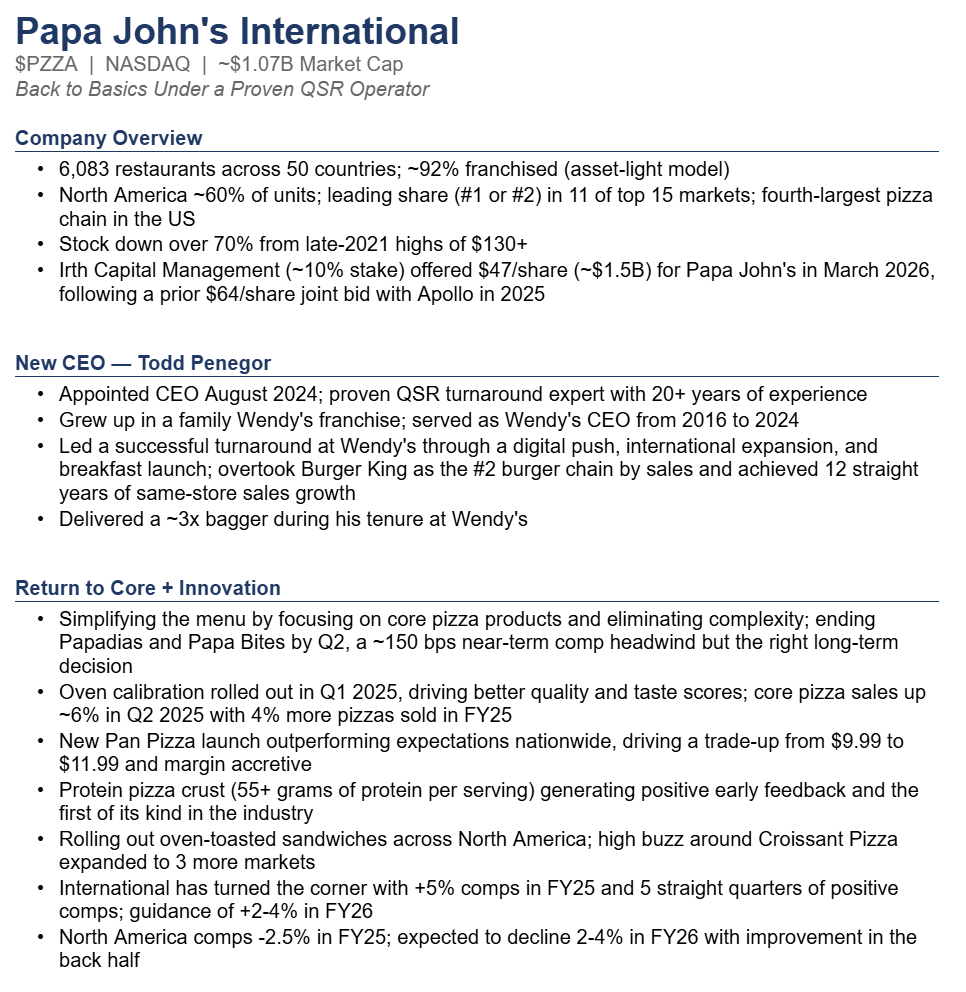
For newer readers, here’s a quick overview of the key drivers behind our thesis on Papa John’s:
We laid out the full thesis in detail in the article linked below:
“Turnaround on the Menu” Stock Market (and Sentiment Results)…
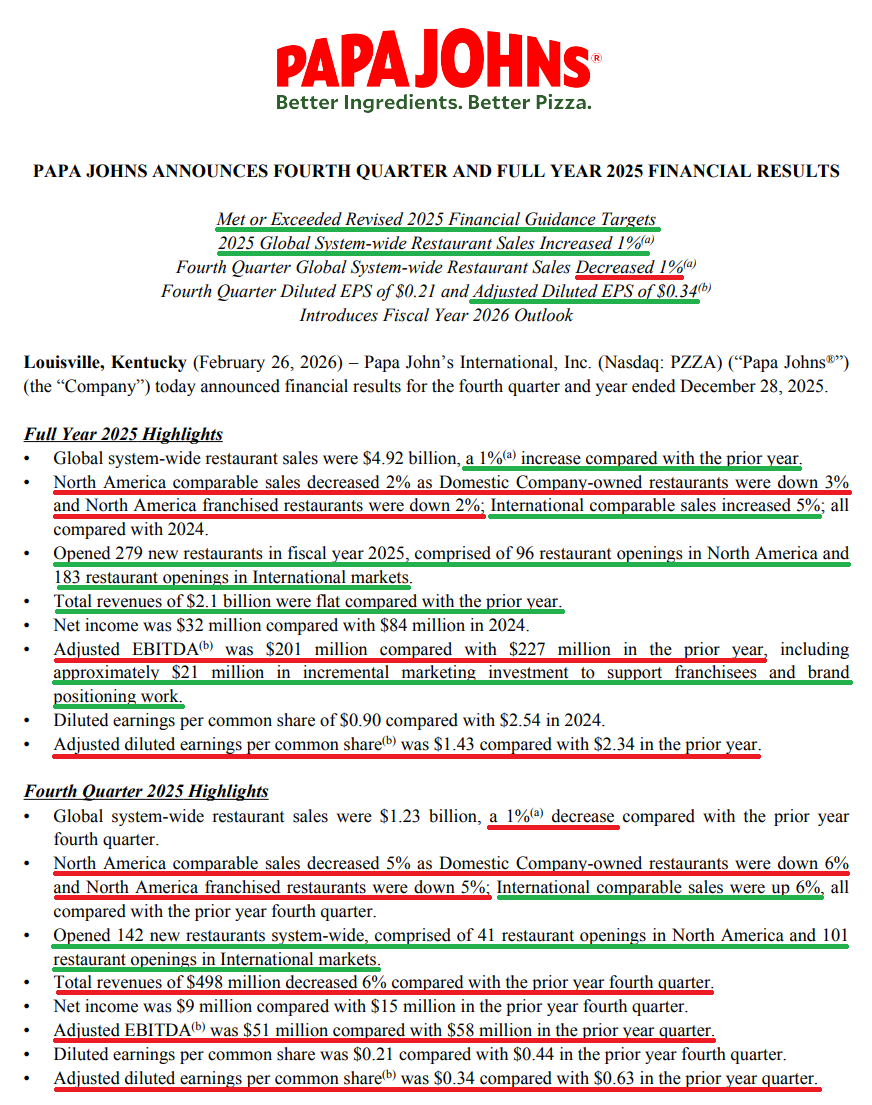
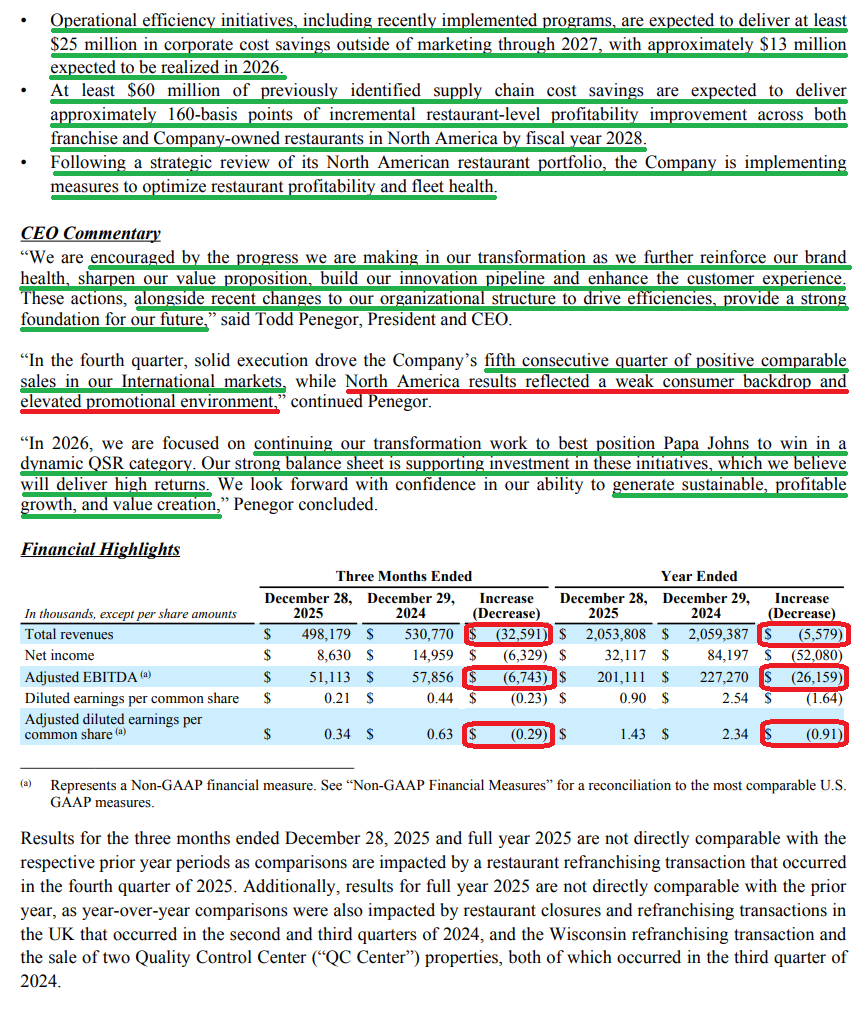
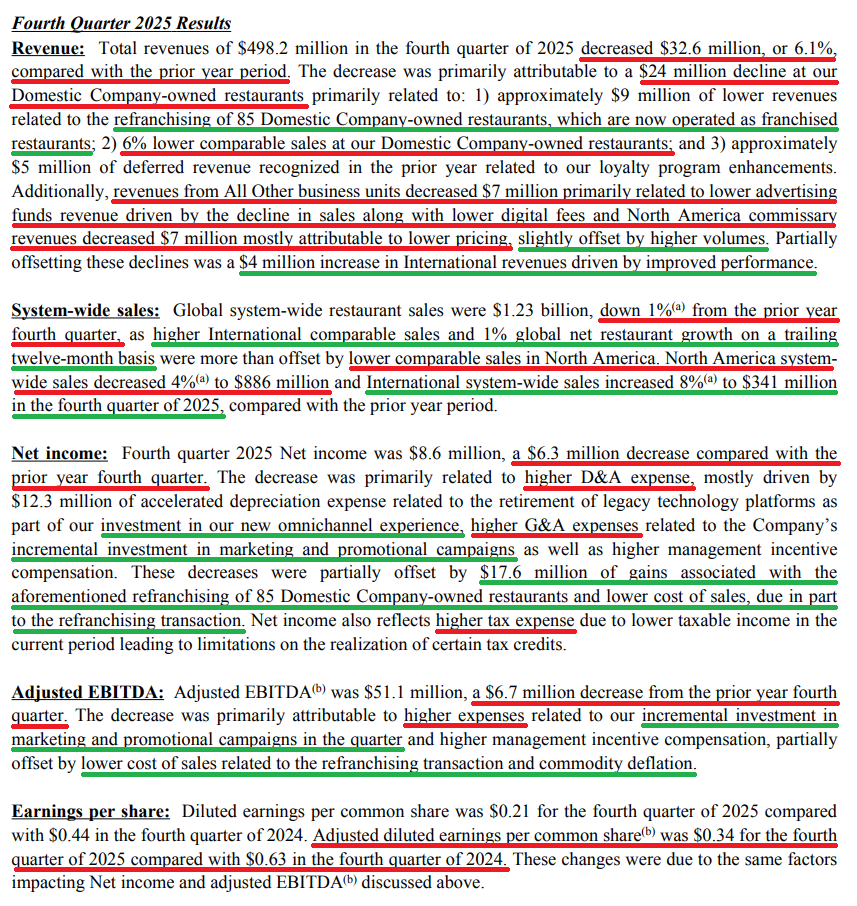
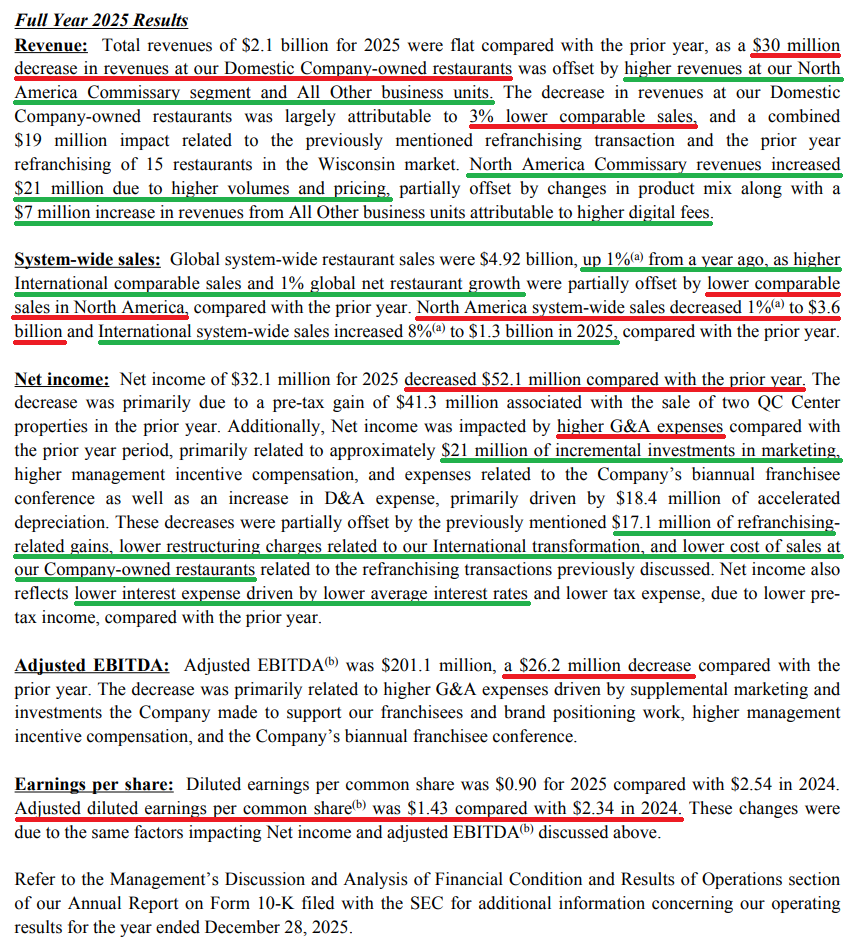
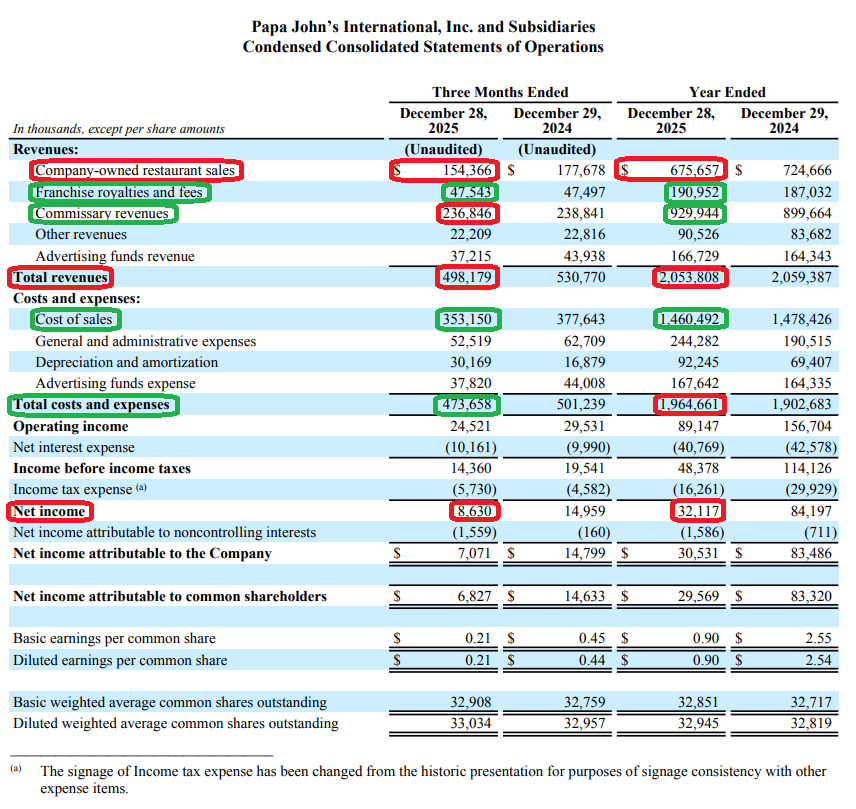
While Papa John’s Q4 headline numbers weren’t anything to write home about, with top-line revenue of $498M falling short and North America comps down 5.4%, look under the surface and you see a management team pulling all the right levers and executing exactly as promised: ripping off the band-aid, cleaning up operations, and returning the brand to what made it great. That’s exactly what we signed up for, and that’s exactly what the quarter put on display.
Of course, the earnings report was quickly put on the back burner following reports of a second lowball offer to take the business private, this time at $47/share from Irth Capital, coming on the heels of the $64/share bid from Irth and Apollo in late 2025. Noise around a potential takeout is nothing new for PZZA, and we view this offer the same way we have every in-the-hole bid for early-stage turnaround names we’ve held, whether it was GXO in 2024, Canada Goose in August 2025, or the more recent rumors around PayPal. We didn’t get involved in any of these names to make a quick buck, and we have no interest in selling at the very start of a turnaround. In the case of PZZA, accepting a deal at these levels would be highway robbery of all the upside ahead.
As management said the last time this came up, the greatest opportunity to create value is through executing the turnaround plan. We couldn’t agree more. What we’re betting on is a back-to-basics turnaround led by a proven QSR operator in Todd Penegor, and the early signs that the playbook is working are already showing up.
The name of the game with the PZZA turnaround is restoring what made the brand great and refocusing on core pizza. That starts with fixing North America by taking a page out of the same playbook that successfully turned International around, a business that has now delivered five straight quarters of positive comps and +5% comps in FY25. To get there, management is cleaning up the restaurant footprint by targeting ~300 underperforming North America locations for closure by the end of 2027, many of which were operating at negative 4-wall EBITDA, while simultaneously taking out over $85M in combined supply chain and G&A costs and targeting ~200 bps of 4-wall EBITDA margin expansion by FY2028 for the remaining fleet.
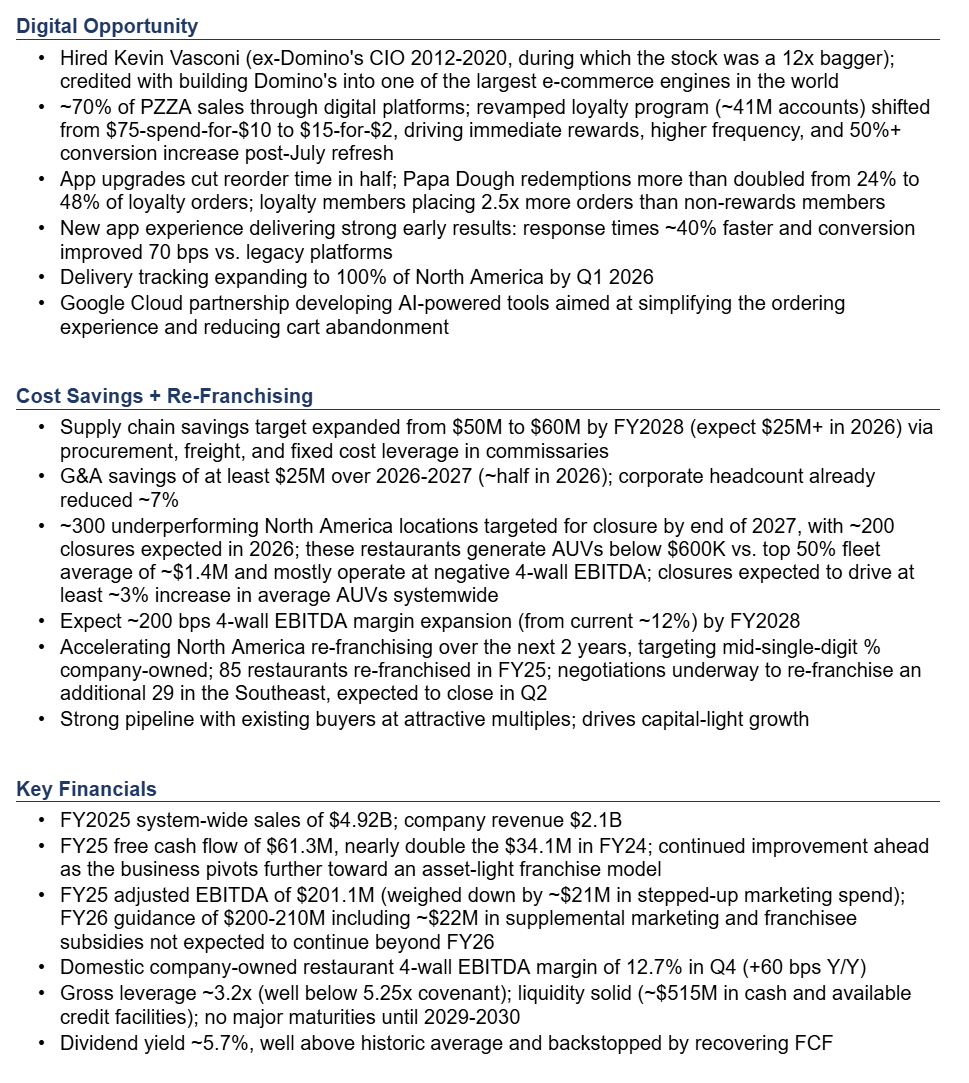
And while all that heavy lifting gets done, the biggest driver of the turnaround is returning focus to the product, the innovation pipeline, and restoring the marketing strategy that built the brand. Green shoots are already showing up across all three: pizza sales were up 4% in FY25, new launches like Pan Pizza are outperforming expectations nationwide, and 50 co-ops are now back up and running, covering the majority of North America systemwide sales and priority markets, replacing the flawed national marketing strategy that prior management had pivoted to.
This is as blocking-and-tackling of a turnaround as they come. No groundbreaking innovation needed, just great pizza and operational discipline. For a proven QSR operator like Todd Penegor, who delivered a 3x bagger at Wendy’s, we have no doubt he gets this done.
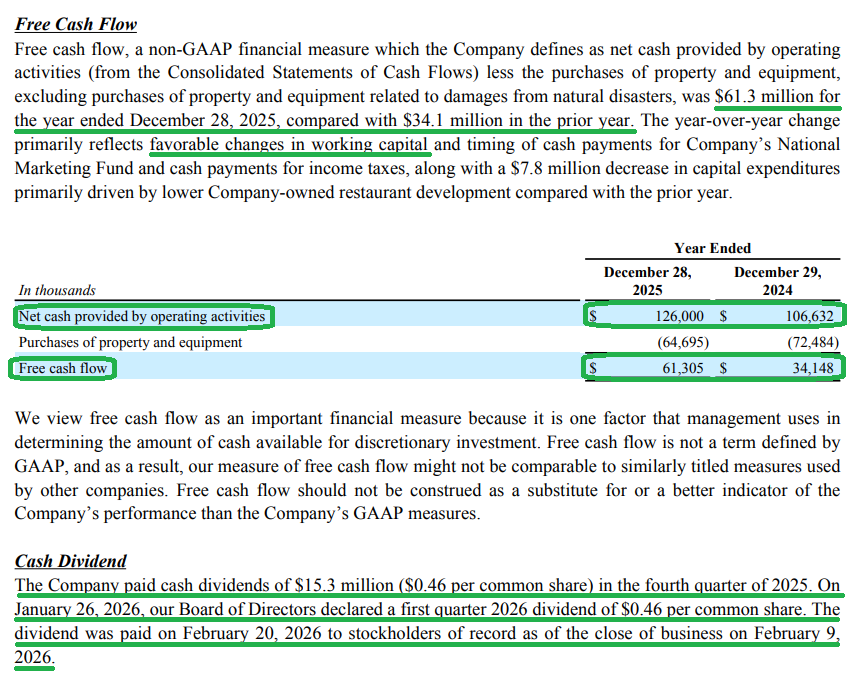
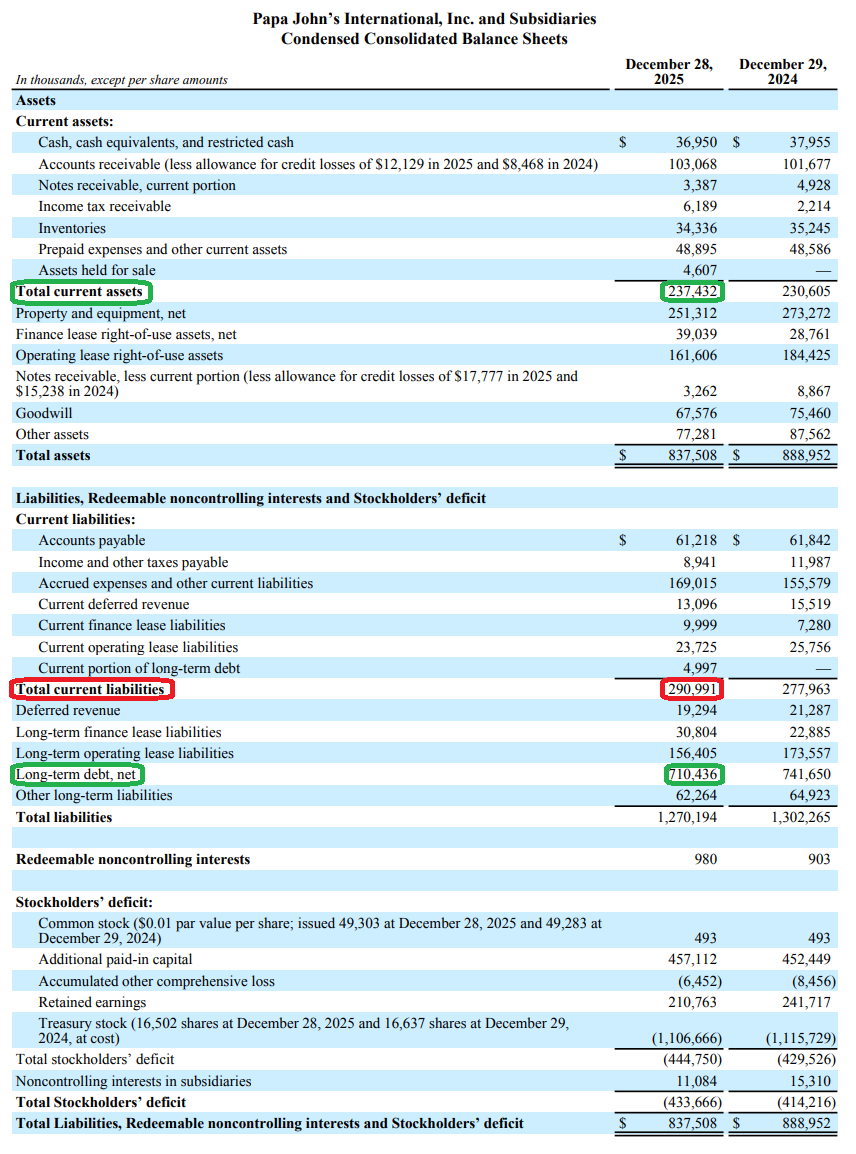
While it’s still early innings and it will take time to fully play out, we get paid handsomely to wait with a 5.7% dividend yield backed by recovering FCF that nearly doubled year over year and a solid balance sheet with no major maturities until 2029. Zoom out, have some patience, and let this turnaround play out. As sentiment around the consumer rebounds and people remember that Americans still love pizza, expect Papa John’s to come back into favor and Irth Capital to switch that $47 around to a $74 in short order.
Q4 Earnings Breakdown
10 Key Points
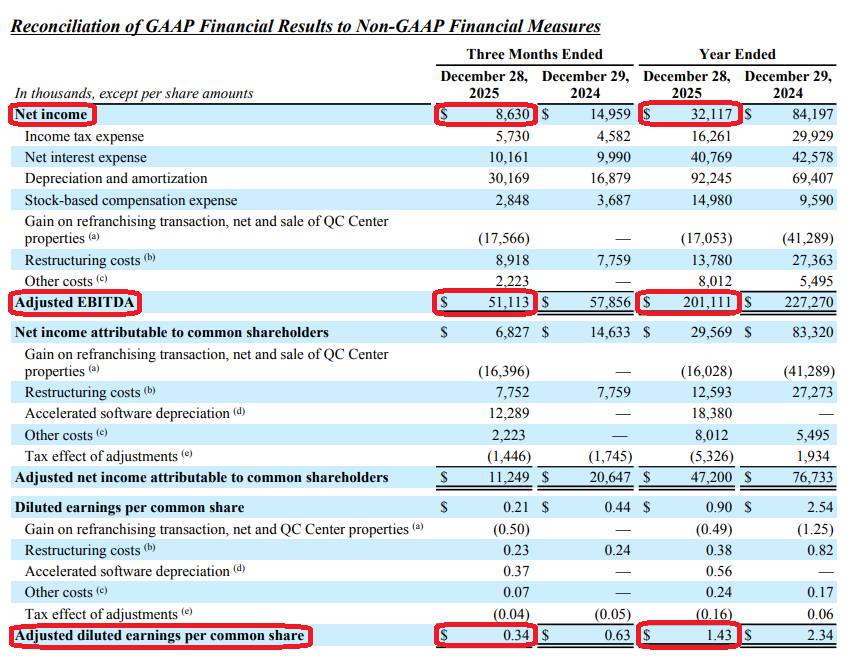
1) Q4 revenue came in at $498.2M (-6.1% Y/Y), missing consensus of $517M, with the decline primarily driven by a ~$24M drop at domestic company-owned restaurants, ~$9M of which is directly attributable to the re-franchising of 85 restaurants. FY25 revenue was $2.1B, flat Y/Y. Q4 adjusted EPS of $0.34 beat consensus of $0.33, with FY25 adjusted EPS of $1.43 vs. $2.34 in the prior year.
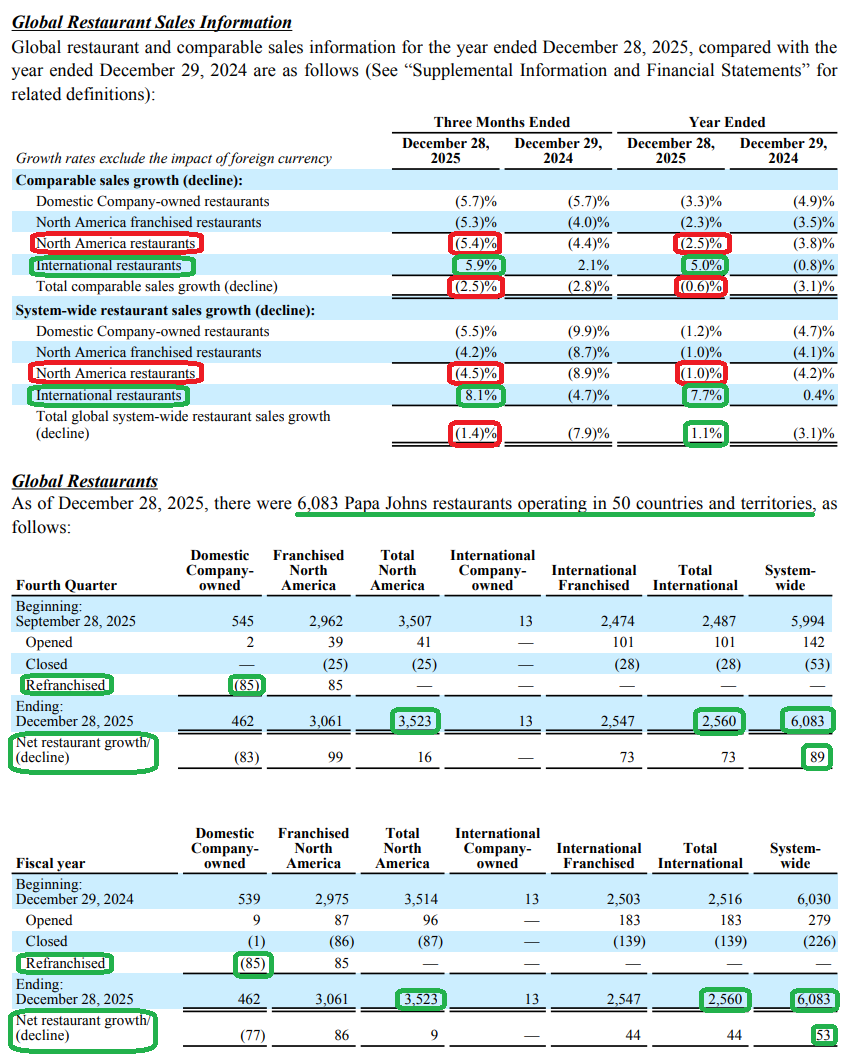
2) North America Q4 comp sales came in at -5.4% Y/Y, below consensus of -4.3%, against a weak consumer backdrop and elevated promotional environment. FY25 NA comps finished at -2.5%. Q4 NA systemwide sales decreased 4.5% to $886M, with FY25 systemwide sales -1.0% to $3.6B.
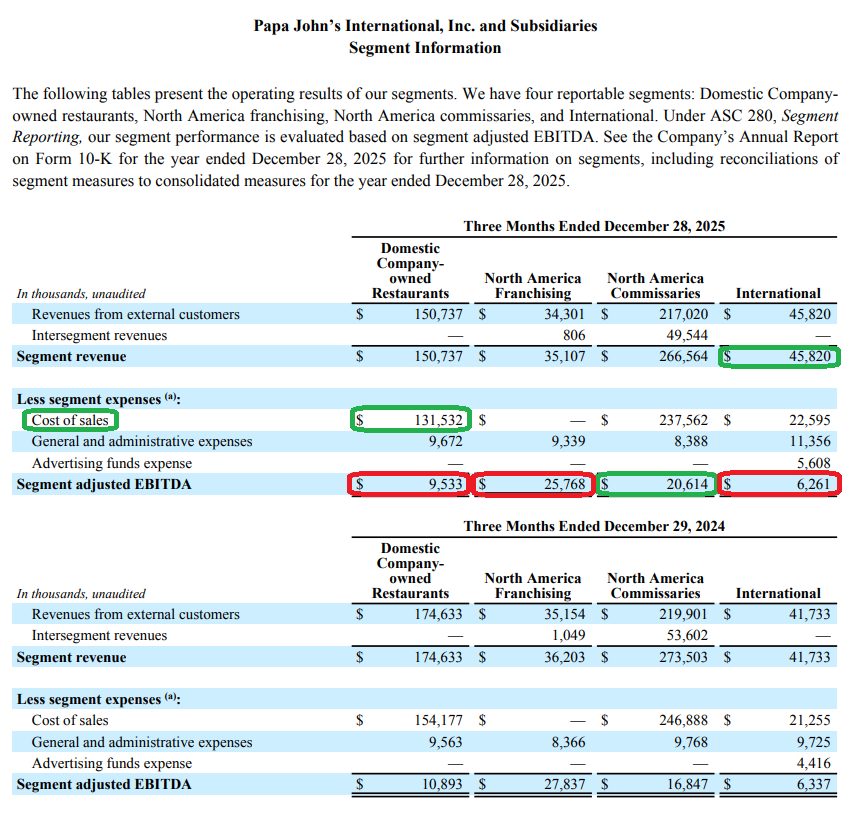
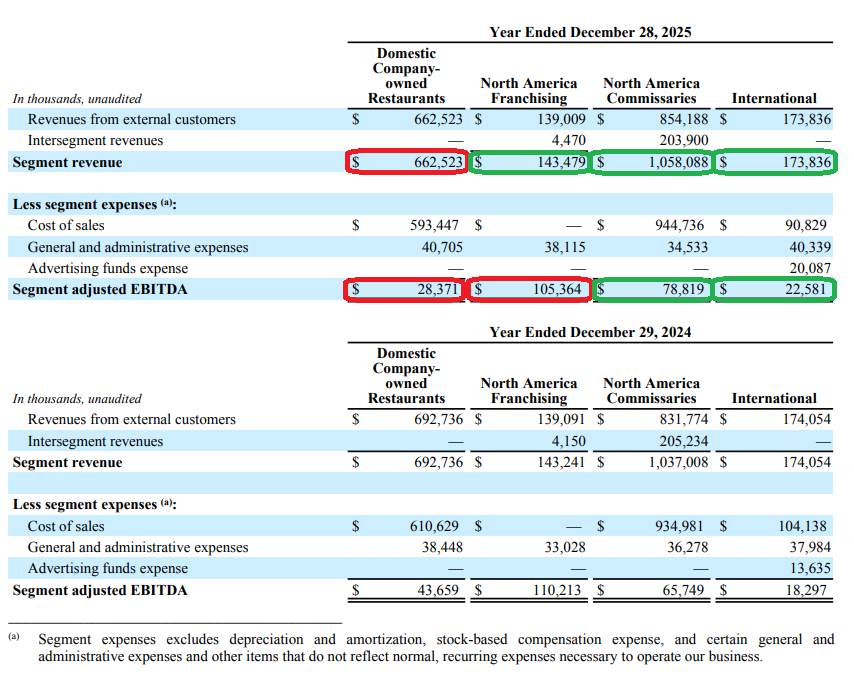
3) International remains the clear bright spot, with Q4 comps +5.9% Y/Y, marking five consecutive quarters of positive comp sales with strength broad-based across markets. FY25 international comps finished at +5.0%. Q4 international systemwide sales increased 8.1% to $341M, with FY25 systemwide sales +7.7% to $1.3B.
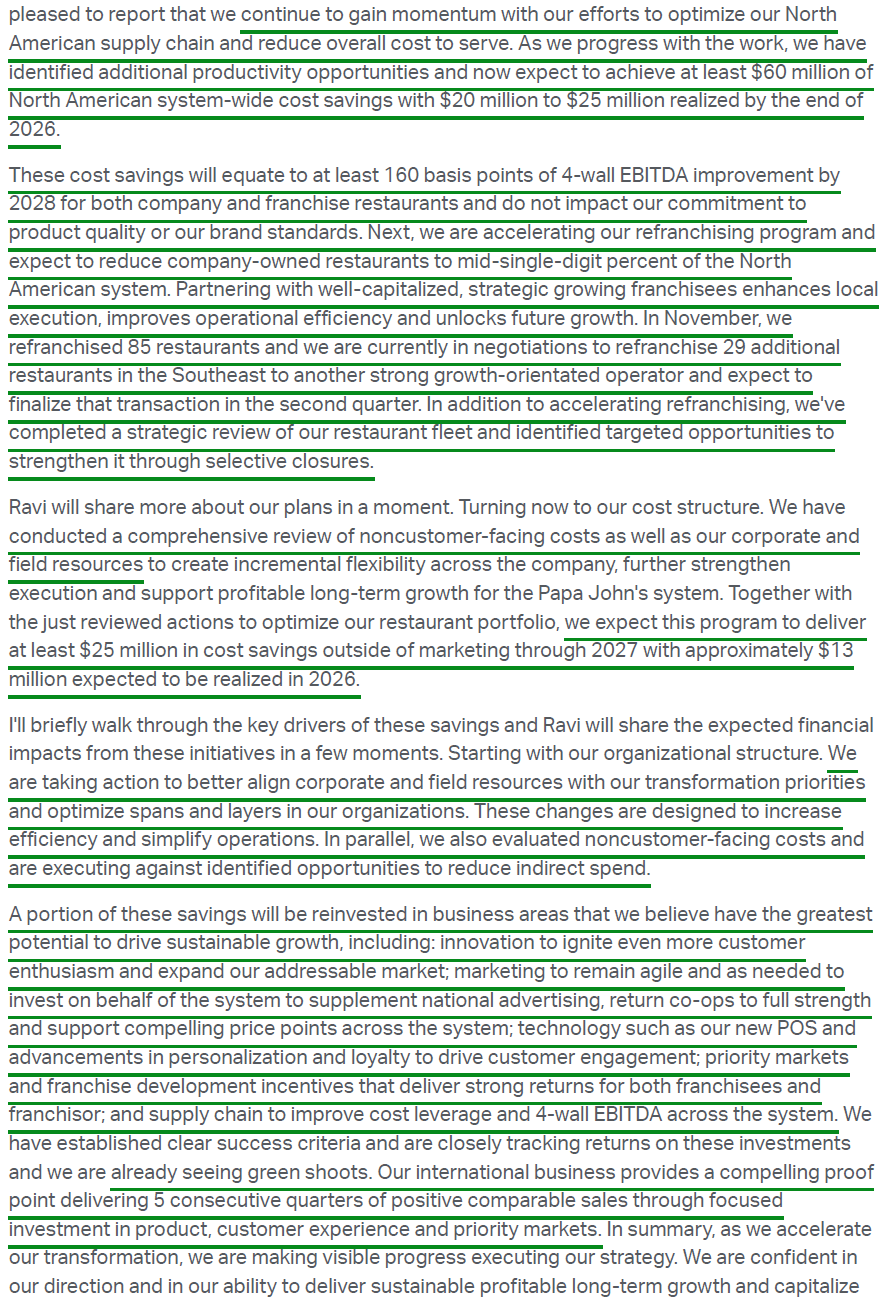
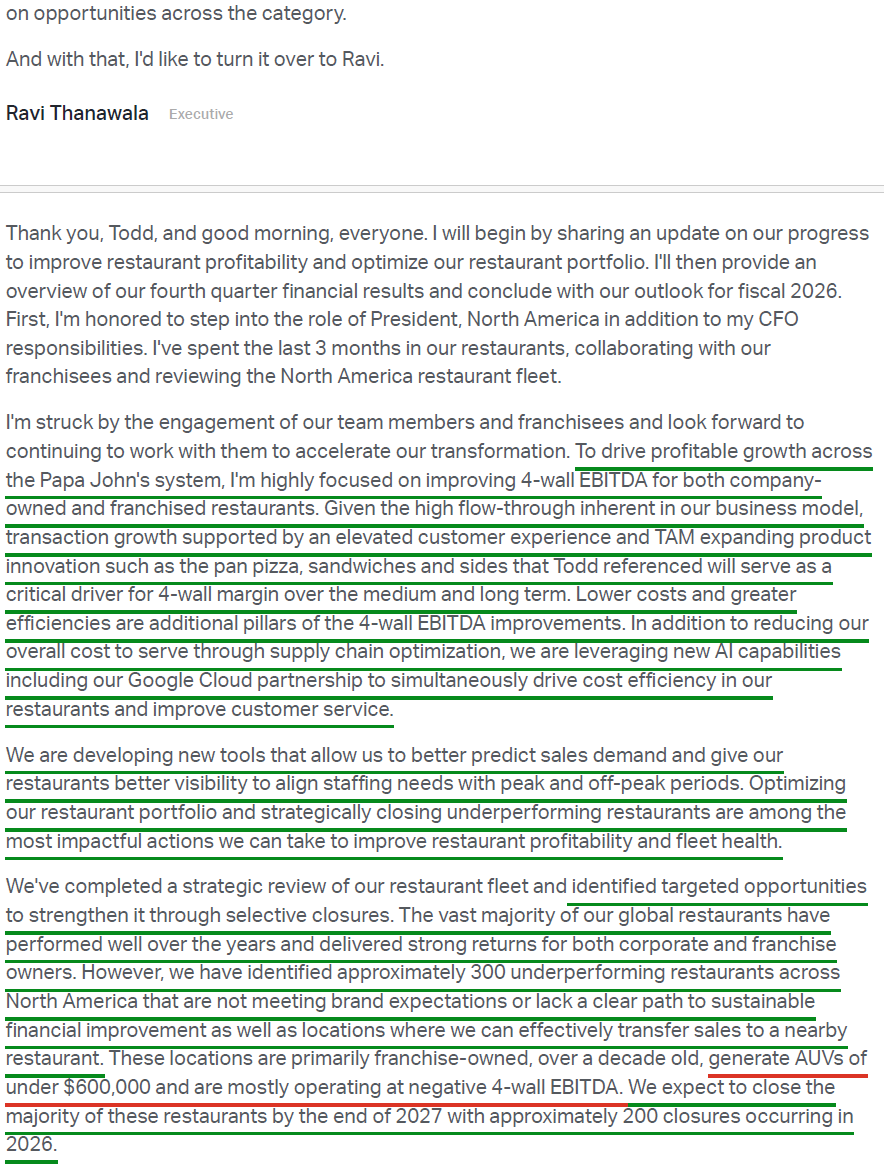
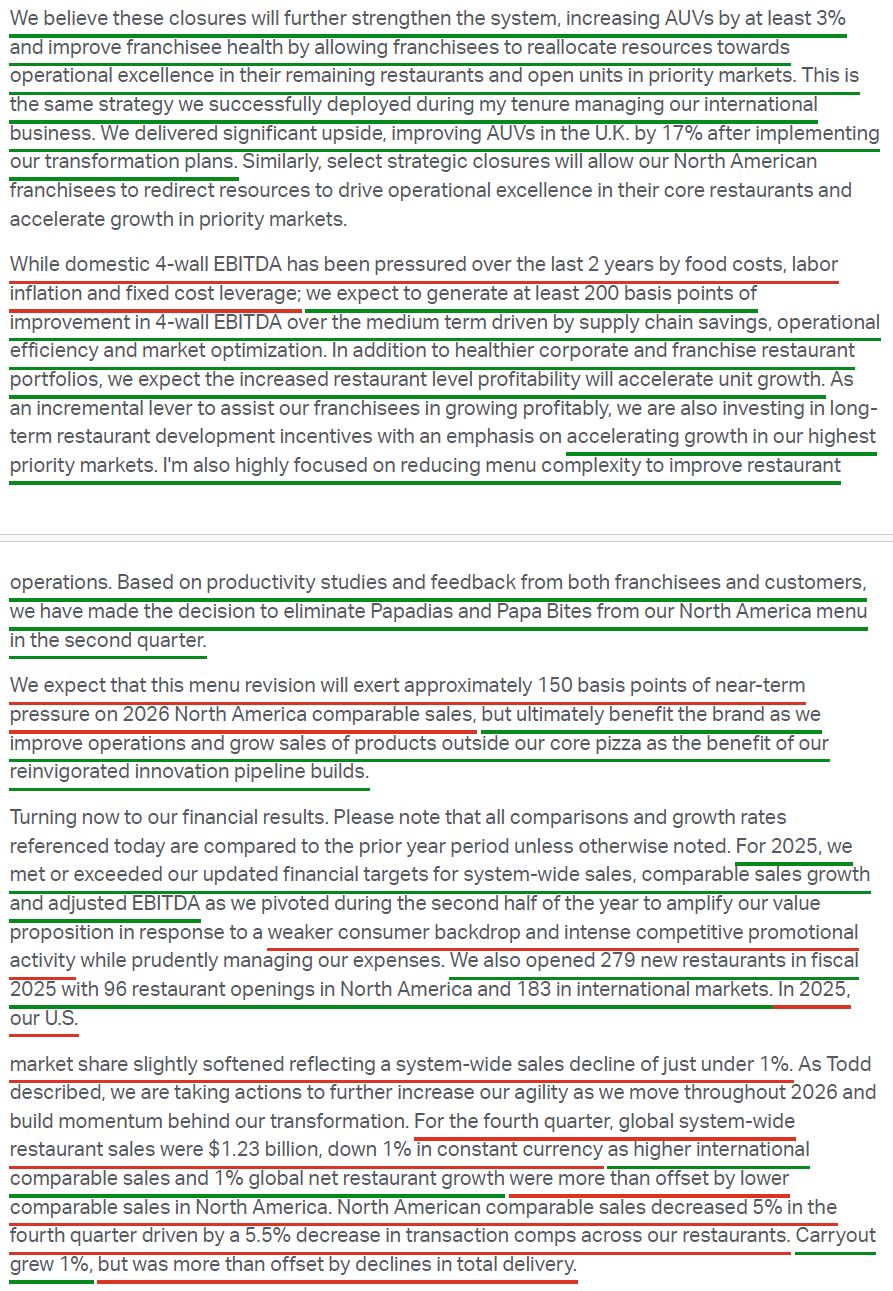
4) Management continues to execute on right-sizing the cost structure, expanding the supply chain savings target from $50M to $60M by FY28 and identifying at least $25M in noncustomer-facing corporate cost savings through 2027, with ~$13M expected to be realized in 2026 and corporate headcount already reduced by ~7%. Management also announced the identification of ~300 underperforming NA locations for closure by end of 2027, with ~200 closures expected in 2026. These restaurants generate AUVs below $600K vs. the top 50% fleet average of ~$1.4M and are mostly operating at negative 4-wall EBITDA, with closures expected to drive at least a ~3% increase in average AUVs systemwide. This is the same playbook used to turn around the UK market, where post-closure AUVs improved ~17% and the market just posted ~7% comp growth in Q4.
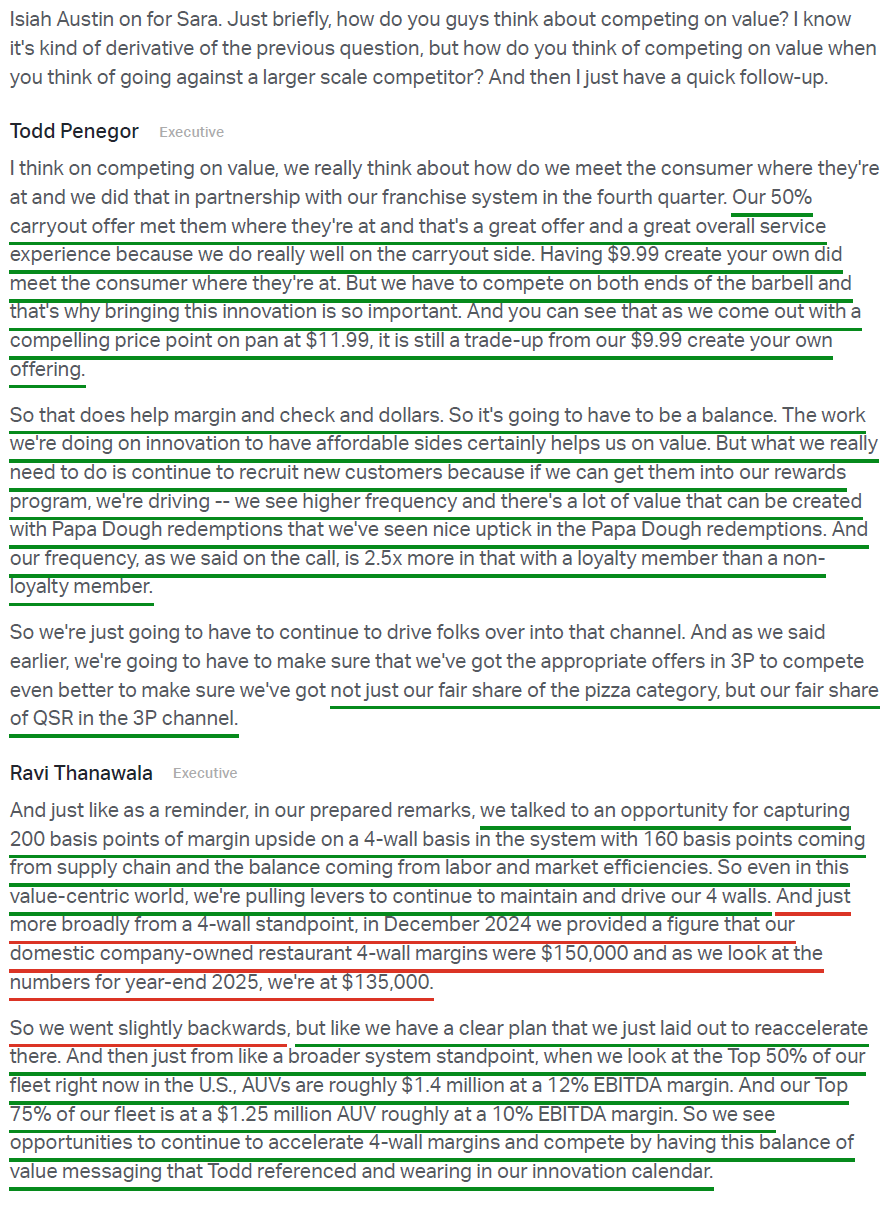
5) Q4 adjusted EBITDA came in at $51.1M (-11.7% Y/Y), with FY25 adjusted EBITDA of $201.1M (-11.5% Y/Y). The decline was driven primarily by ~$21M in stepped-up marketing spend as management re-established co-ops across 50 markets representing the majority of NA systemwide sales, restoring the local marketing strategy that built the brand and was eliminated by prior management. Domestic company-owned restaurant 4-wall EBITDA margin came in at 12.7% in Q4, an improvement of 60 bps driven by lower cost of sales. Management sees a clear path to ~200 bps of 4-wall margin improvement over the medium term, with ~160 bps from supply chain savings and the balance from labor and market efficiencies.
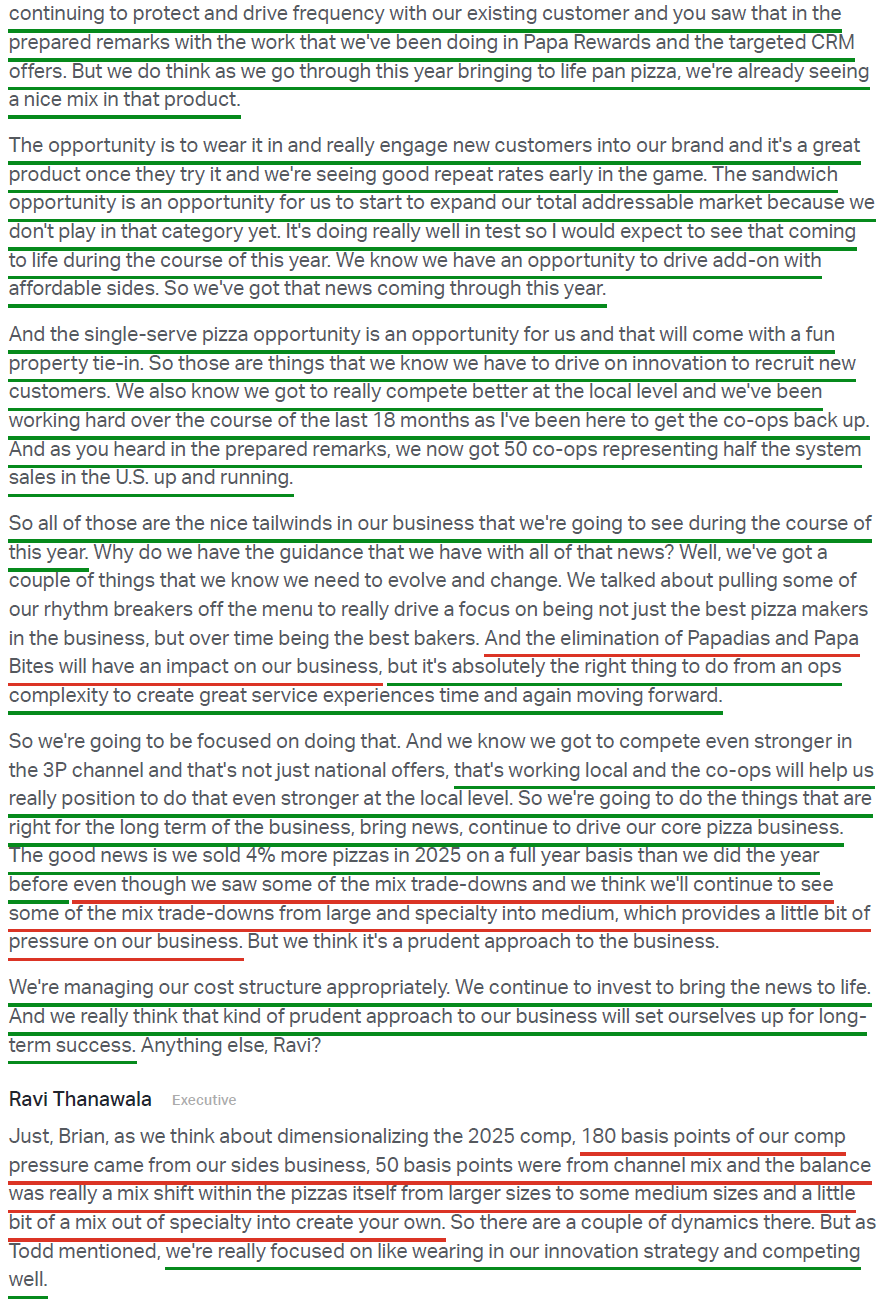
6) Management is eliminating menu complexity by ending Papadias and Papa Bites by Q2, a ~150 bps near-term comp headwind but the right long-term decision as focus returns to core pizza. Encouragingly, PZZA sold 4% more pizzas in FY25 than the prior year even amid mix trade-downs. On the innovation front, the new Pan Pizza platform launched in late January and is already outperforming expectations nationwide, with plans to expand into several priority international markets in the coming months. PZZA is also piloting a new protein pizza crust with 55+ grams of protein per serving, a first in the industry, and is rolling out new oven toasted sandwiches across North America, both already receiving highly positive customer feedback.
7) Progress on the digital front continues, with Papa Rewards loyalty members now totaling ~41M, Papa Dough redemptions more than doubling from 24% to 48% of loyalty orders, and loyalty members placing 2.5x more orders than non-rewards members during the year. The new app experience is delivering strong early results, with response times ~40% faster and conversion improved 70 bps vs. legacy platforms. Management also continues to expand its partnership with Google Cloud, developing AI-powered tools aimed at simplifying the ordering experience and reducing cart abandonment.
8) PZZA is accelerating the re-franchising program, with 85 domestic company-owned restaurants re-franchised during the year and negotiations currently underway to re-franchise an additional 29 restaurants in the Southeast, expected to close in Q2. Management remains committed to reducing company-owned restaurants to a mid-single-digit percentage of the NA system, with additional re-franchising transactions planned for 2026, though not yet factored into guidance.
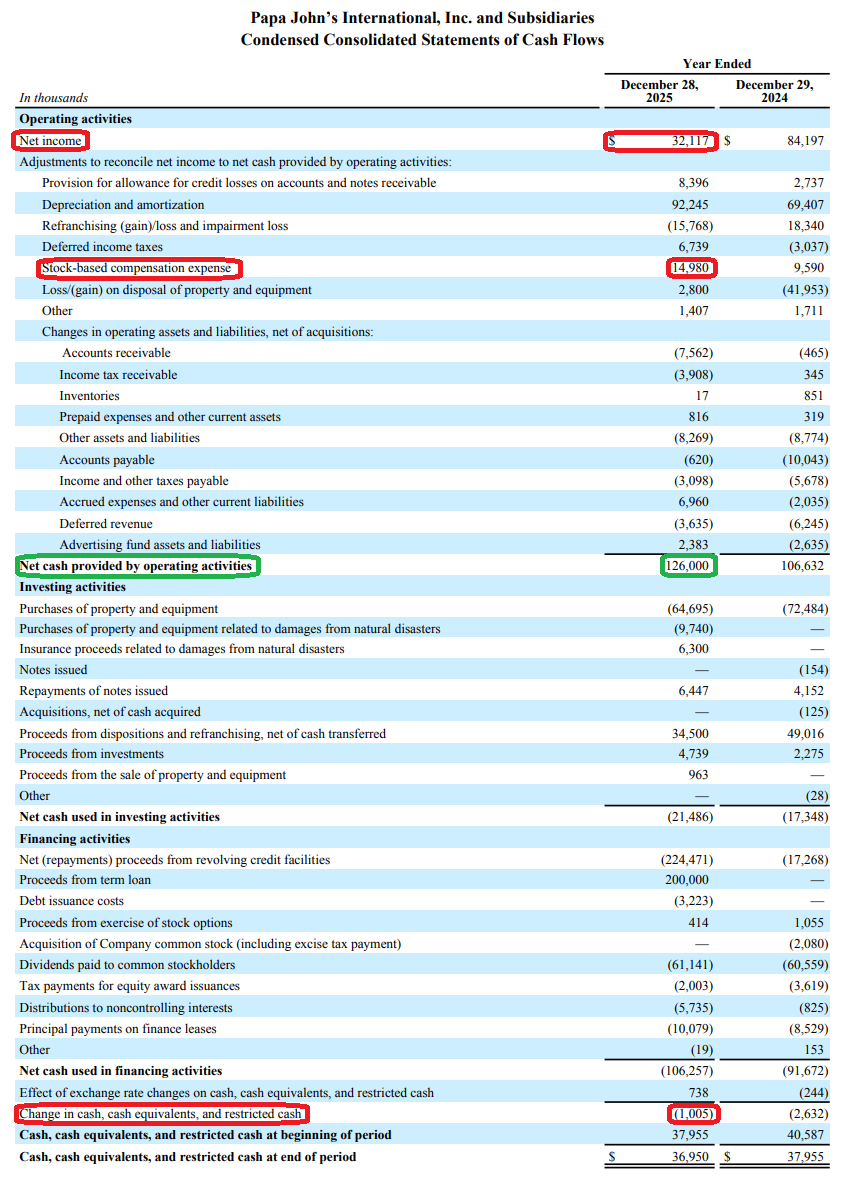
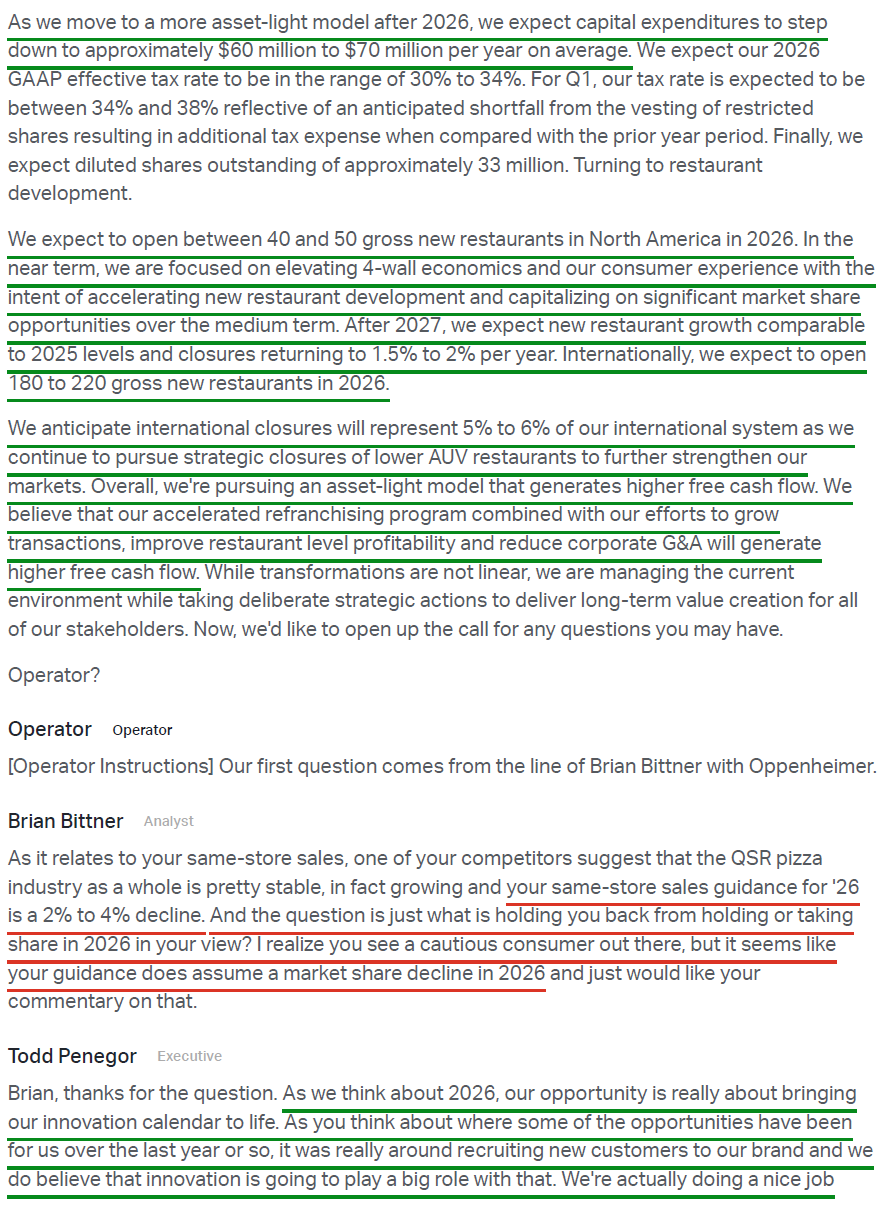
9) FY25 free cash flow came in at $61.3M, nearly double the $34.1M in FY24, driven by working capital improvements and timing of National Marketing Fund cash payments. Management expects continued improvement in free cash flow as the business pivots toward a more asset-light model after 2026, with capex expected to step down to $60M to $70M per year on average vs. $70M to $80M expected in FY26.
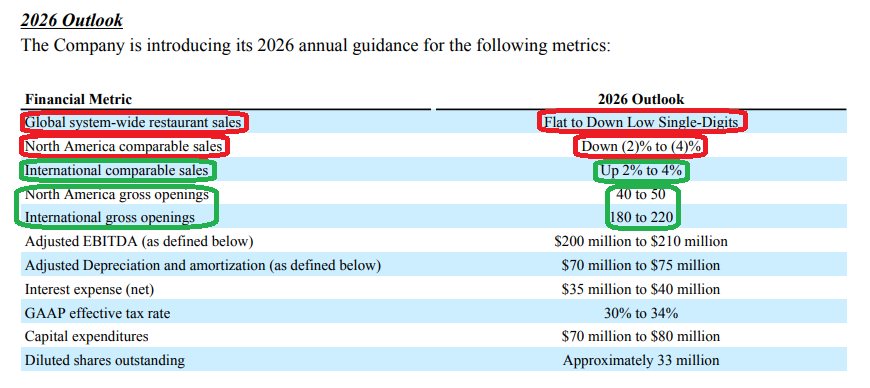
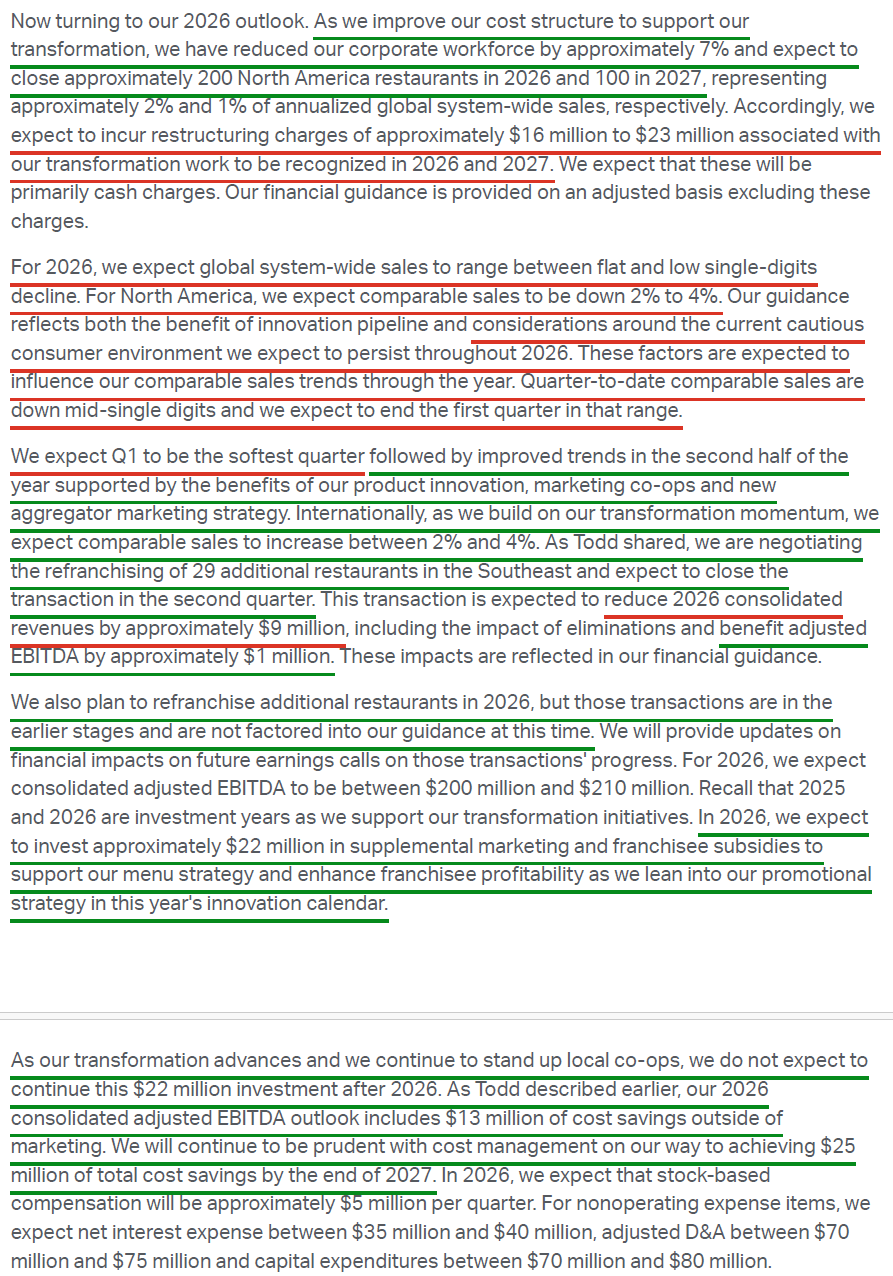
10) FY26 guidance calls for global systemwide sales flat to a low single-digit decline, with NA comps of -2% to -4% and international comps of +2% to +4%. Management expects Q1 to be the softest quarter of the year for NA, with quarter-to-date comps down mid-single digits, followed by improving trends in the back half supported by product innovation and marketing co-ops. Adjusted EBITDA is expected to land at $200M to $210M for the full year, which includes ~$22M in supplemental marketing and franchisee subsidies not expected to continue beyond FY26, making the underlying run-rate EBITDA power of the business meaningfully higher than the headline figure suggests. 40 to 50 gross new NA openings and 180 to 220 international openings are expected for the year.
Earnings Call Highlights
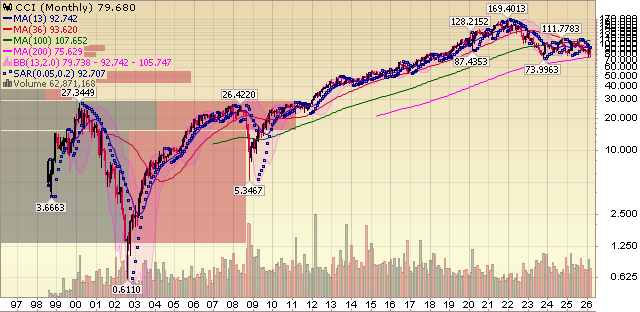
Crown Castle Update
For newer readers, here’s a quick overview of the key drivers behind our thesis on Crown Castle, the only pure-play U.S. tower REIT and a high-yield income name that becomes increasingly hard to ignore as rates come down and capital rotates back into yield:
Q4 Earnings Breakdown
10 Key Points
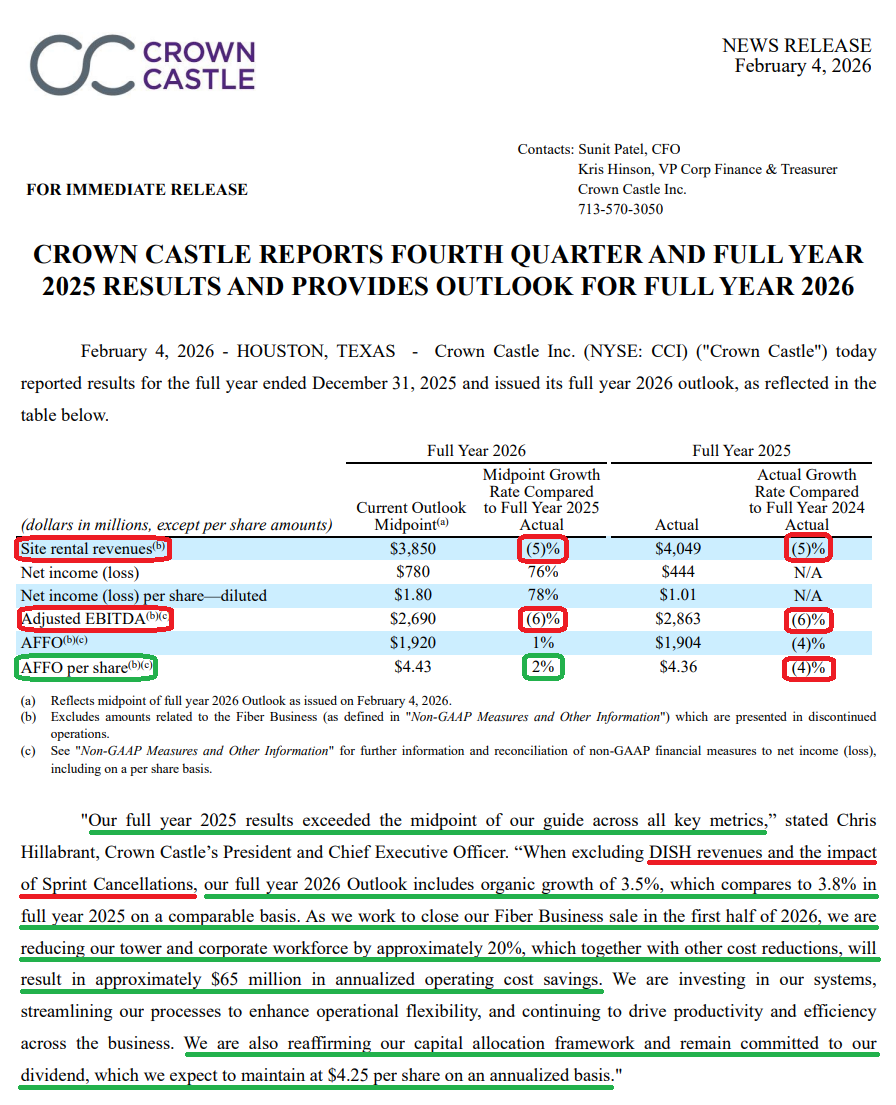
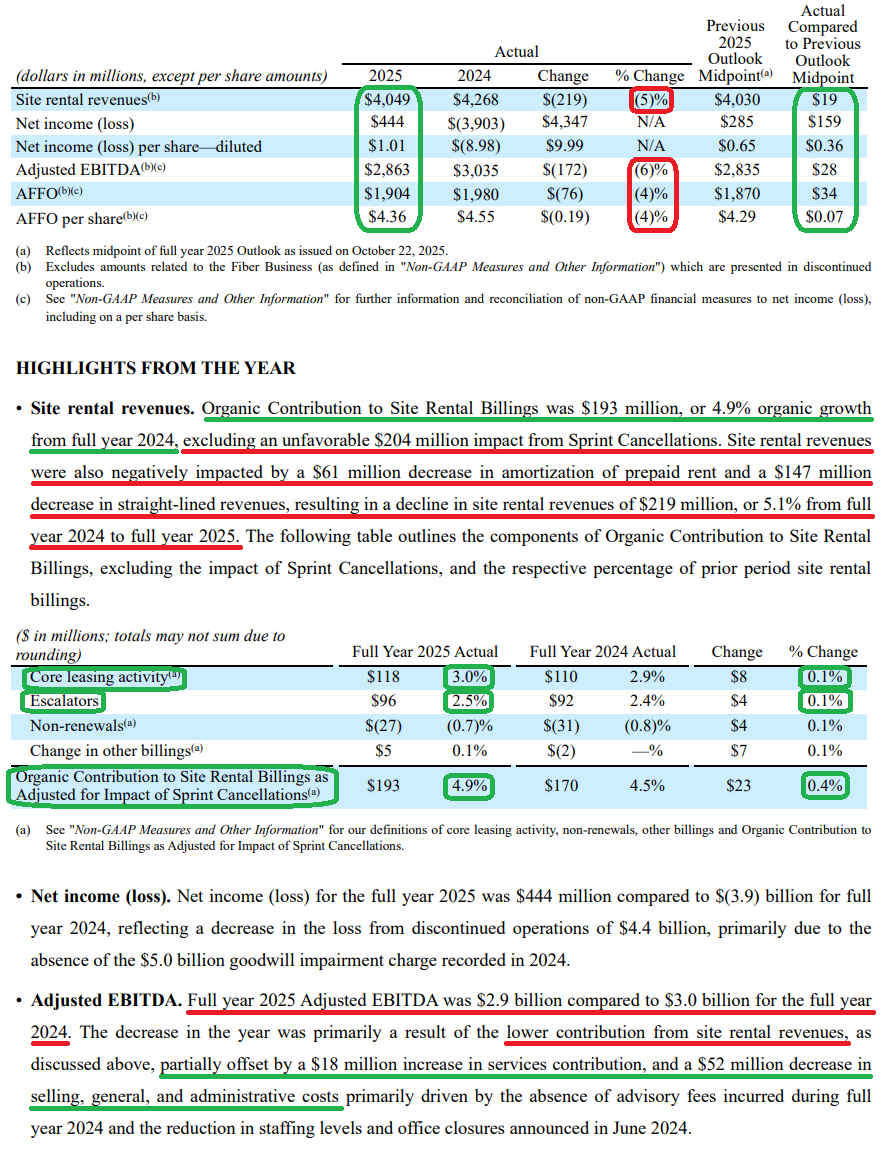
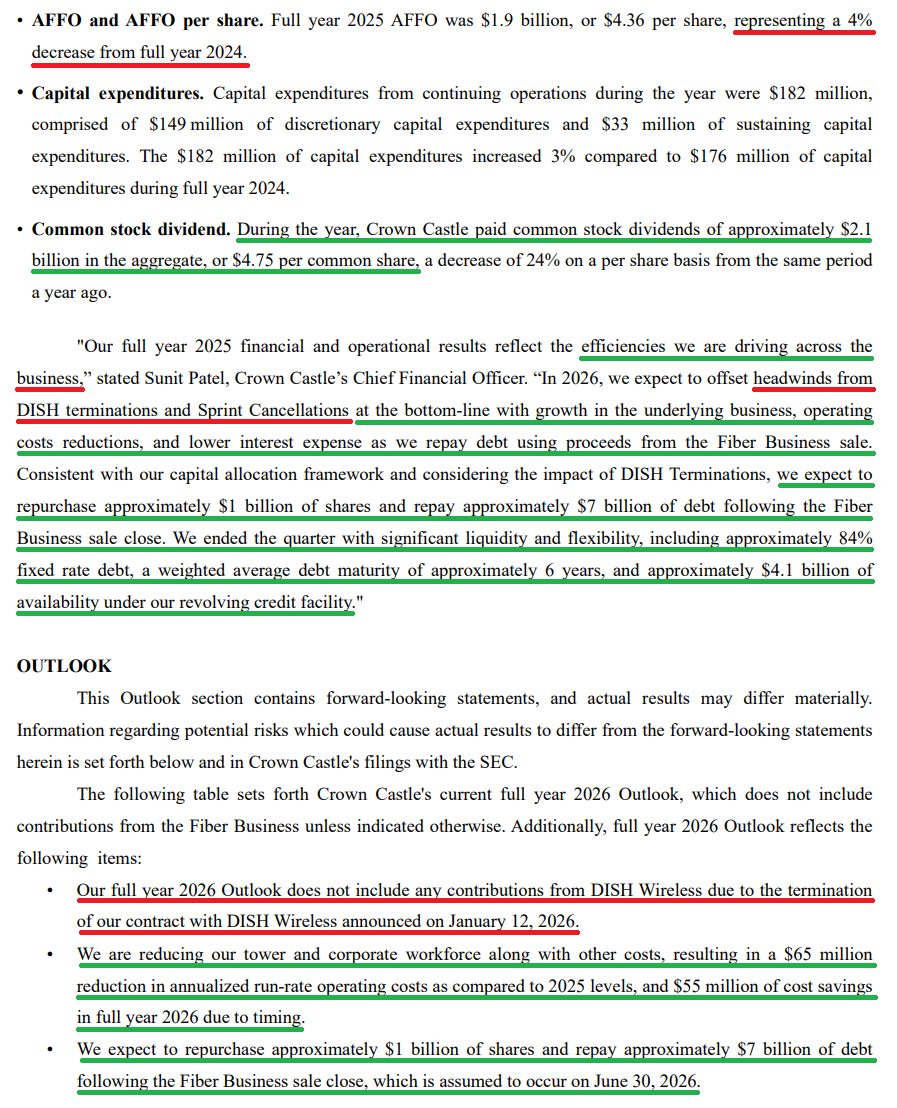
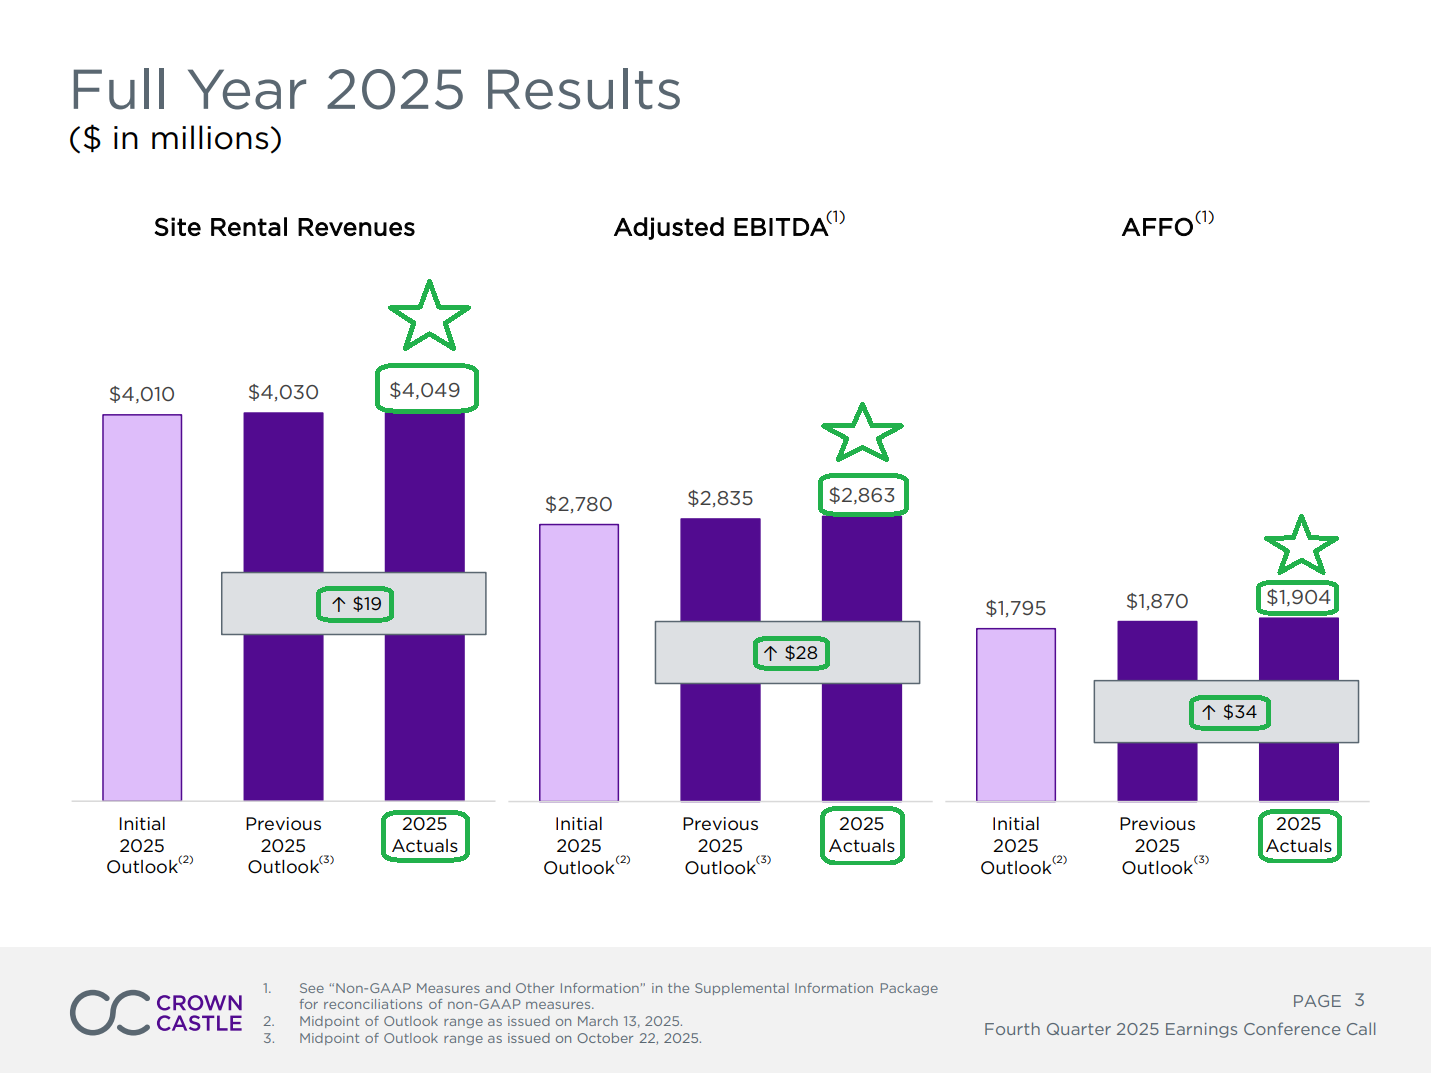
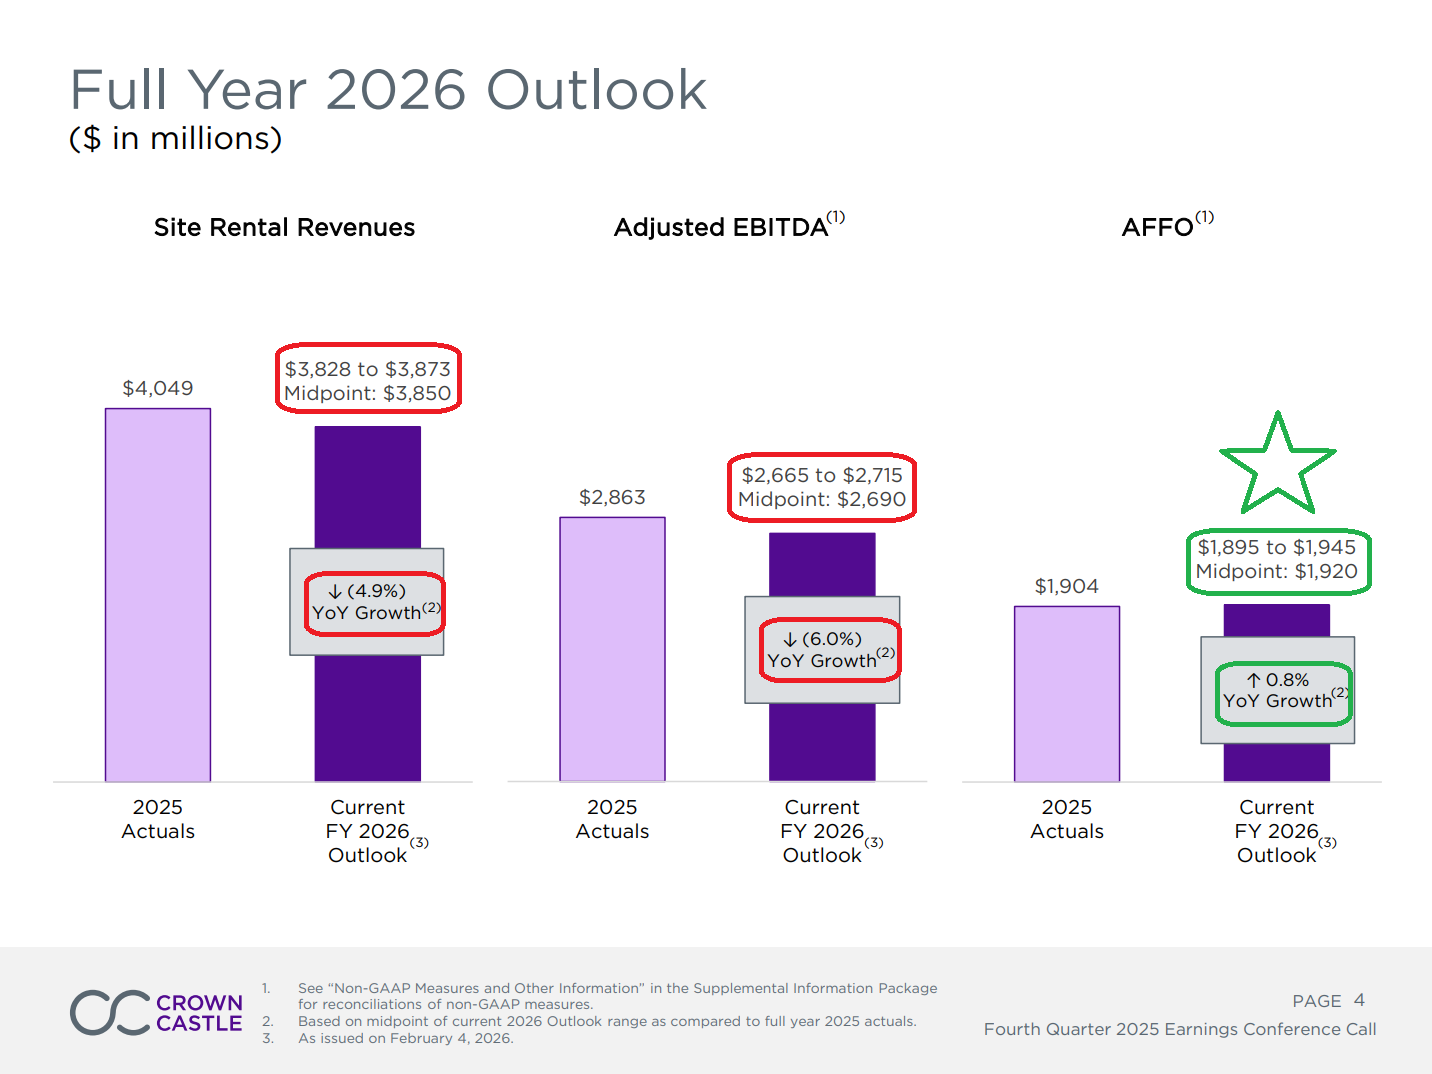
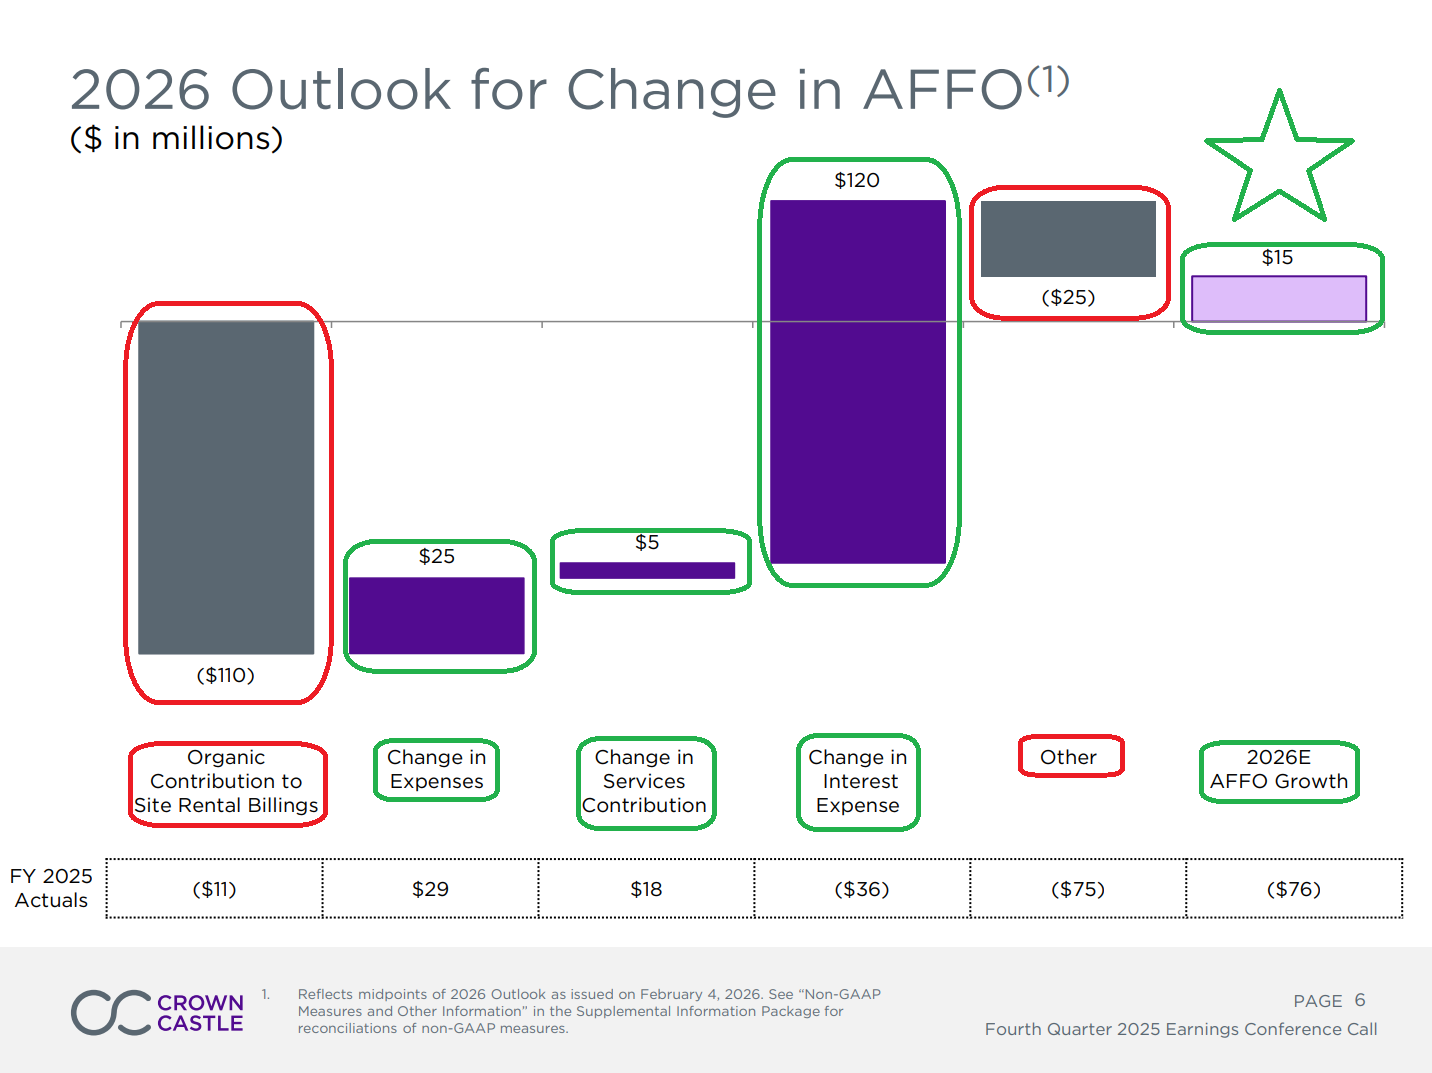
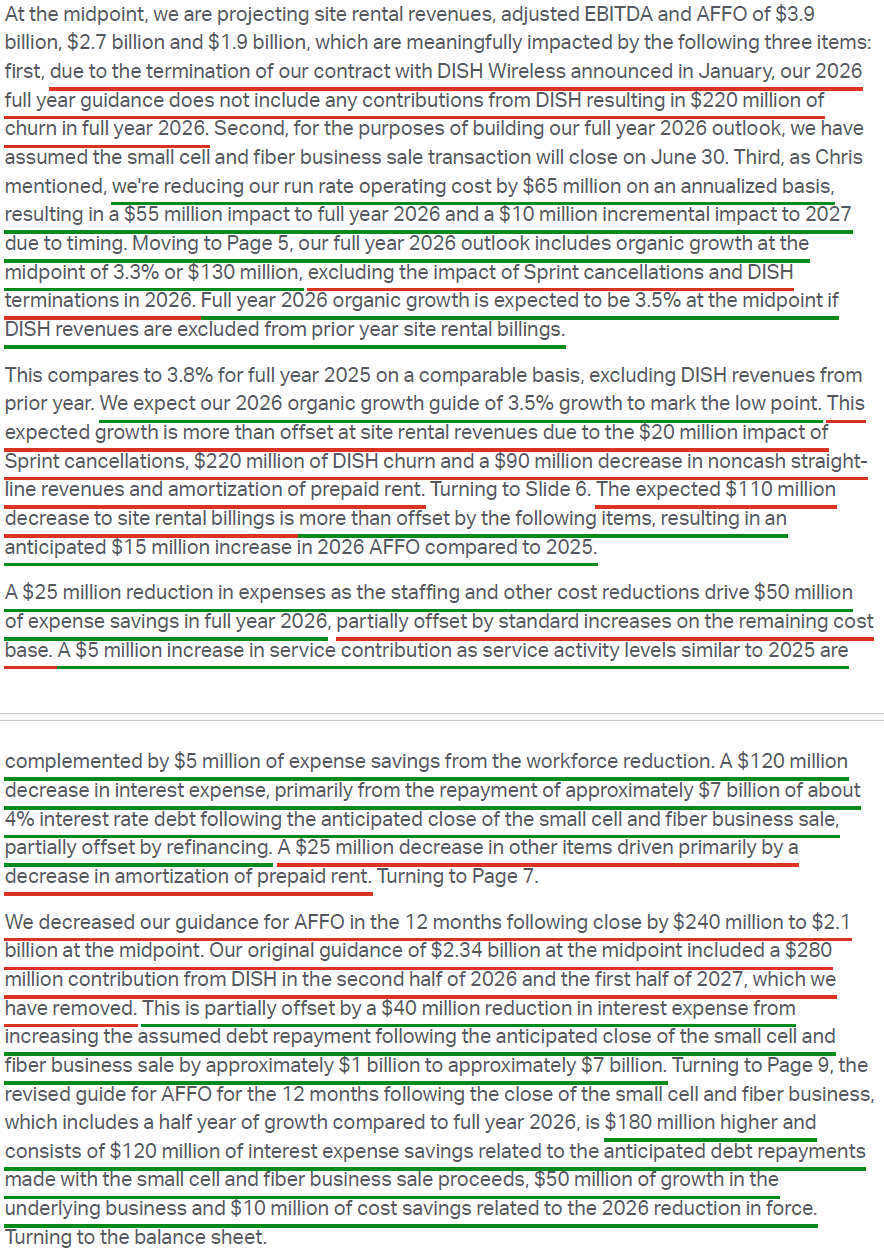
1) Q4 site rental revenue came in at $1.02B, with full-year site rental revenue of $4.05B exceeding the midpoint of prior guidance by $19M. Q4 adjusted EBITDA came in at $781M, with the full-year figure of $2.86B exceeding the midpoint by $28M. Q4 AFFO came in at $489M or $1.12 per share, with full-year AFFO of $1.90B or $4.36 per share exceeding the midpoint by $34M. Outperformance across all three metrics was driven by higher-than-expected services contribution, ongoing efficiency initiatives, and lower interest expense, with CCI finishing near or above the high end of guidance across all key metrics.
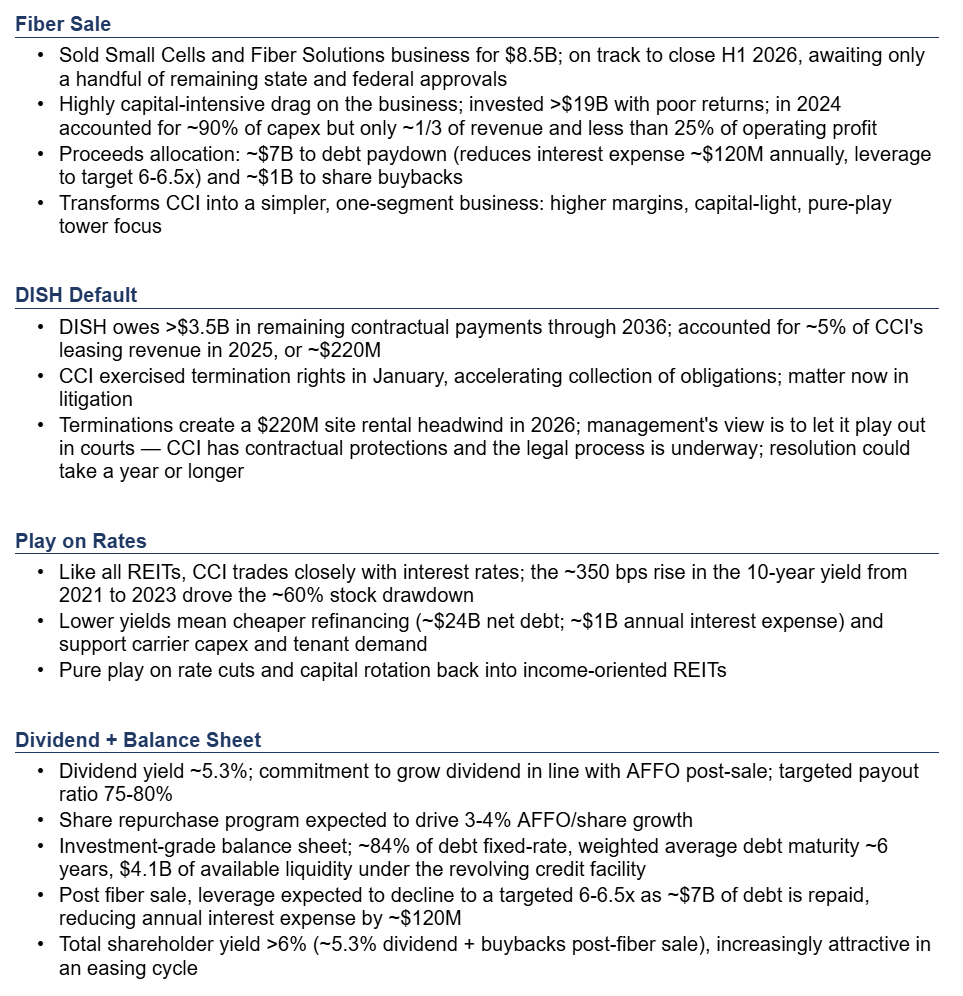
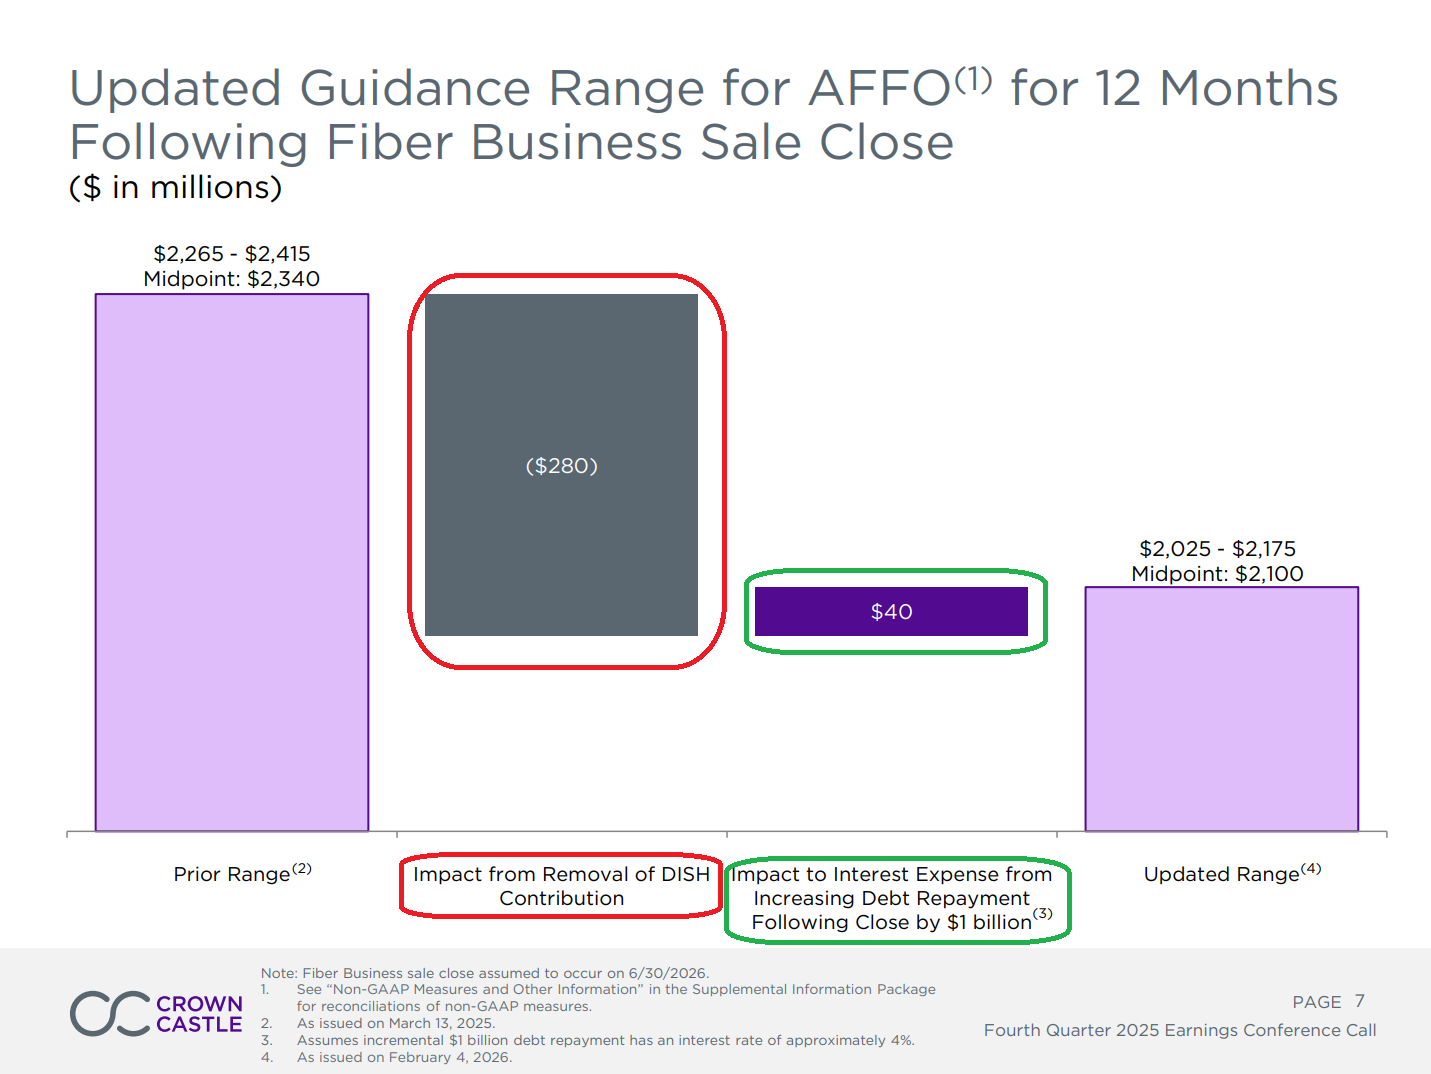
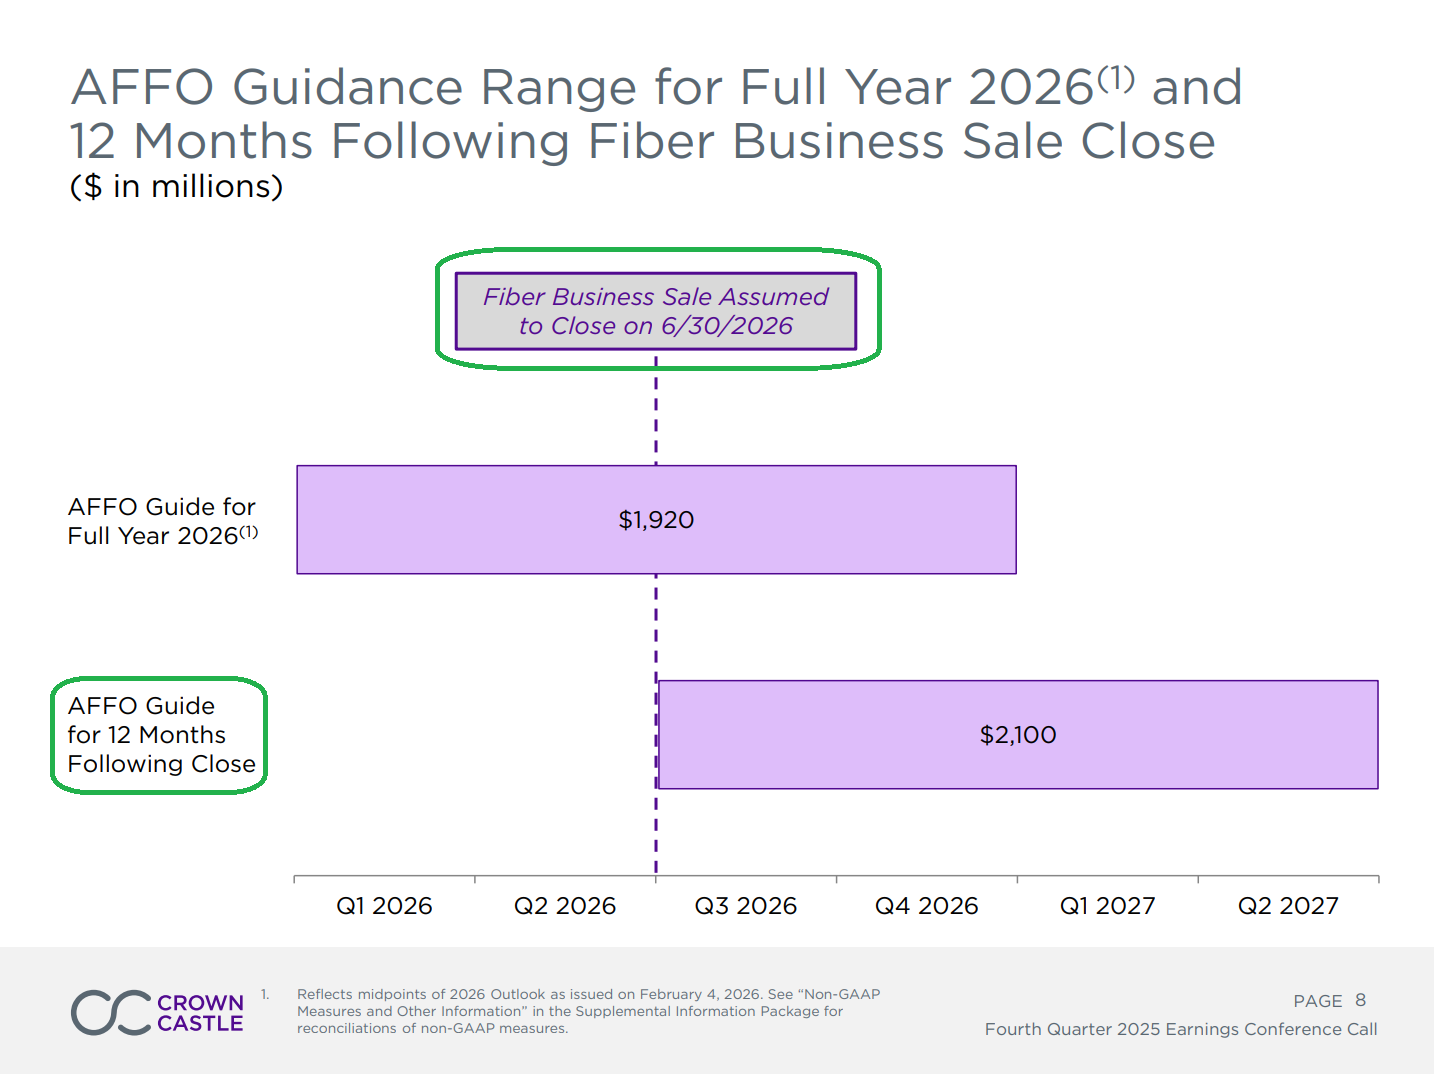
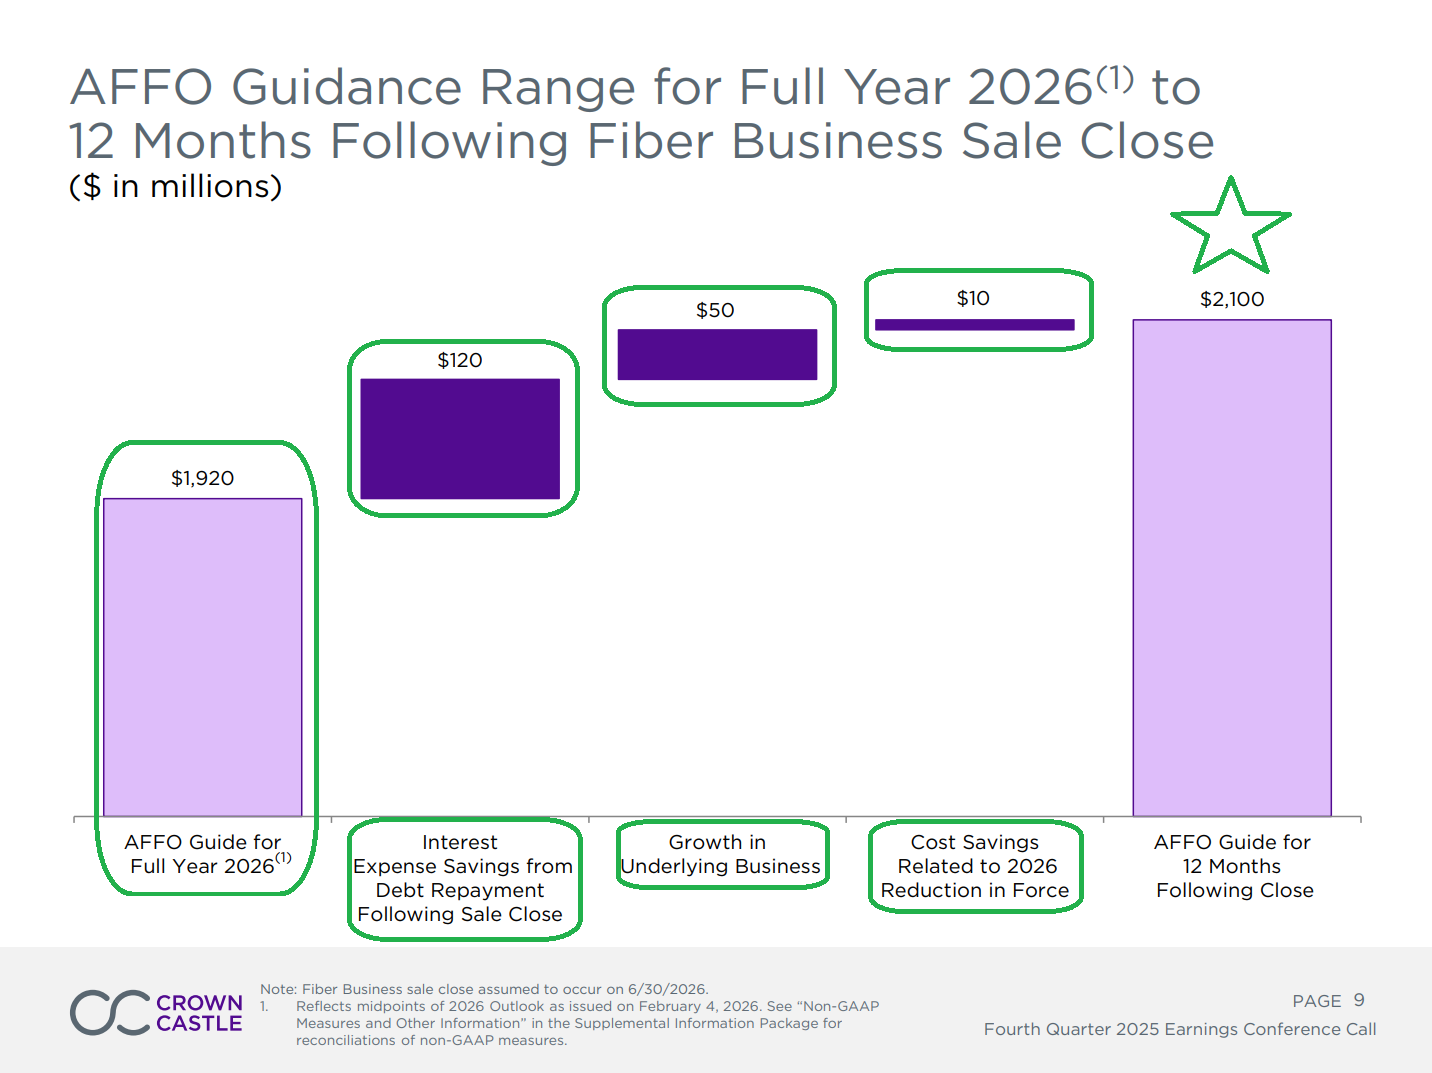
2) The $8.5B sale of the small cell and fiber solutions business remains on track to close in 1H 2026, with the DOJ having closed its Hart-Scott-Rodino review without requiring any action, leaving only a handful of state and federal approvals remaining. Proceeds will be used to repay ~$7B of debt and fund ~$1B in share repurchases, with the debt paydown expected to reduce annual interest expense by ~$120M. Upon close, CCI will become the only publicly traded pure-play tower company focused exclusively on the US market, with ~60% of the consolidated workforce moving with the sale.
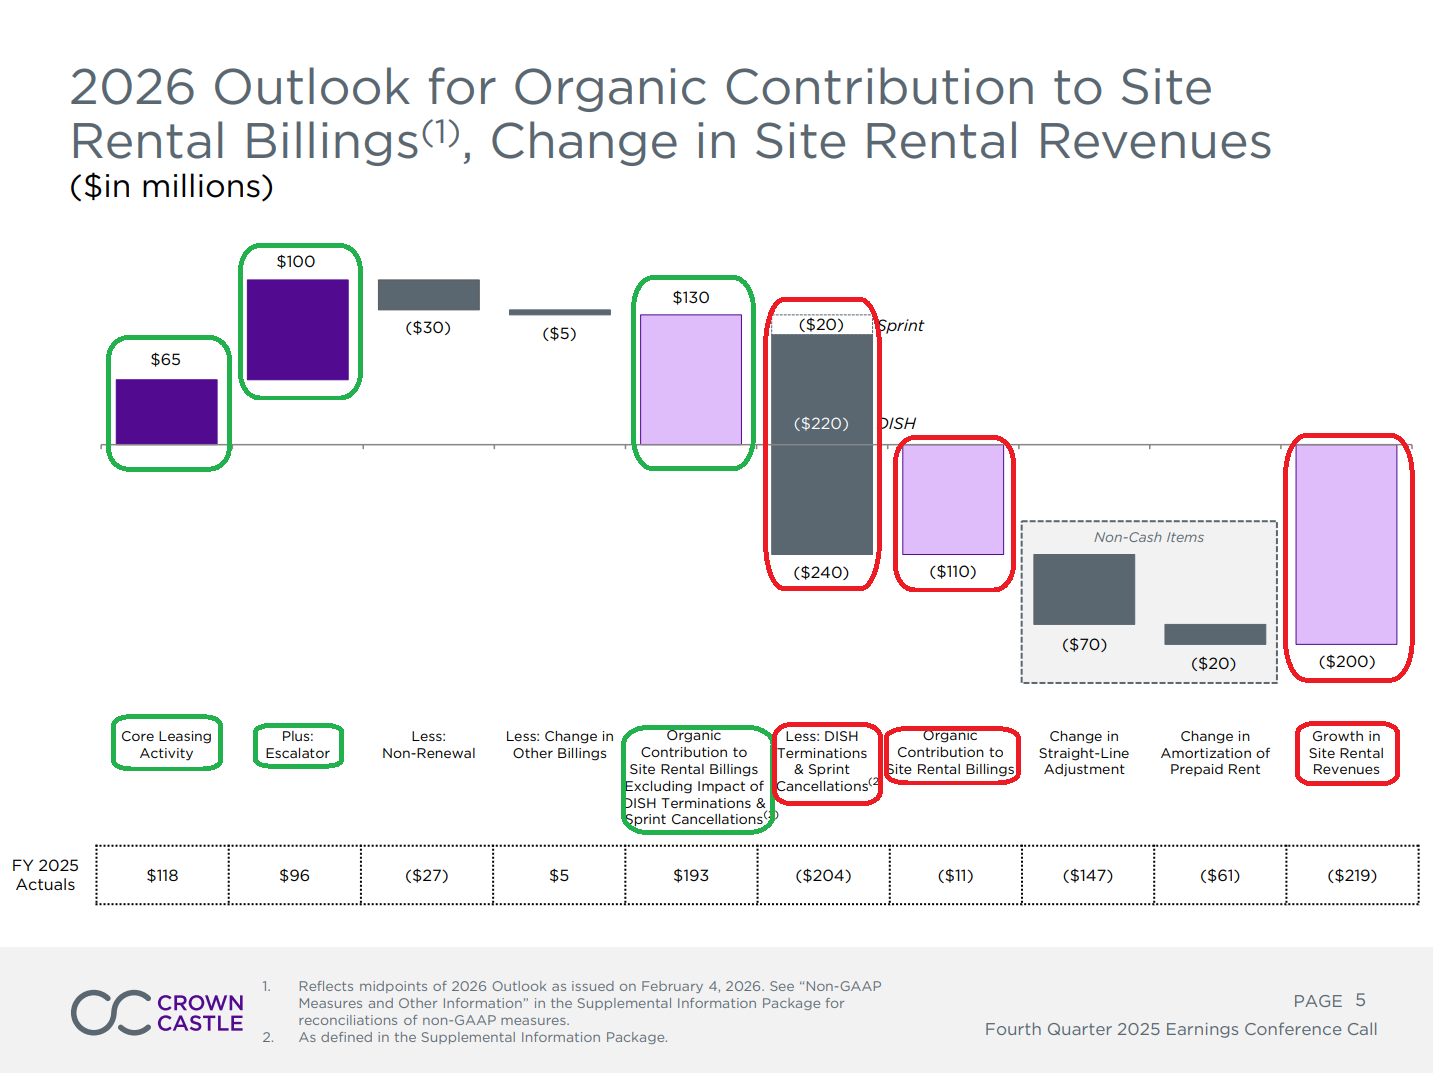
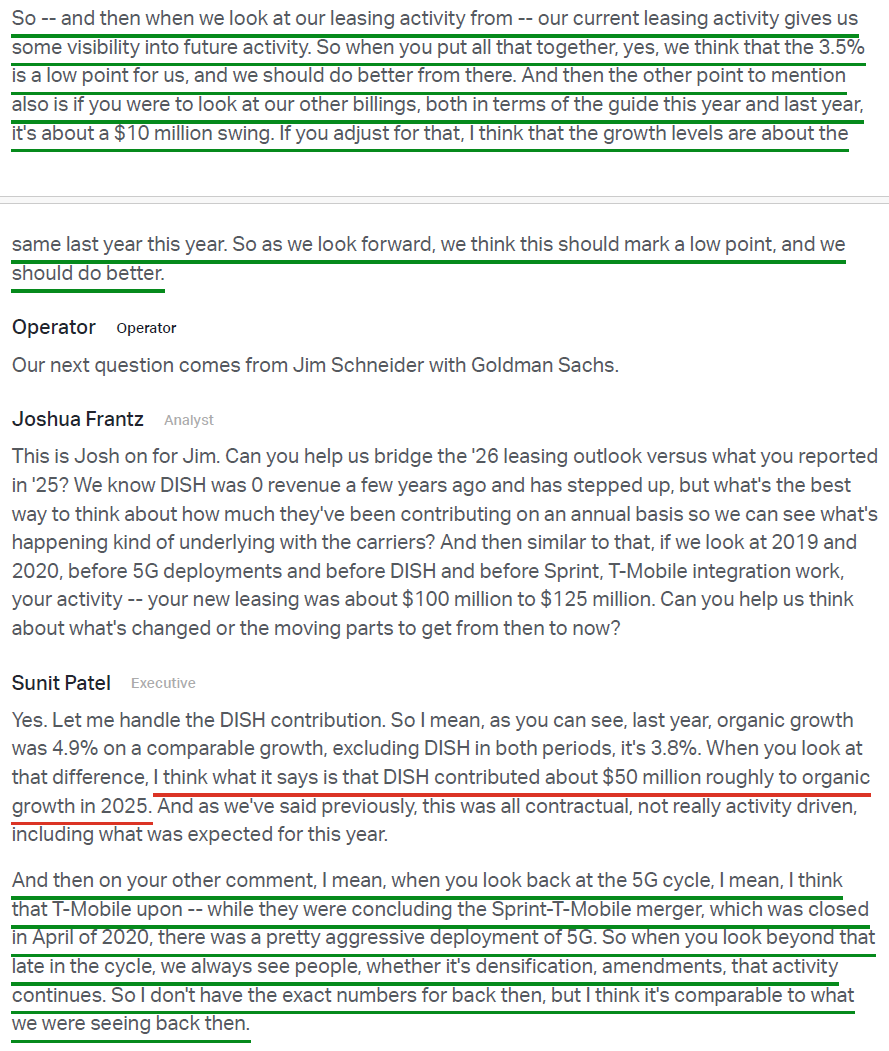
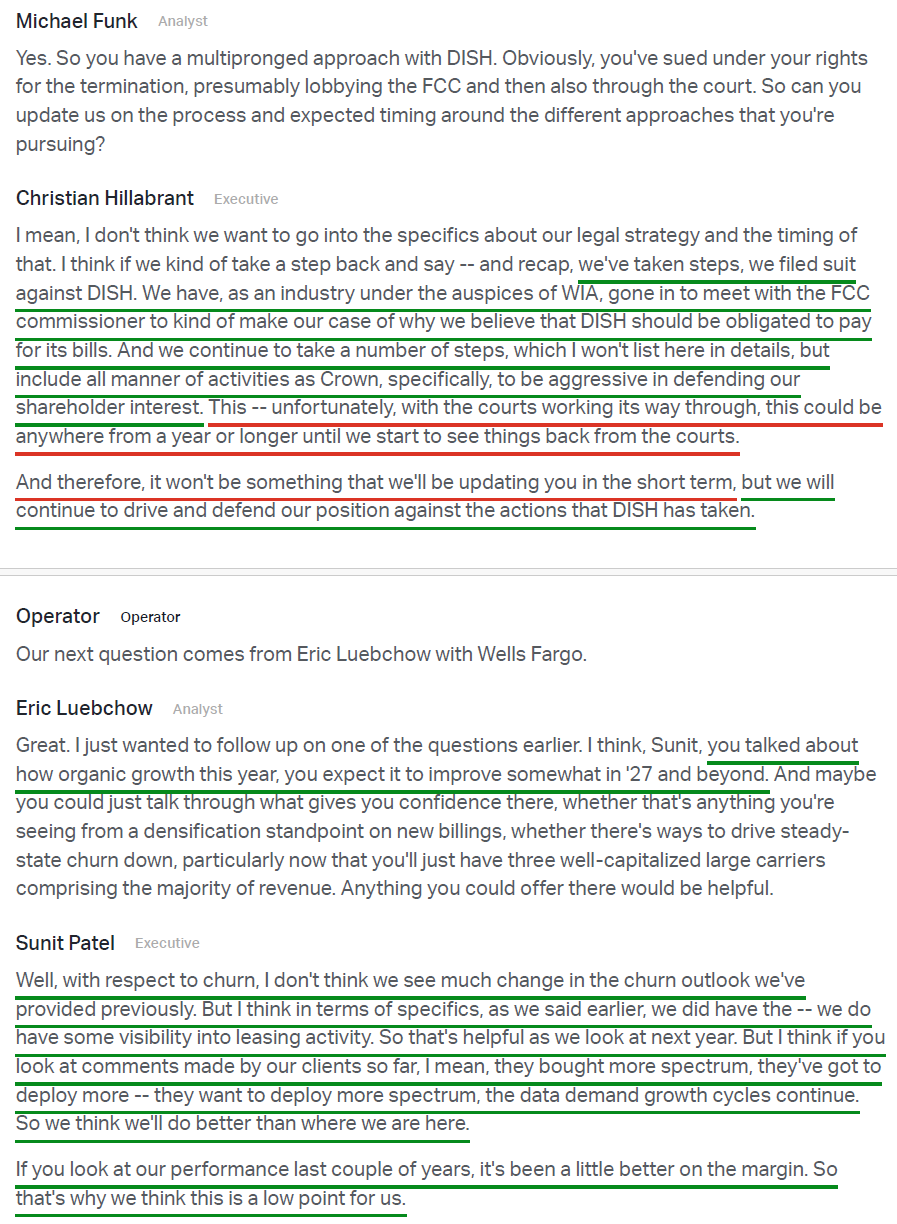
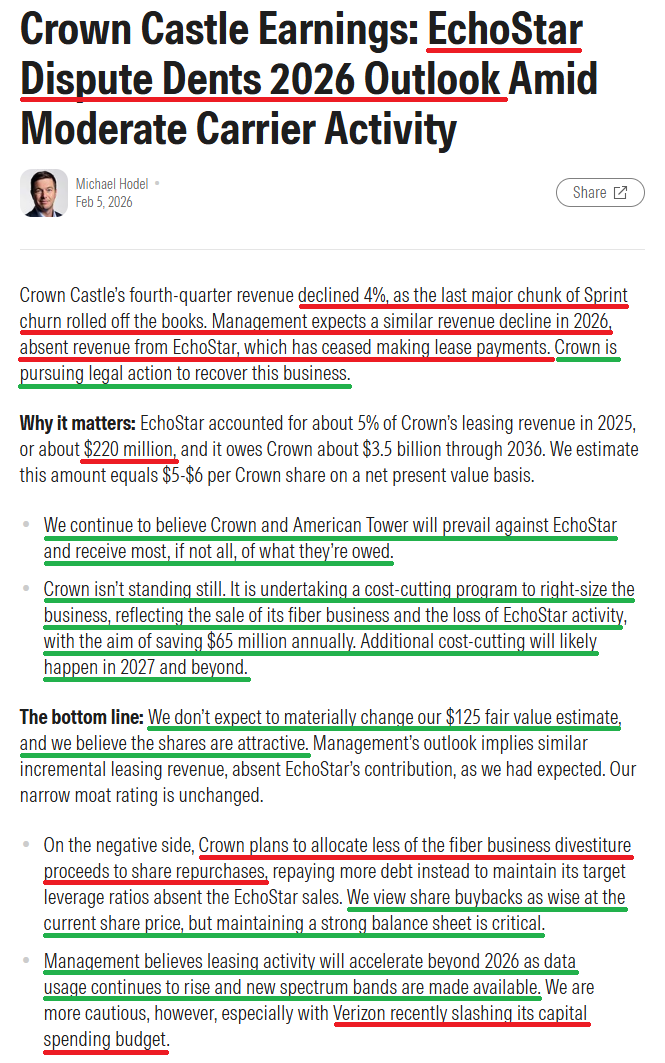
3) Following DISH’s (EchoStar) default on its payment obligations in January, CCI exercised its right to terminate the agreement and is now seeking to recover in excess of $3.5B in remaining payments owed through 2036 via legal action. DISH accounted for ~5% of CCI’s leasing revenue in 2025, or ~$220M, and management continues to expect full payment under the terms of the contract. The termination creates a $220M site rental headwind in FY26, with the 2026 outlook excluding any potential contractual offsetting payments from DISH. Management is pursuing recovery through every legal and regulatory channel available, though the court process could take a year or longer to resolve.
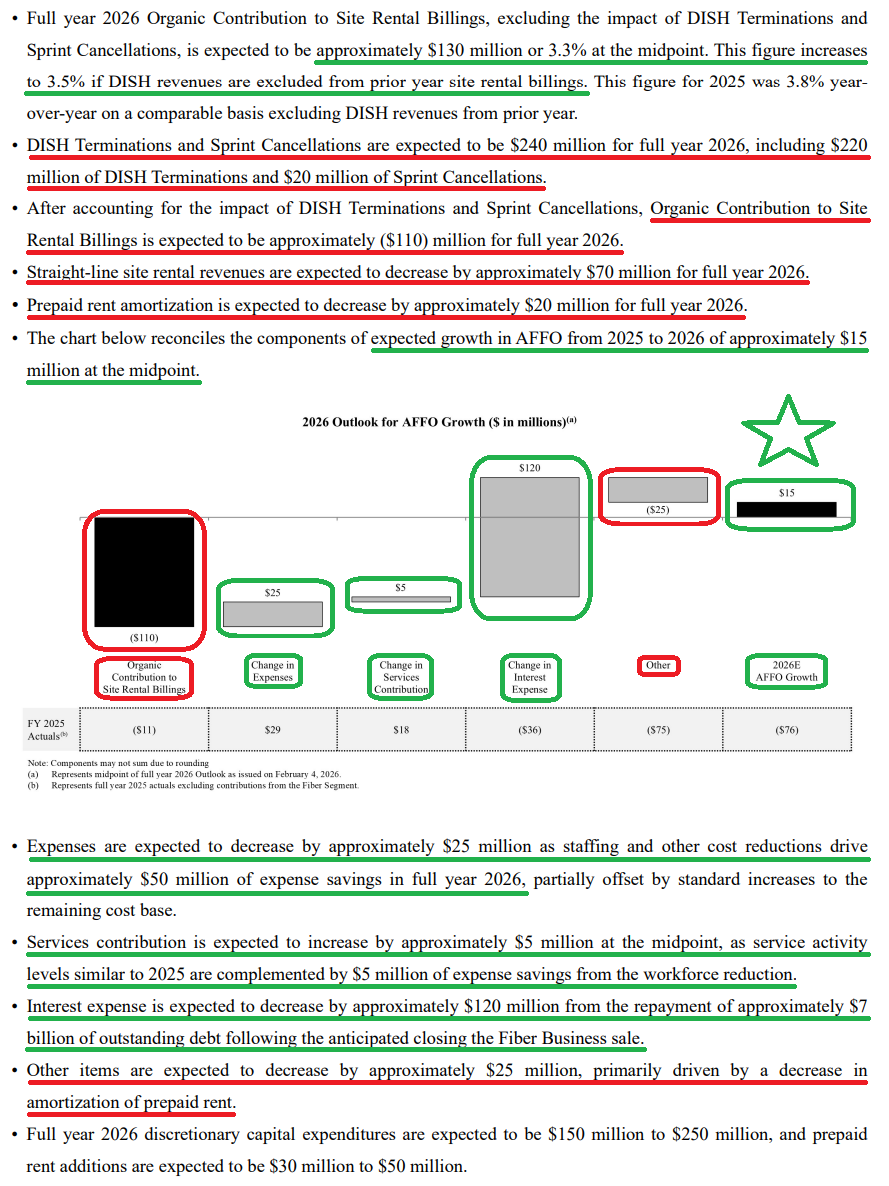
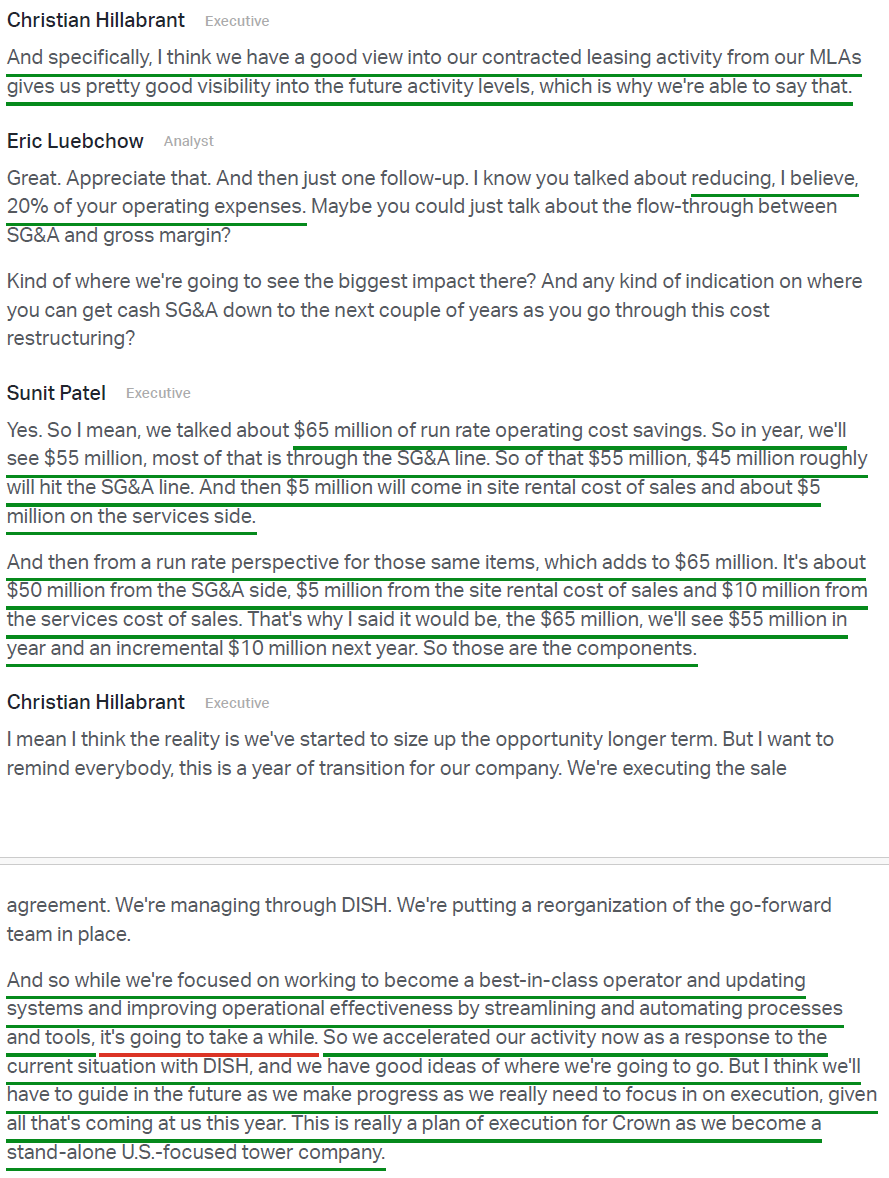
4) In response to the DISH default, management accelerated and expanded its restructuring plan, reducing the tower and corporate workforce in continuing operations by ~20%, or ~1,250 full-time employees. Combined with other cost reductions, the plan is expected to deliver $65M in annualized operating cost savings, with ~$55M realized in FY26 and an incremental $10M in 2027 due to the timing of non-labor reductions being phased in following the fiber sale close.
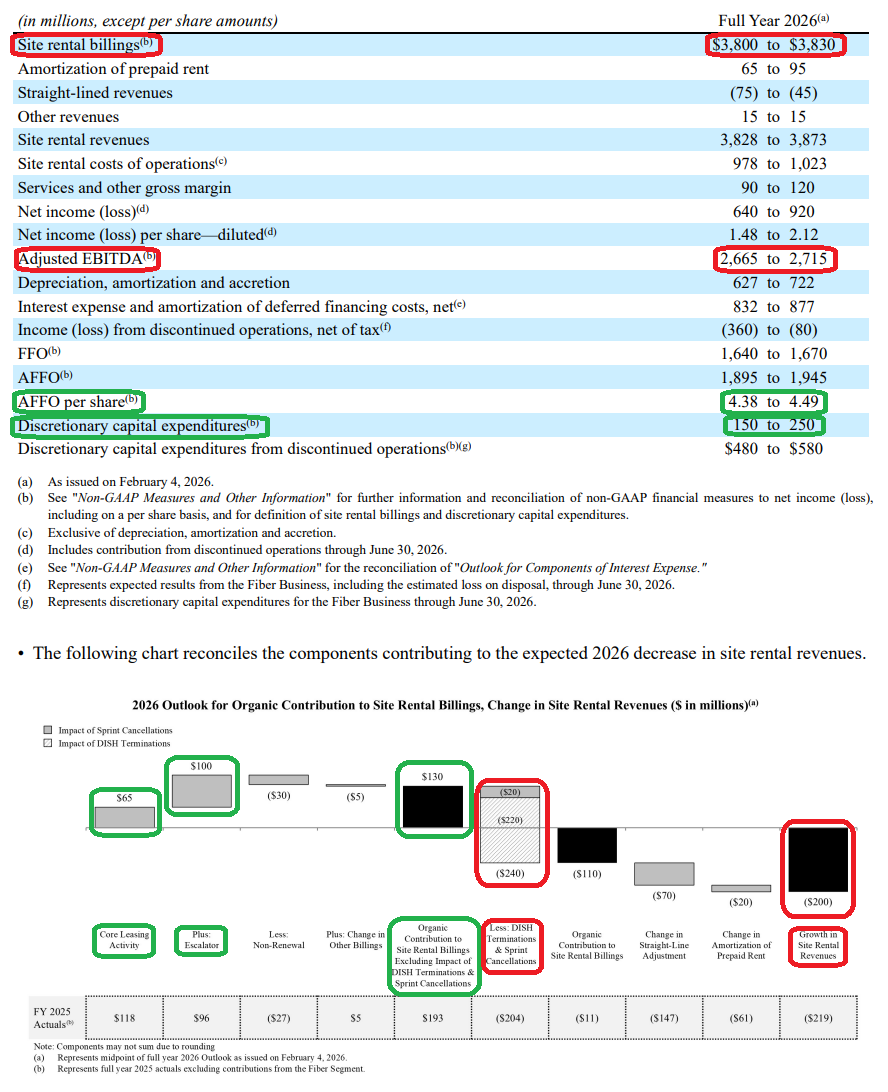
5) Full-year 2025 organic growth came in at 4.9% excluding the impact of Sprint churn, driven by 3% growth in core leasing activity and 2.5% from escalators. The $204M Sprint churn headwind is now largely behind the company, with management viewing FY26 as the trough year for organic growth at 3.5% ex-DISH and ex-Sprint cancellations, and expecting improvement thereafter.
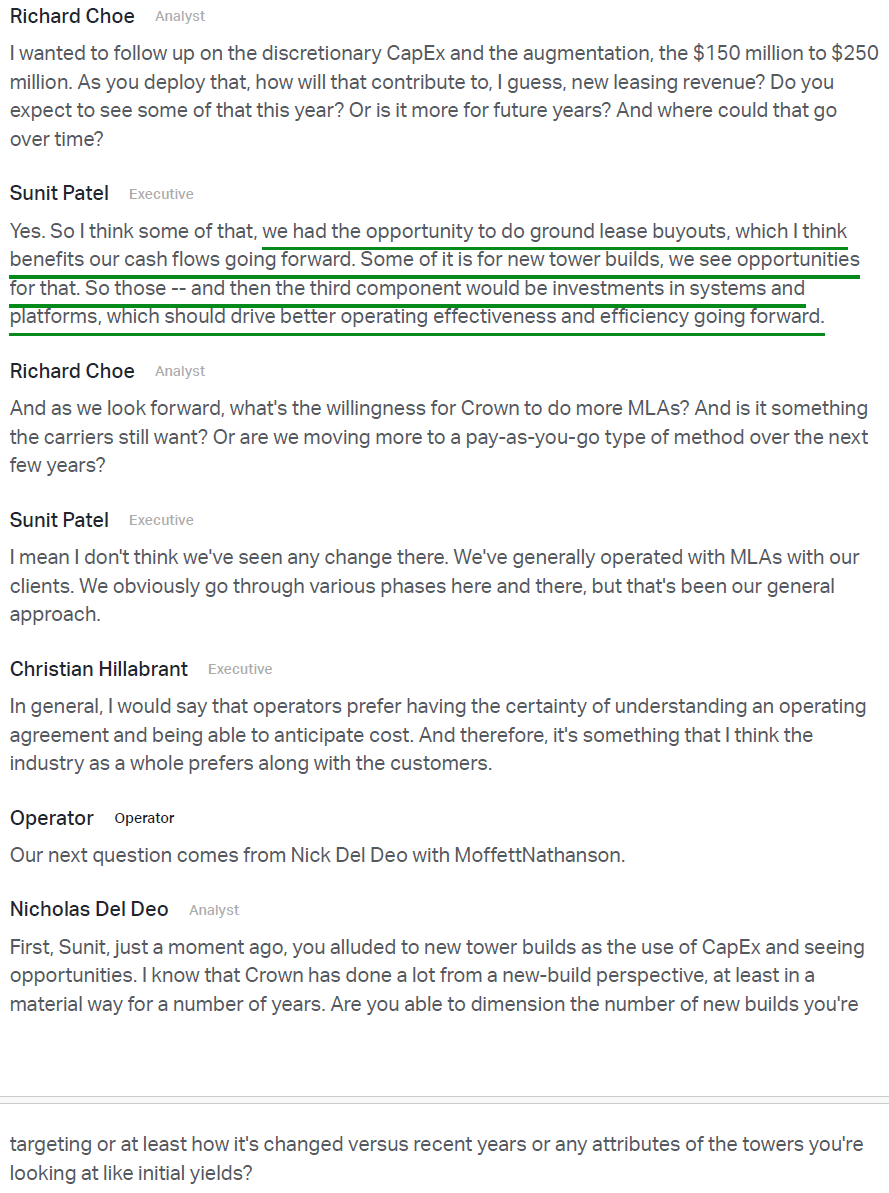
6) CCI expects 2026 discretionary capex to land between $150M and $250M, a dramatic step down from prior years given the removal of the capital-intensive fiber business. Management is also selectively exploring ground lease buyout opportunities but will remain highly disciplined, focusing only on towers with a minimum of two committed customers where return profiles are clearly attractive.
7) Management remains focused on maintaining an investment-grade balance sheet, ending the year with 84% of debt fixed, a weighted average debt maturity of ~6 years, and ~$4.1B of available liquidity under the revolving credit facility. Post fiber sale, leverage is expected to decline to a targeted 6x to 6.5x as ~$7B of debt is repaid, reducing annual interest expense by ~$120M.
8) CCI remains committed to maintaining the annualized dividend at $4.25 per share (current yield of ~5.3%), with a targeted payout ratio of 75-80% of AFFO and the dividend expected to grow in line with AFFO growth thereafter.
9) The long-term industry backdrop remains highly attractive, with tailwinds including AT&T’s recently announced $250B five-year infrastructure spending plan, continued healthy mobile data usage growth, and the FCC’s planned auction of at least 800 megahertz of spectrum beginning in 2027. Management expects leasing activity to accelerate meaningfully beyond FY26 as new spectrum bands are deployed and network investment ramps.
10) FY26 guidance calls for site rental revenues of $3.85B (-4.9% Y/Y), adjusted EBITDA of $2.69B (-6% Y/Y), and AFFO of $4.43 per share (+2% Y/Y) at the midpoint. The headline declines are entirely driven by the $220M DISH termination and $20M in remaining Sprint cancellations, which together mask healthy underlying core leasing growth of +3.5% ex-churn. Importantly, AFFO still grows despite the $240M headwind, driven by opex savings and lower interest expense. Management views FY26 as the trough year, with organic growth expected to accelerate thereafter.
Earnings Call Highlights
Morningstar Analyst Note
General Market
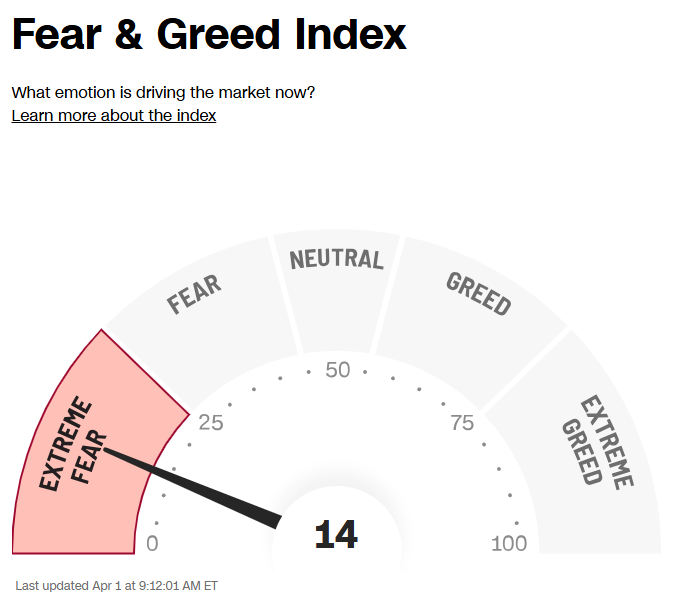
The CNN “Fear and Greed Index” ticked down to 14 this week from 18 last week. You can learn how this indicator is calculated and how it works here: (Video Explanation)
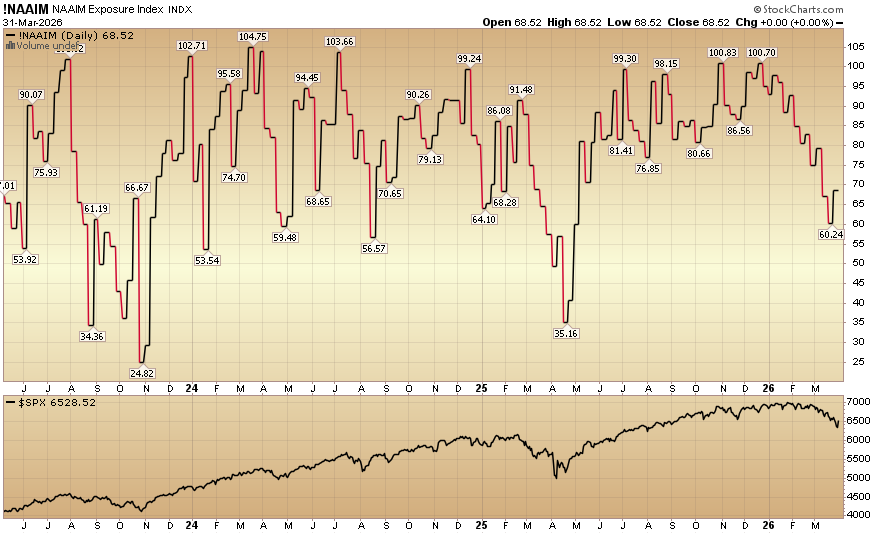
The NAAIM (National Association of Active Investment Managers Index) (Video Explanation) jumped to 68.52% equity exposure this week from last week’s 60.24%.
Our podcast|videocast will be out sometime today. We have a lot of great data to cover this week. Each week, we have a segment called “Ask Me Anything (AMA)” where we answer questions sent in by our audience. If you have a question for this week’s episode, please send it in at the contact form here.
Congratulations to all of the new clients that came in intra-quarter (Q1) with larger sized accounts, and to those existing clients who upsized their contributions to their accounts.
We are officially open to smaller accounts $1M+. The opening will close on April 10th at 5PM Eastern.
To see if you qualify and to take advantage of this opening click here, or go to GreatHillCapital.com for more details.
Larger accounts $5-10M+ can access bespoke service anytime here.
Not a solicitation.
*Opinion, Not Advice. See Terms


