Key Market Outlook(s) and Pick(s)
A couple weeks ago, I joined Jared Blikre and Sydnee Fried on Yahoo! Finance “Stocks in Translation” to discuss markets, moats, housing, picks, and more. Thanks to Jared, Sydnee, and Taylor (Smith) Clothier for having me on:
Watch full show in HD directly on Yahoo! Finance
On Tuesday, I joined Fahed al Zahrani and Samia Saleh on Bloomberg TV Dubai to discuss markets, outlook, and more. Thanks for Fahed, Samia, and Tabarek Jouini for having me on:
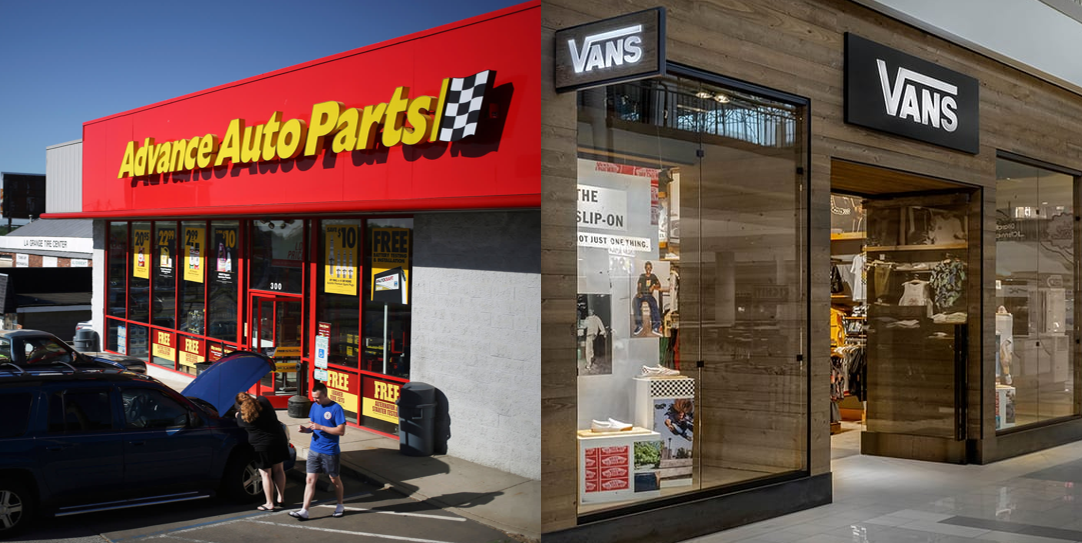
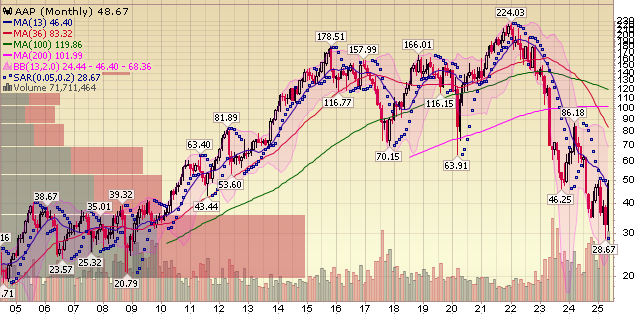
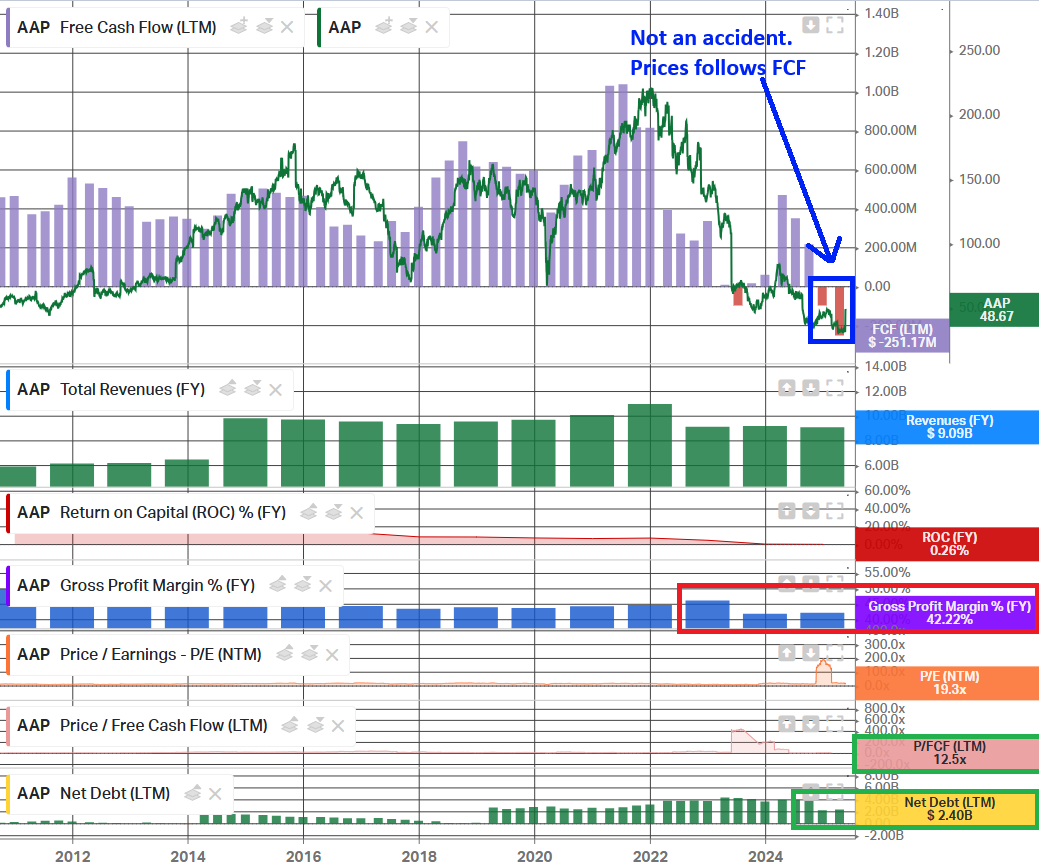
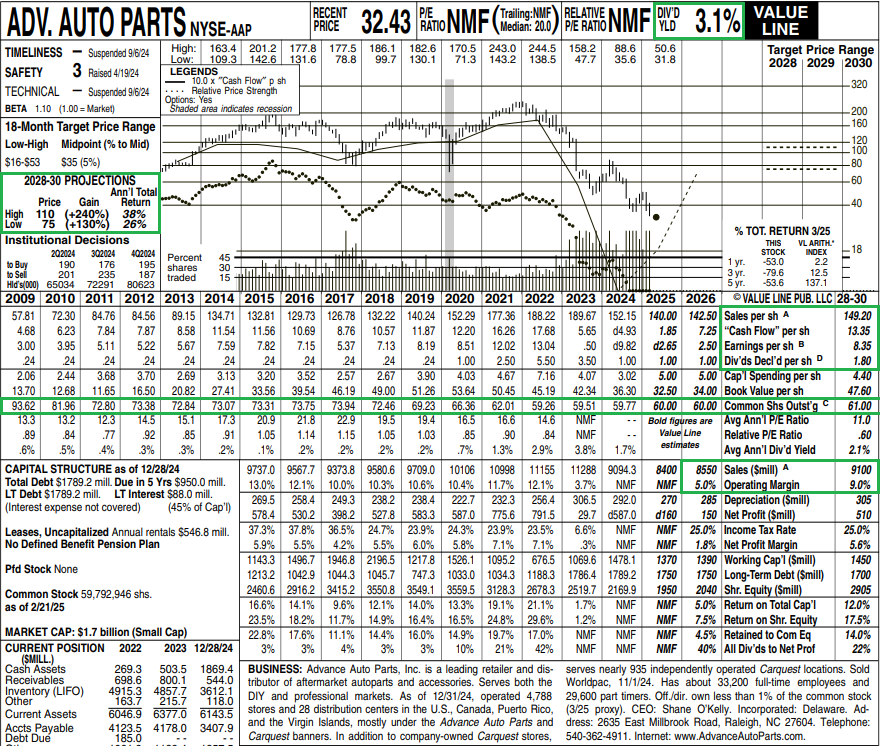
Advance Auto Parts Update
Each week we try to cover 1-2 companies we have discussed in previous podcast|videocast(s) and/or own for clients (including personally).
10 Key Points
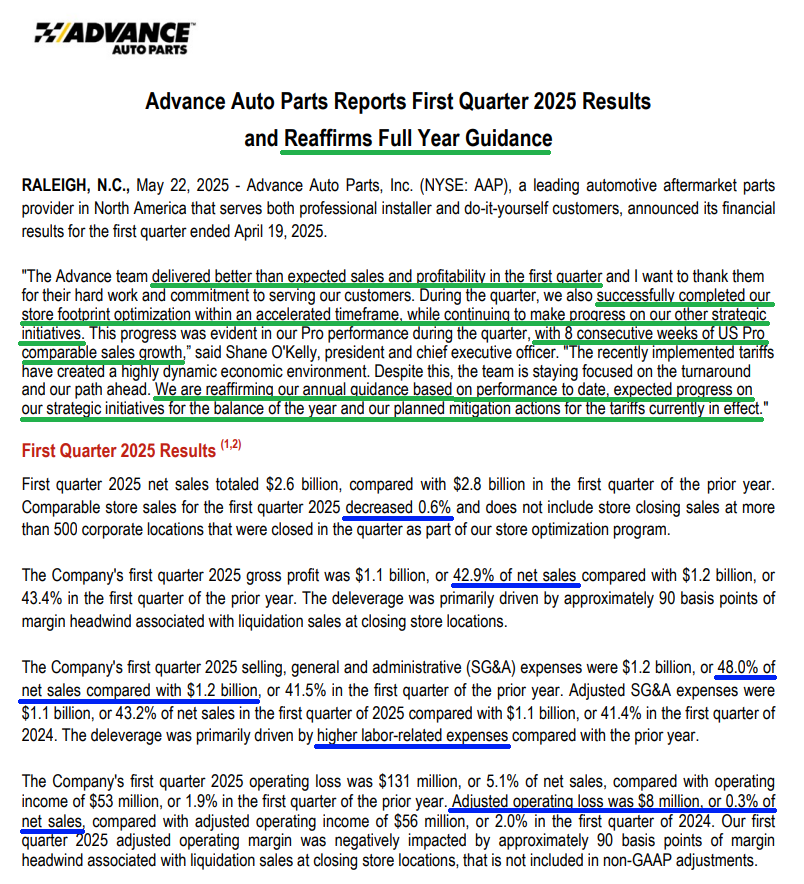
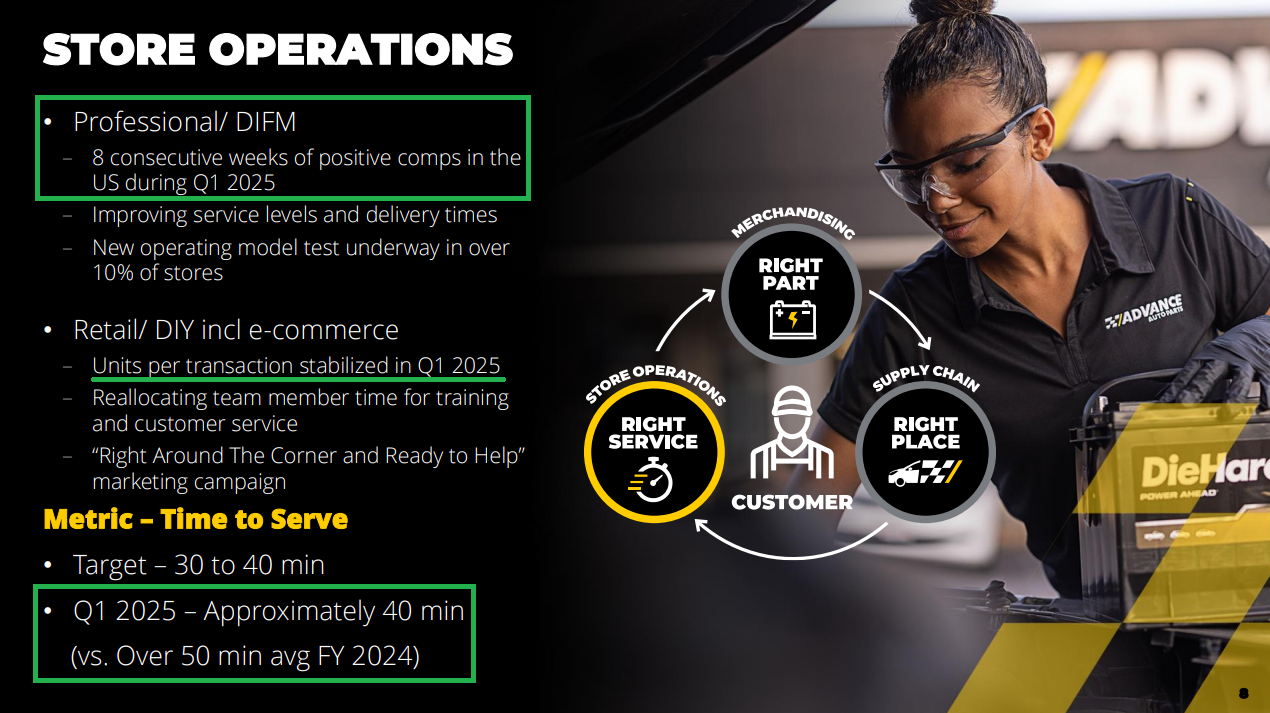
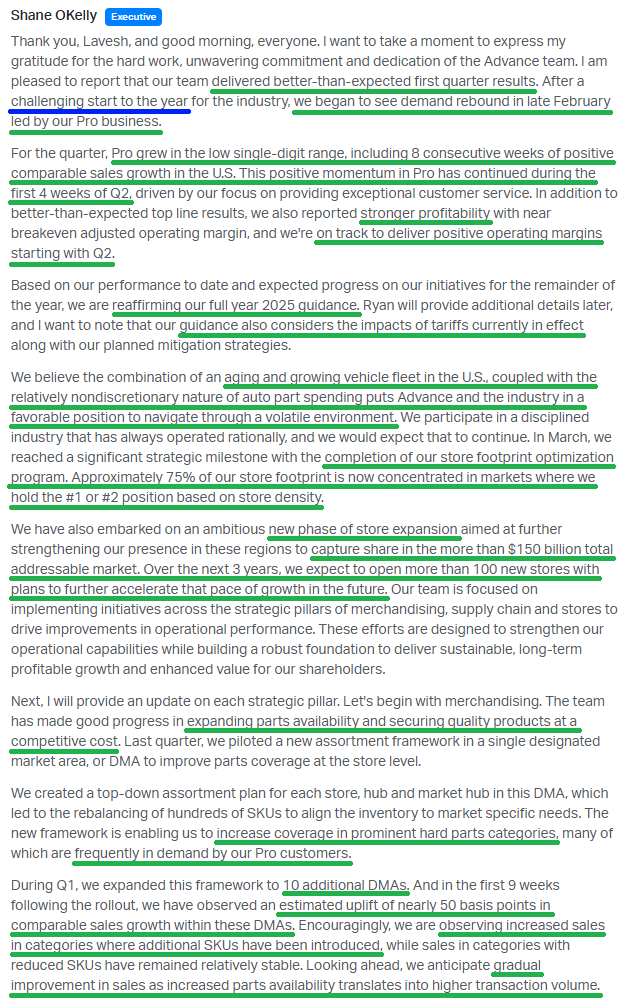
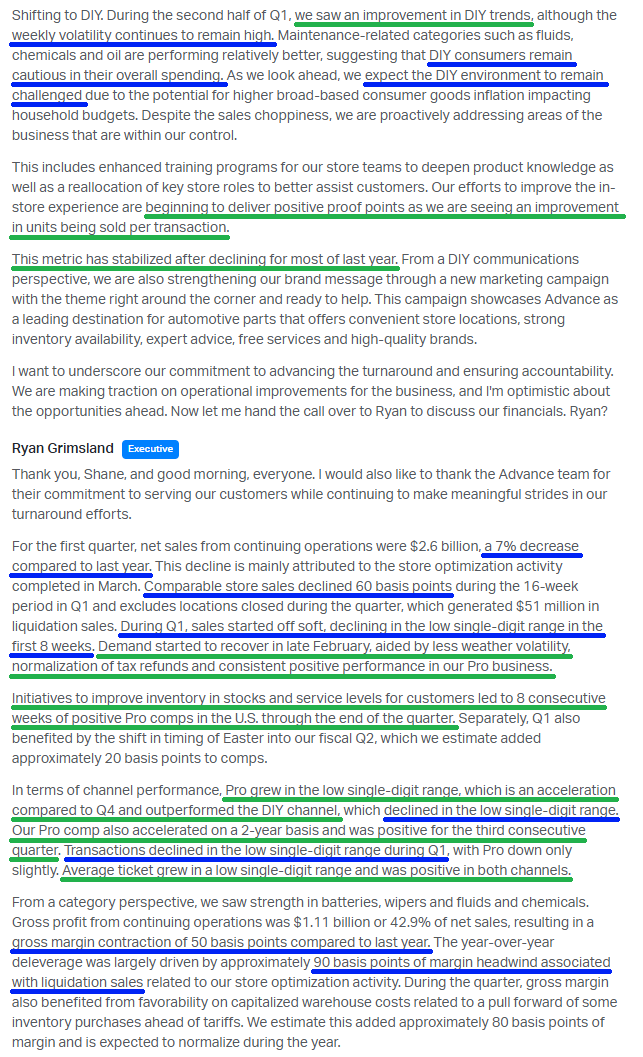
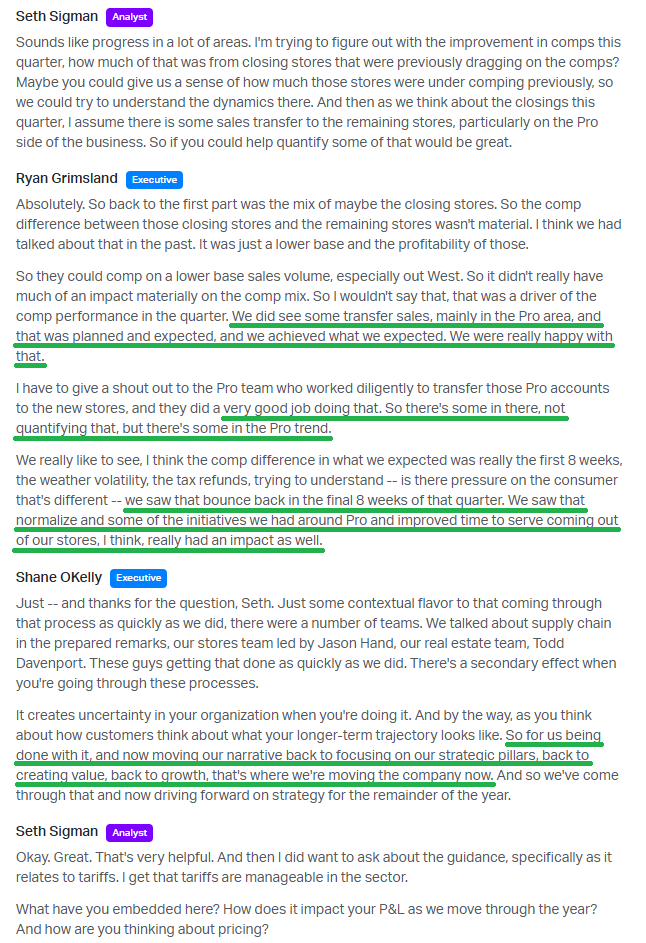
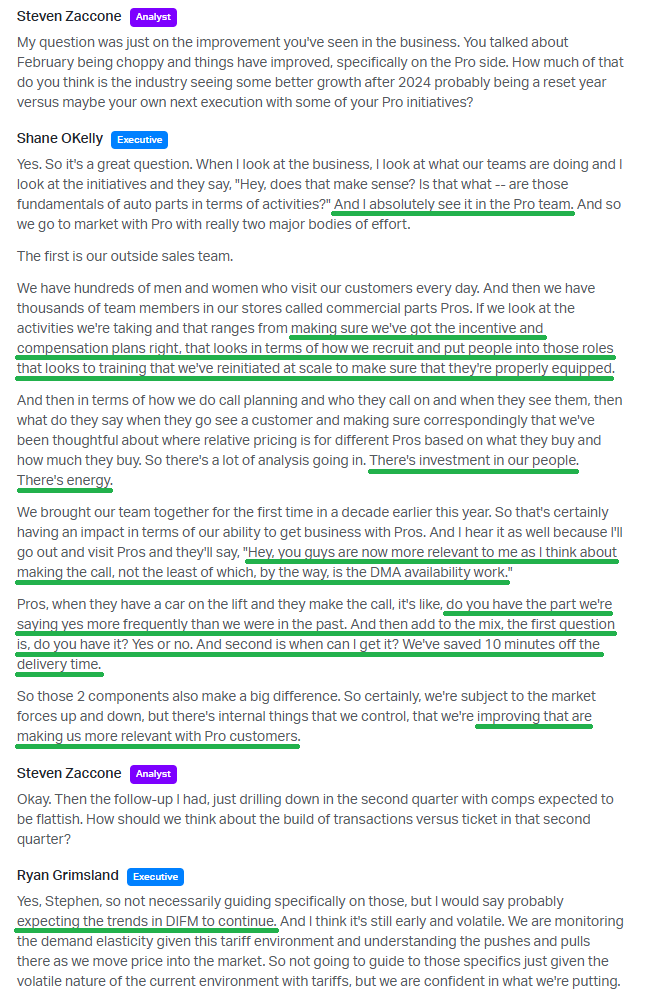
1) The Pro segment, which makes up around 60% of AAP’s sales, continues to perform well, posting low single digit growth for the third straight quarter and delivering eight consecutive weeks of positive US Pro comp sales. That momentum has continued into Q2, with strength sustained through the first four weeks.
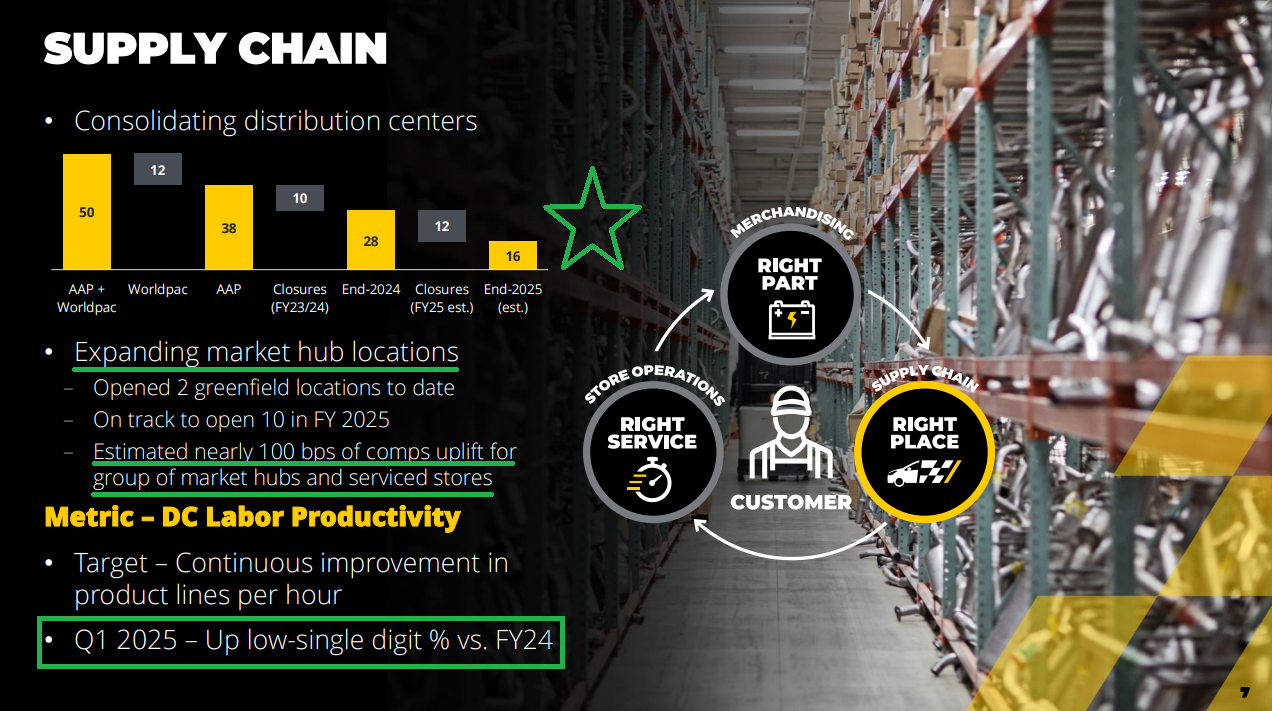
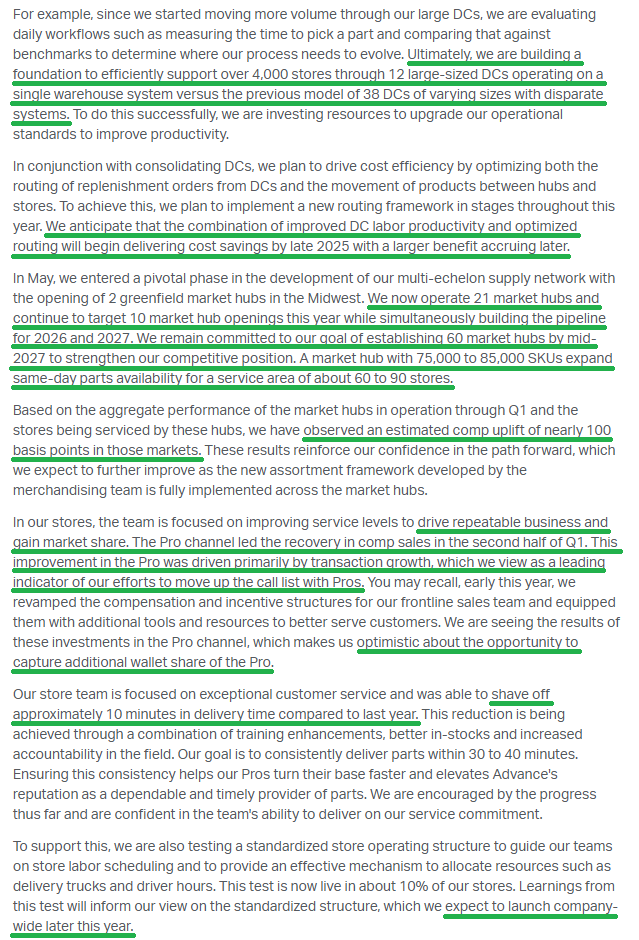
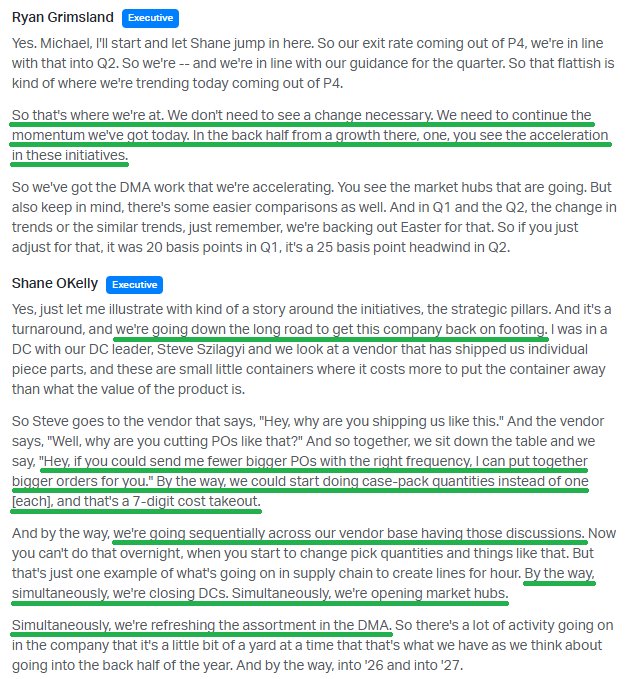
2) The supply chain consolidation continues to progress, reducing the network from 38 varied distribution centers to 12 large DCs operating on a unified warehouse system. Management expects the DC consolidation to be completed by the end of 2026 and has a goal of 60 market hubs by mid-2027. Stores serviced by market hubs saw nearly a 100 bps comp uplift during the quarter, and cost savings from the DC plan are expected by late 2025.
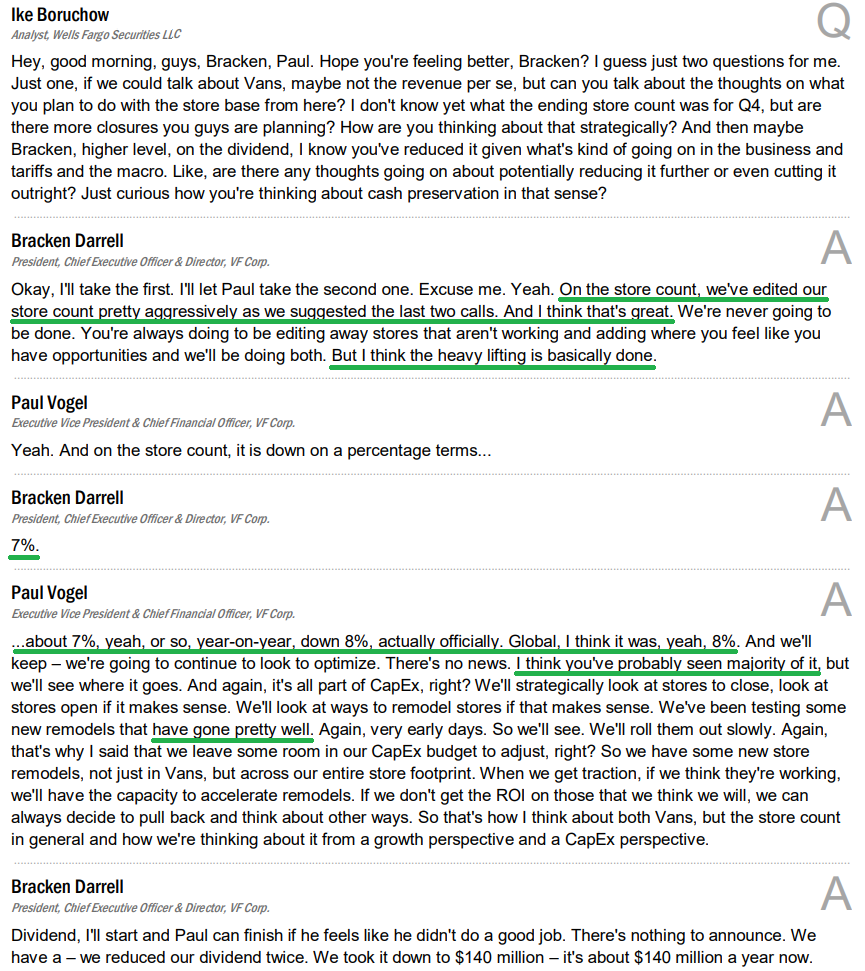
3) Management completed the store footprint optimization in March, well ahead of the original mid-2025 guidance. Cash expenses for the plan are now $150M for the full year, down from the prior $200M estimate. Transfer sales related to store closures were strong, primarily in the Pro segment.
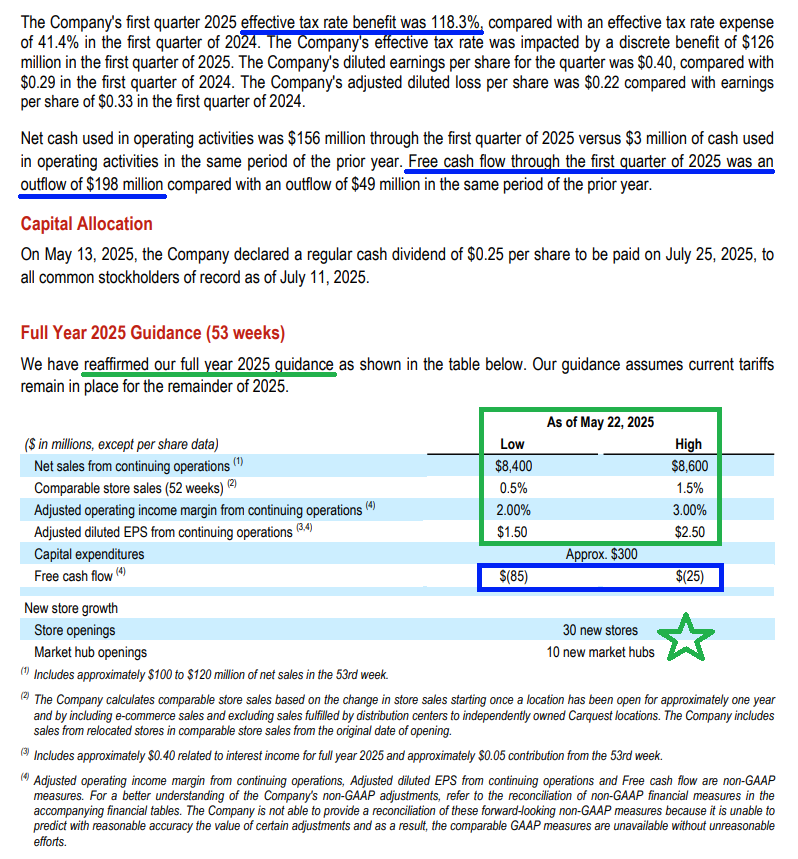
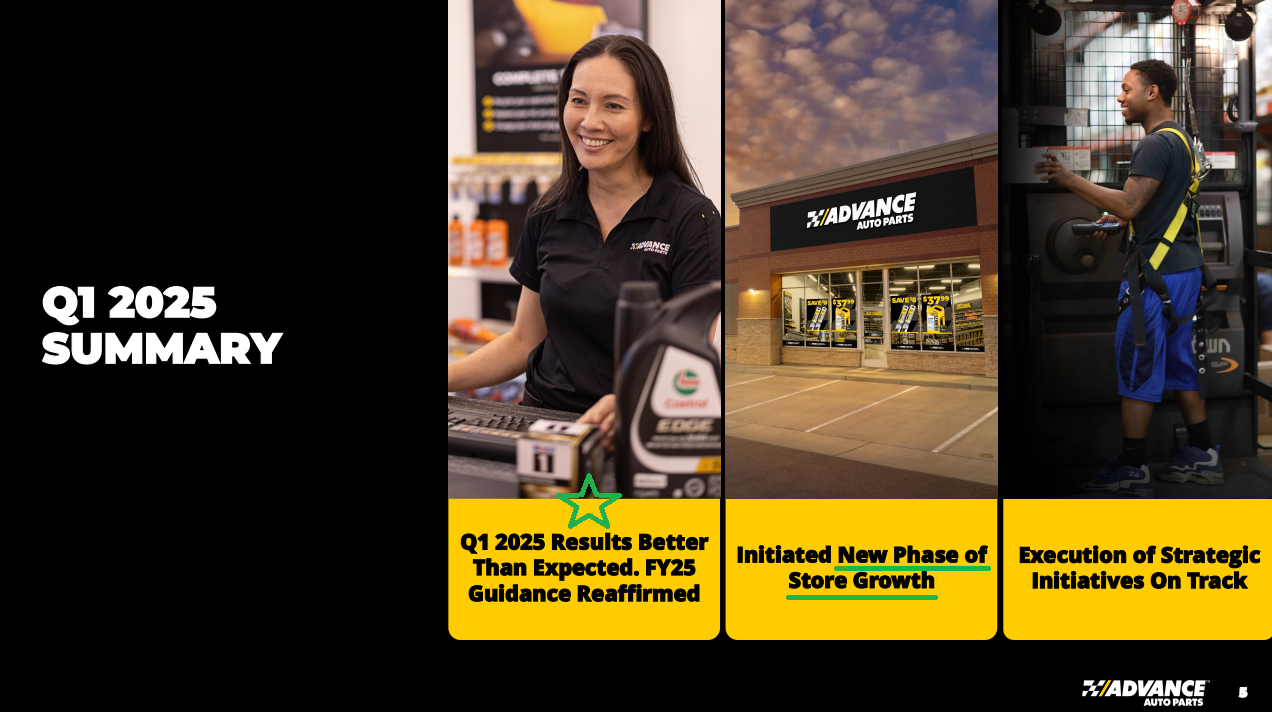
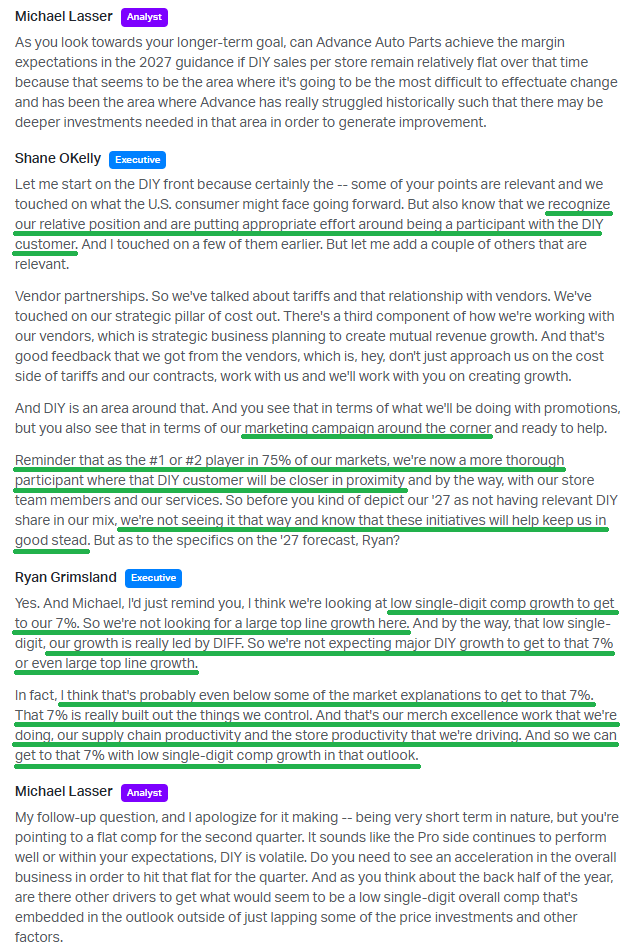
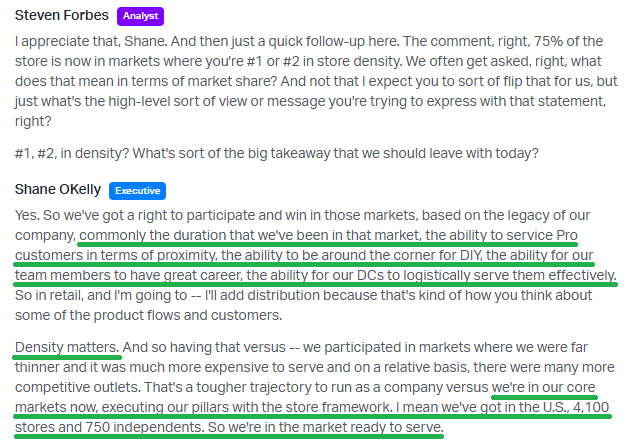
4) AAP is entering a new phase of store expansion, planning to open over 100 new stores in the next 3 years. Store concentration and density have increased, with 75% of the footprint now in markets where AAP holds the #1 or #2 position.
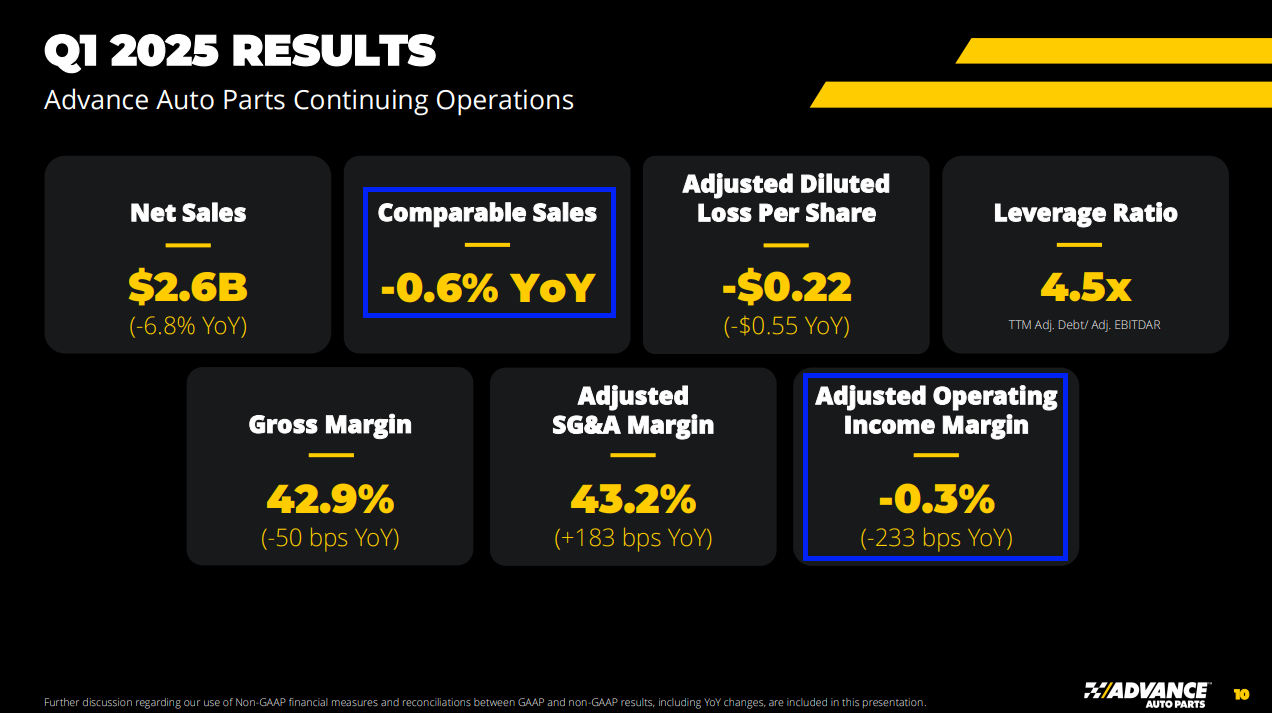
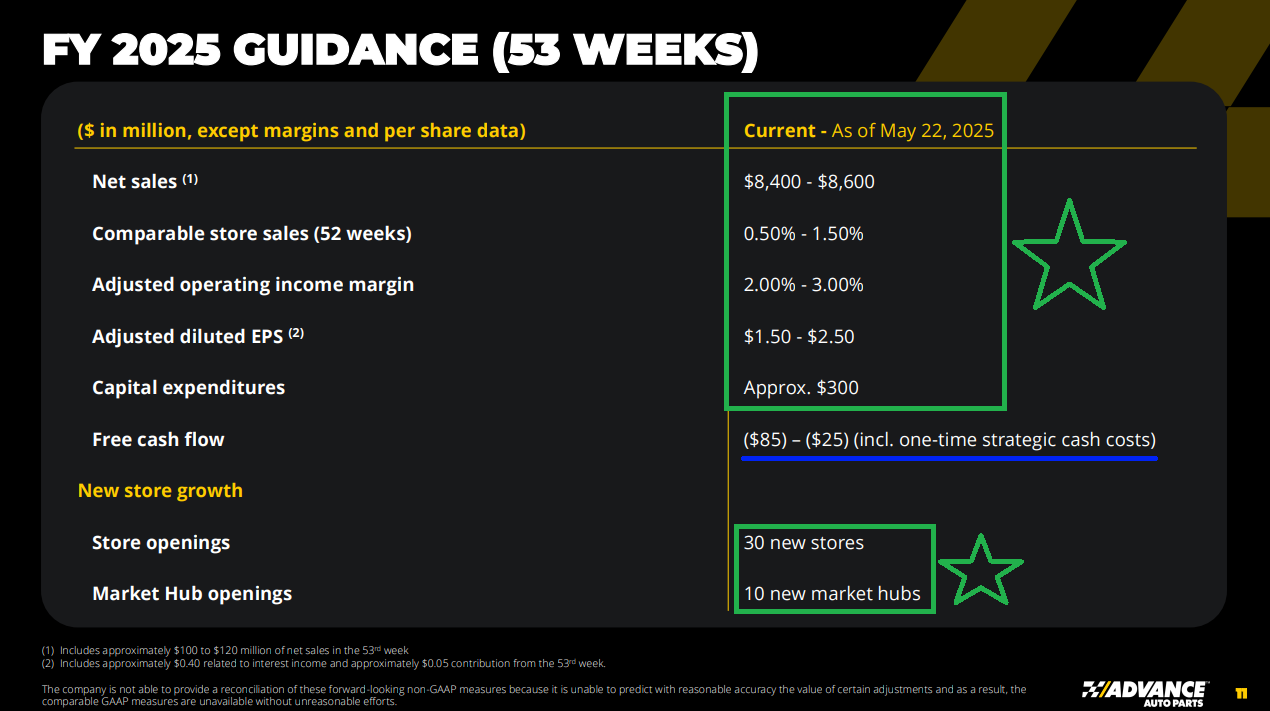
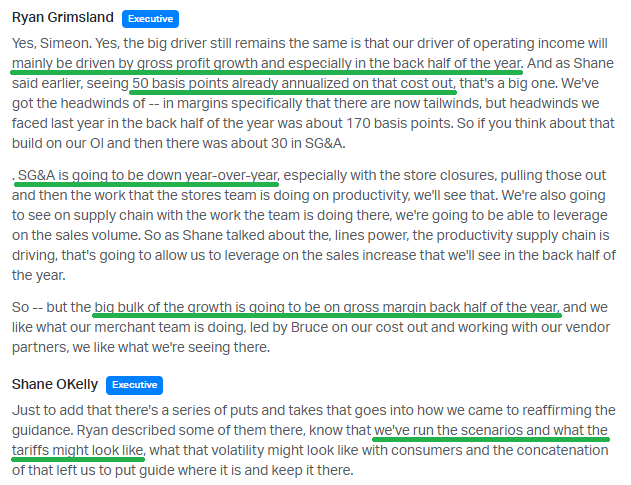
5) Operating margins for the full year are still expected to be between 2% and 3%. Q2 is tracking in line with this range, with further gains expected in the second half. Most importantly, AAP remains well on track to meet its 2027 target of 7%.
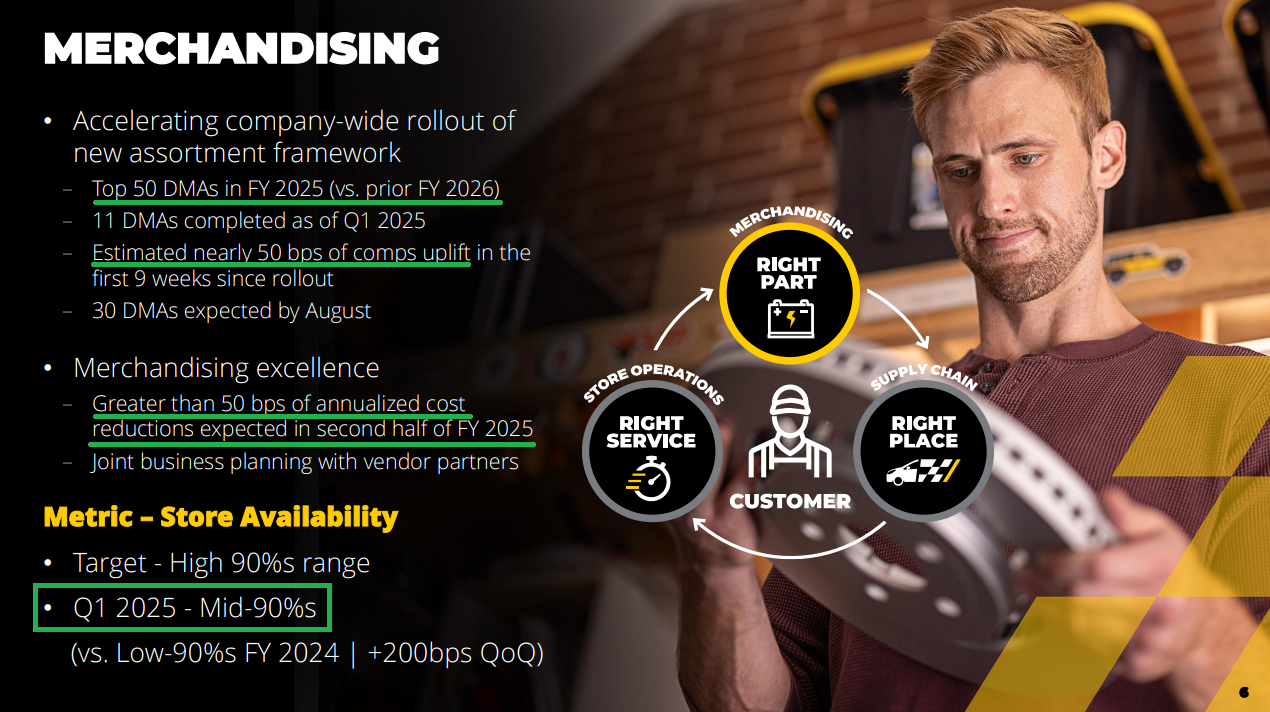
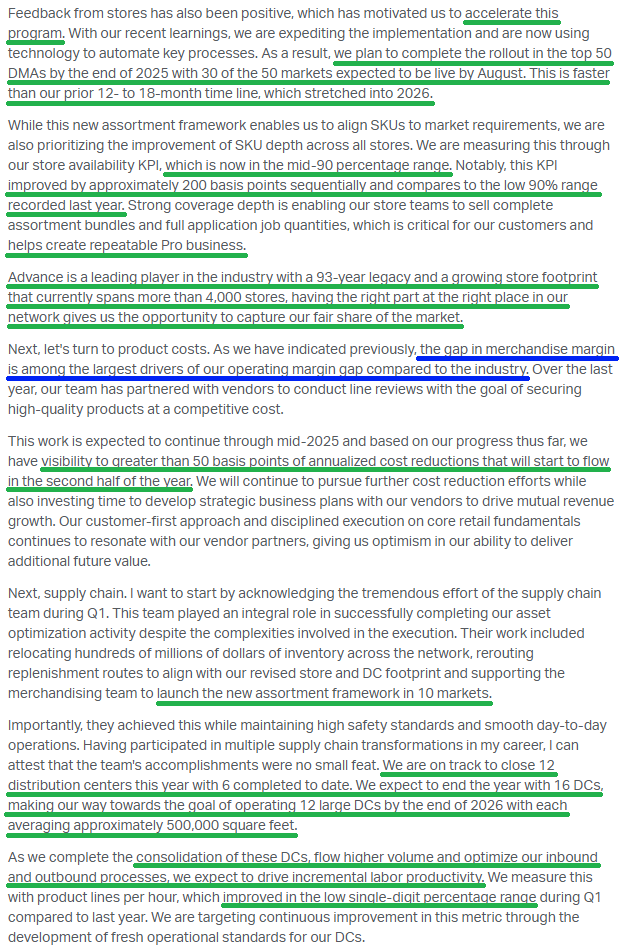
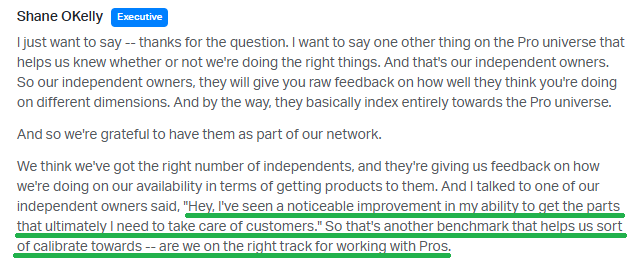
6) All major company KPIs continue to improve. Store availability rose to the mid-90%s, up over 200 bps sequentially. DC labor productivity increased by low single-digit % versus FY2024. Time to serve improved by ~10 minutes down to 40 minutes.
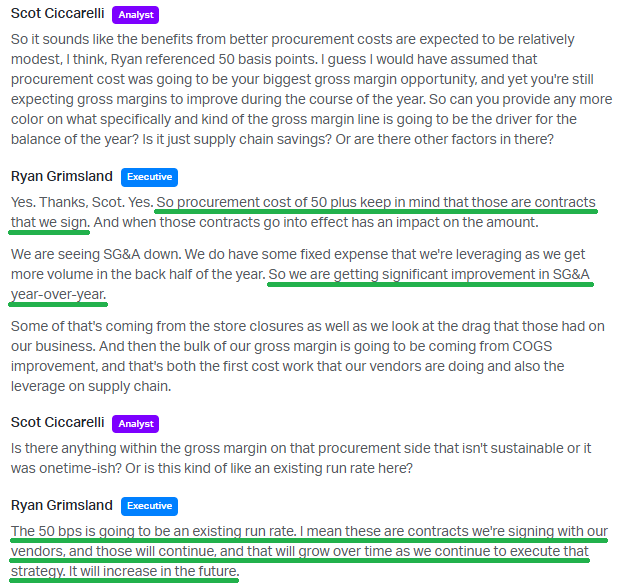
7) The new DMA merchandising framework expanded to 10 additional DMAs in Q1, driving a 50 bps comp lift that is expected to become the new existing run rate and grow over time. Management is accelerating the rollout timeline from 12–18 months (stretching into 2026) to complete the top 50 DMAs by the end of 2025, with 30 of 50 live by August.
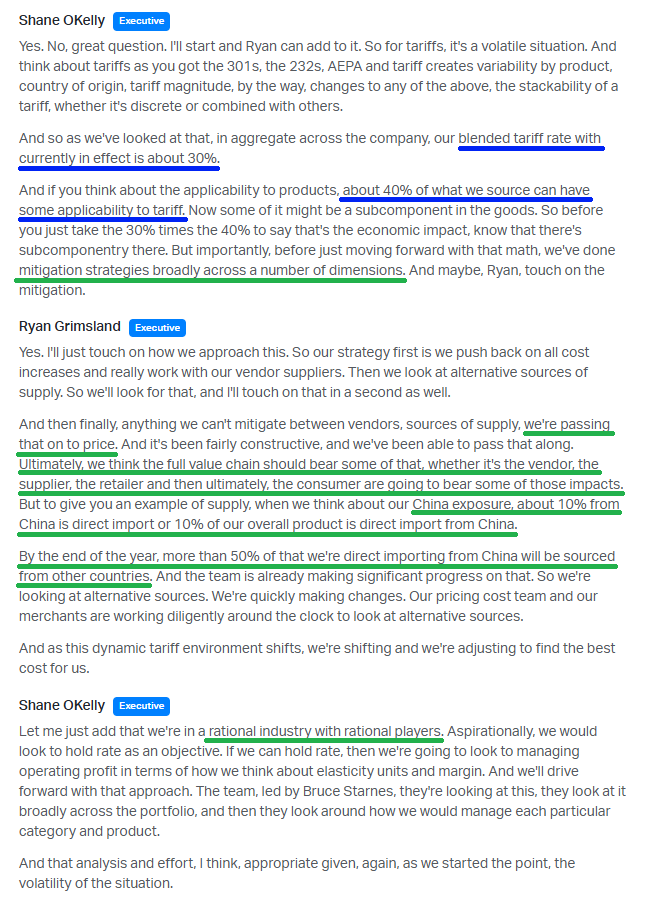
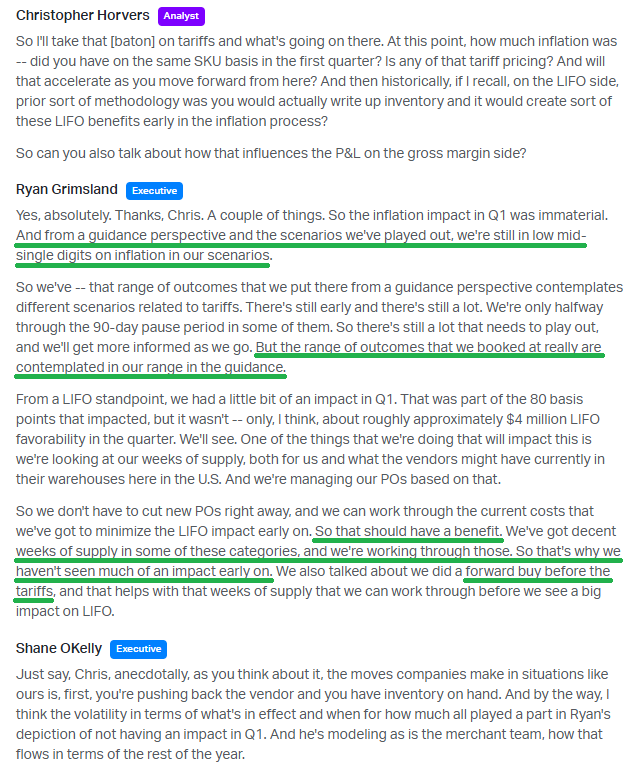
8) AAP’s total exposure to China is about 10%, with management expecting over half of that to be sourced from other countries by year-end. The blended tariff rate currently stands around 30%, and management plans to offset this through price adjustments and alternative sourcing, while also purchasing ~$100 million in inventory at pre-tariff prices to further mitigate the impact.
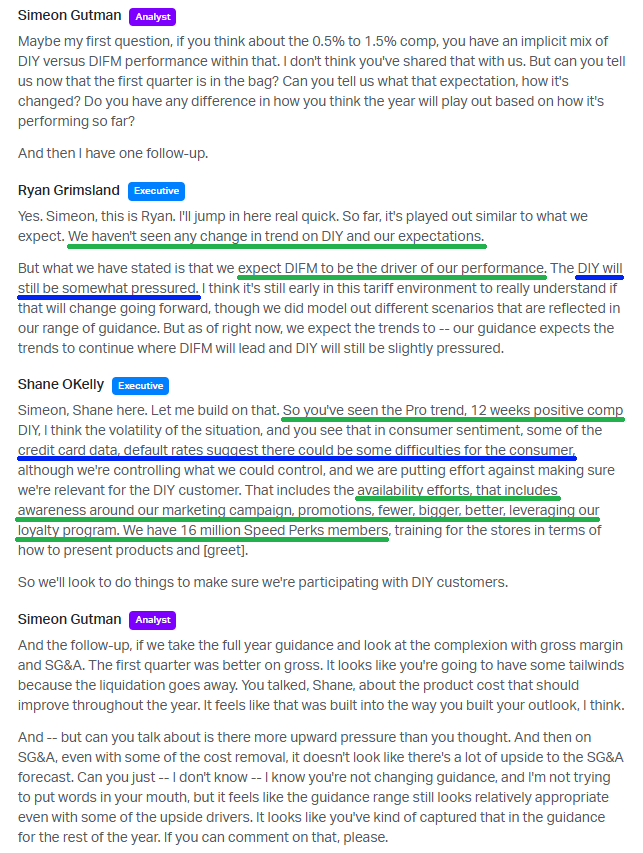
9) Management reaffirmed full-year guidance of $8.4B to $8.6B in net sales, 0.5% to 1.5% comp sales growth, 2% to 3% operating margins, and $1.50 to $2.50 adjusted diluted EPS.
10) DIY remains under pressure, down low single digits, but began to improve in the second half of Q1. Units per transaction stabilized and showed gains after declining throughout most of 2024.
Earnings Call Highlights


VF Corp Update
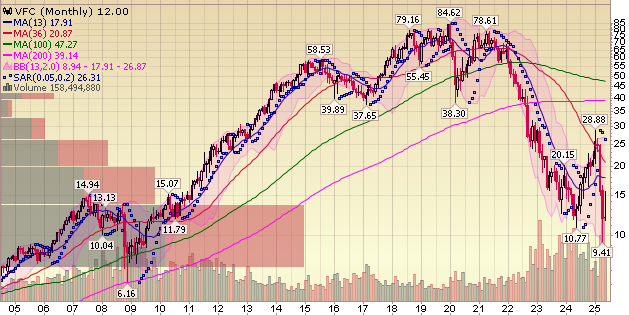

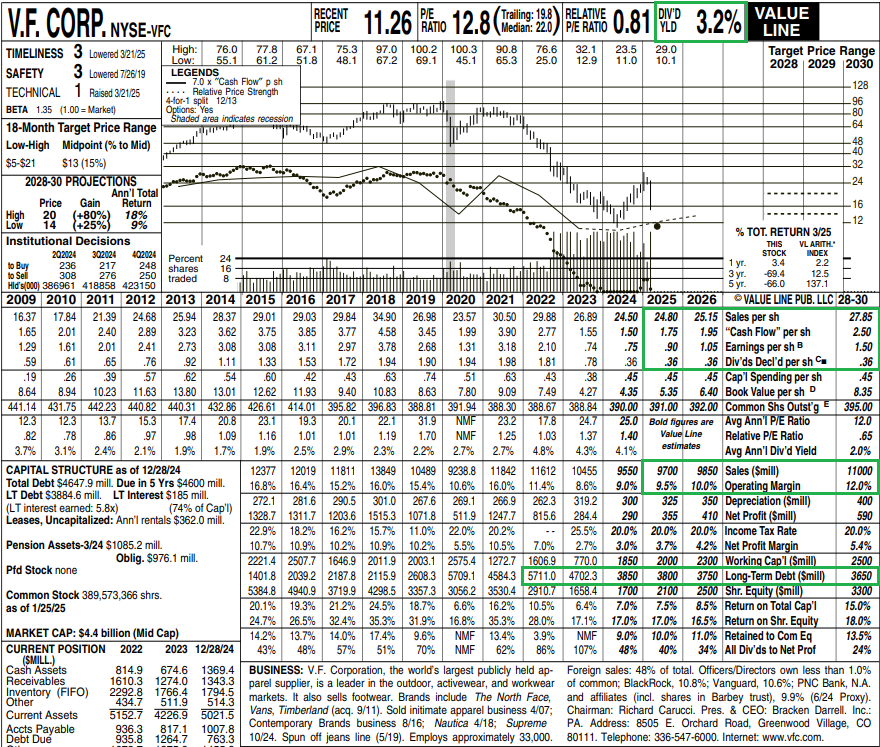
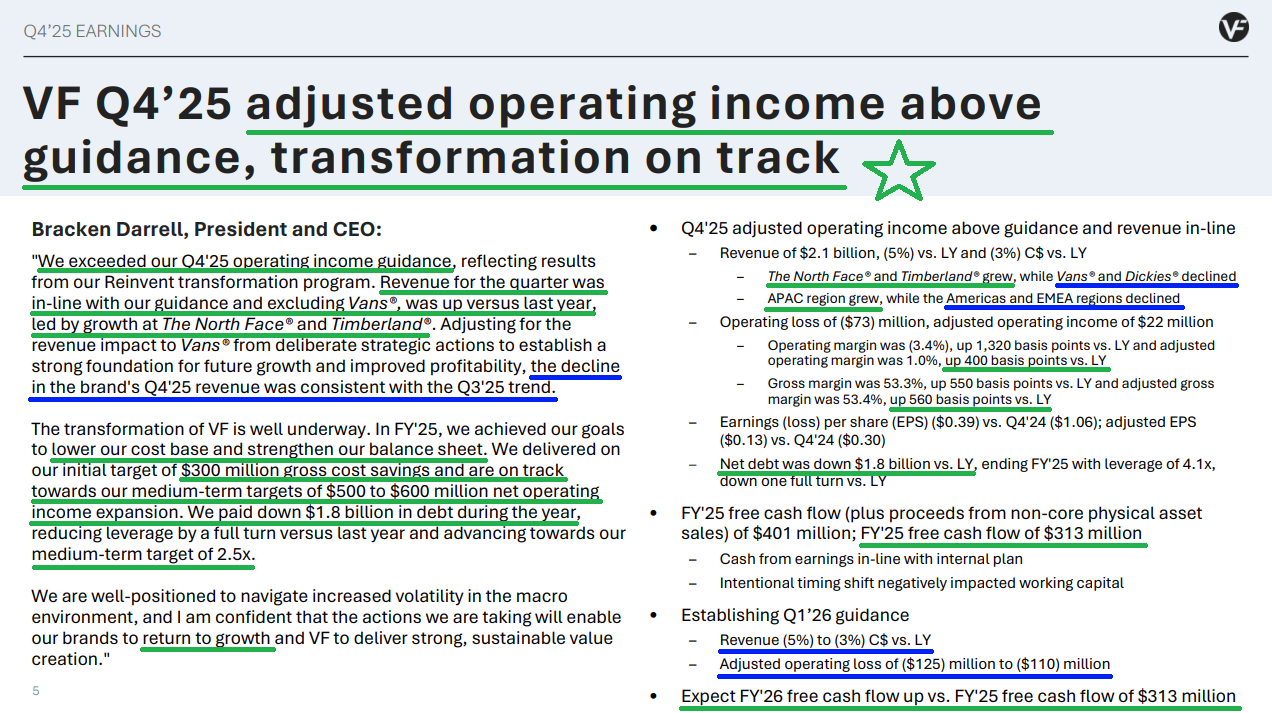
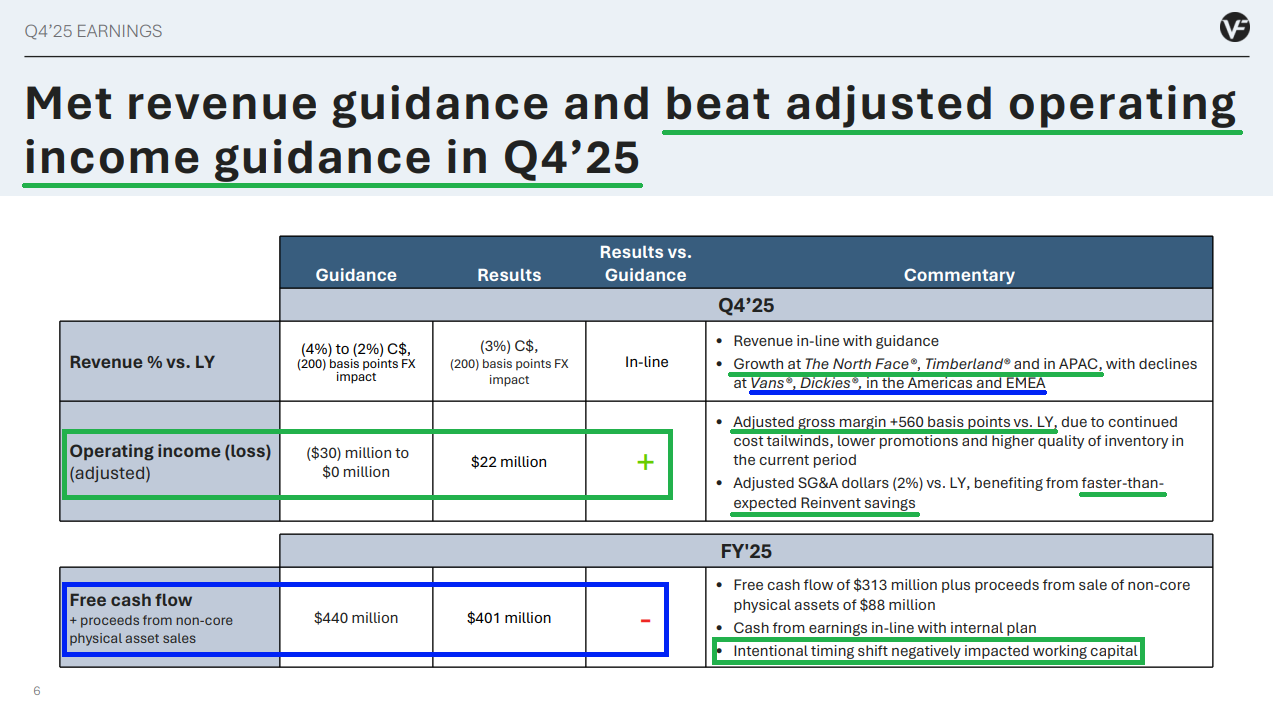
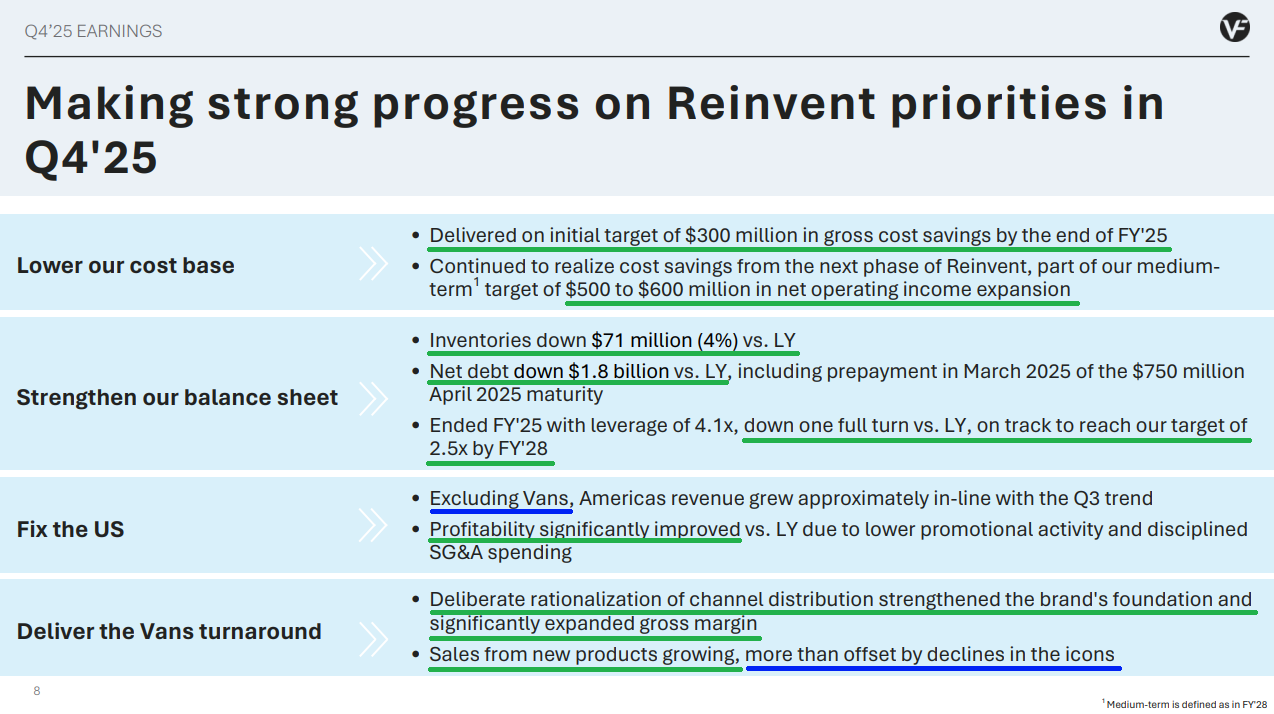
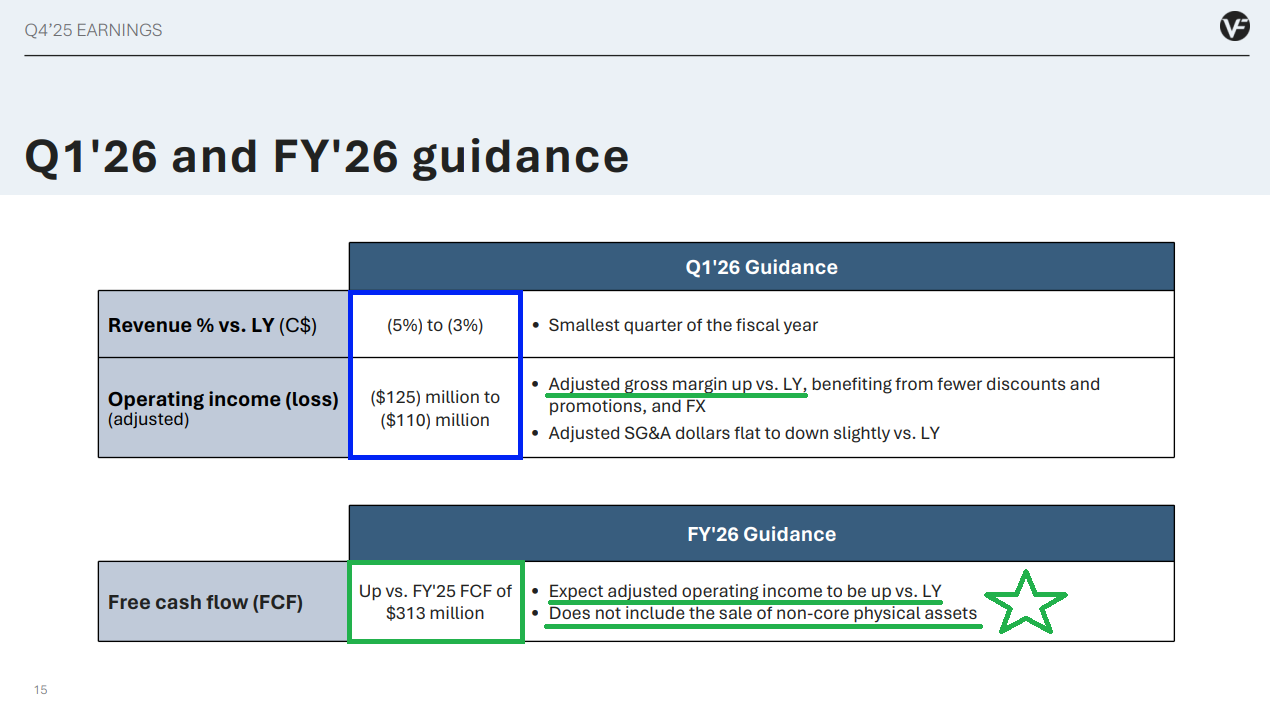
10 Key Points
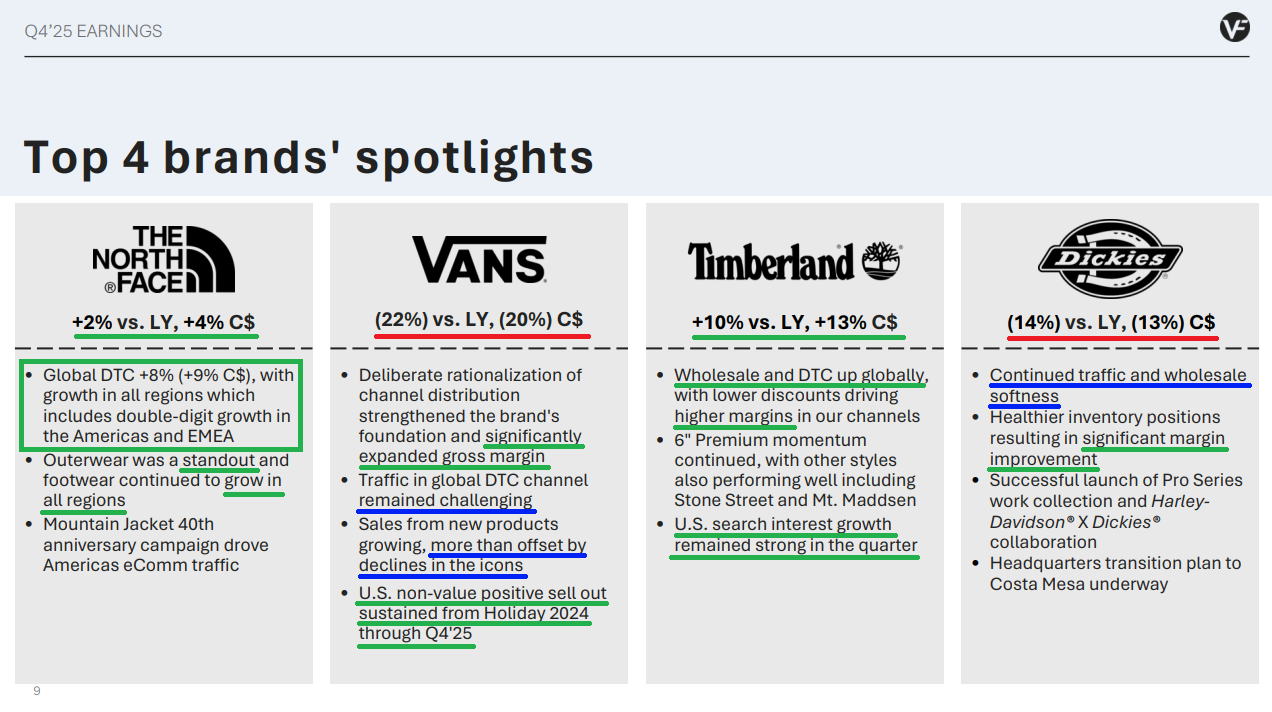
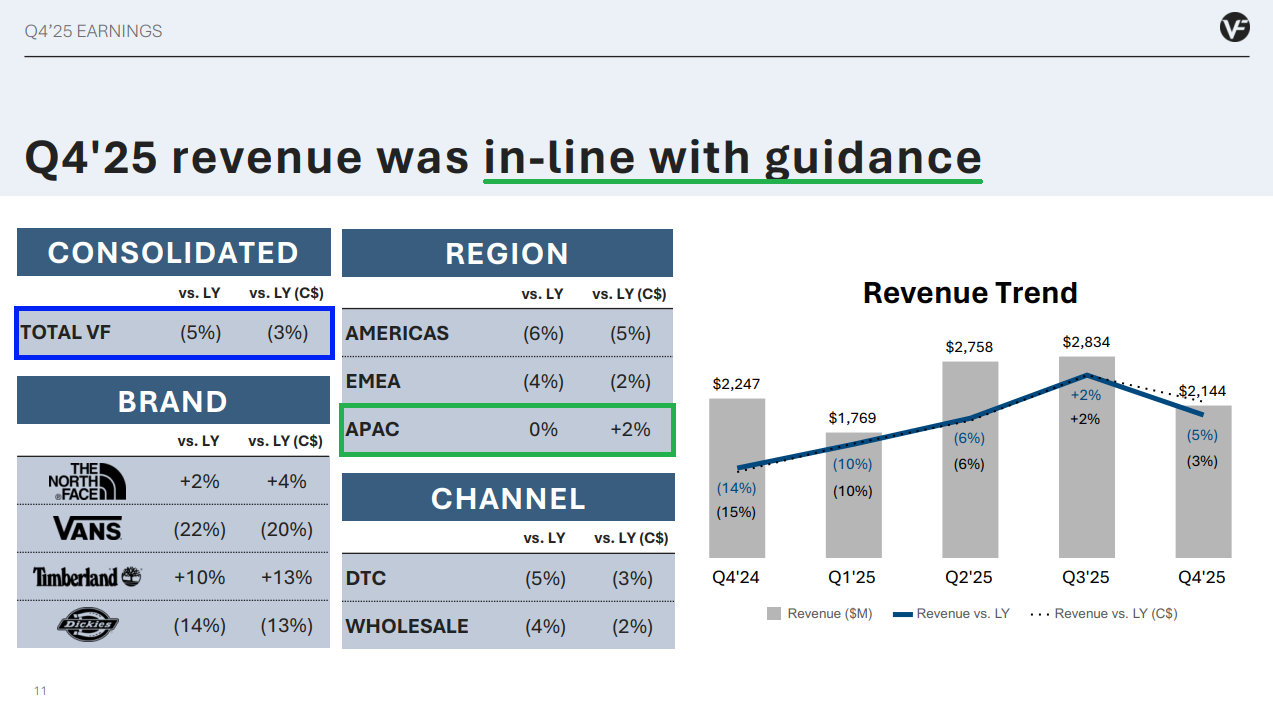
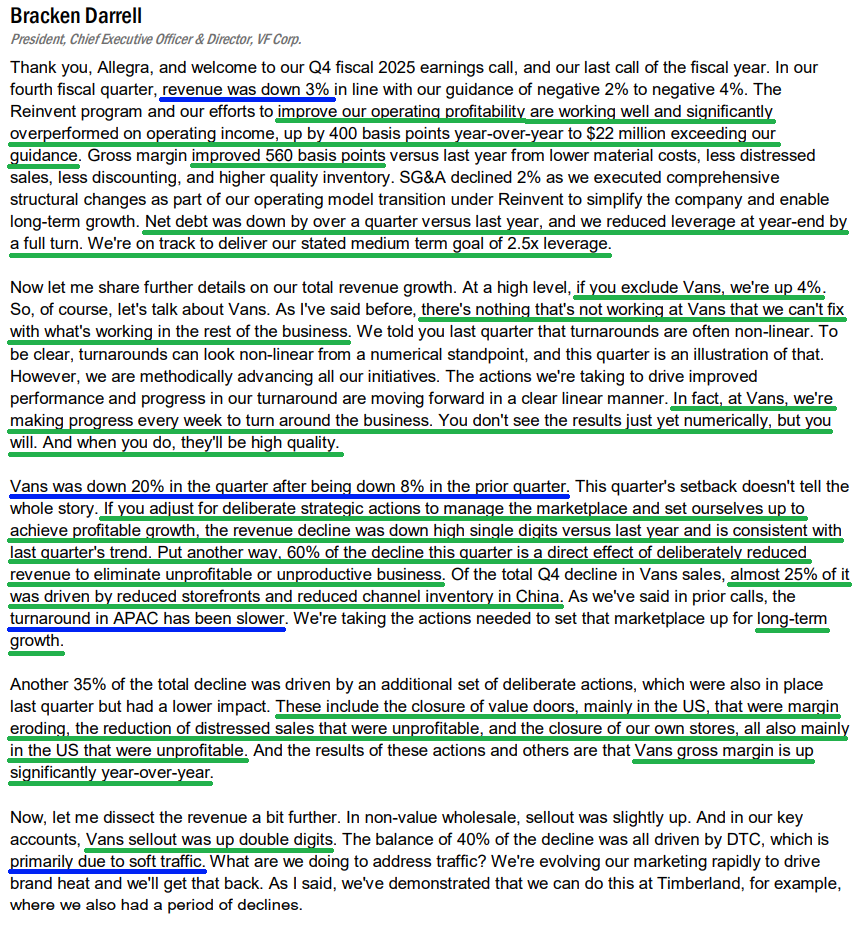
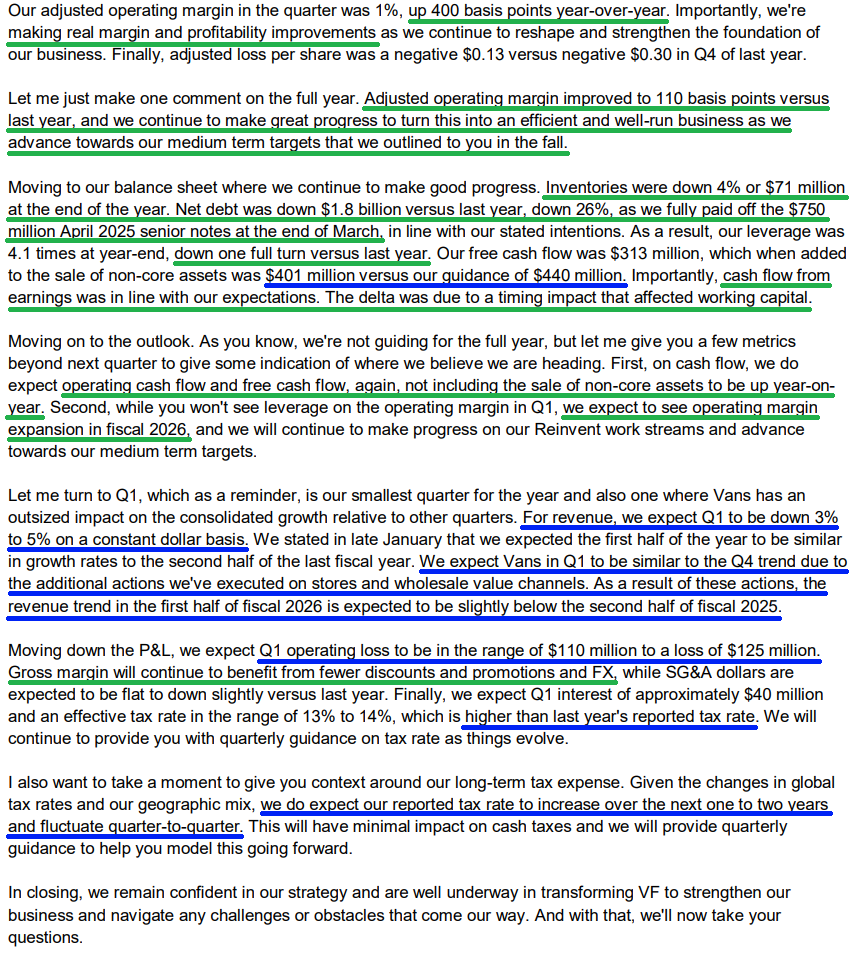
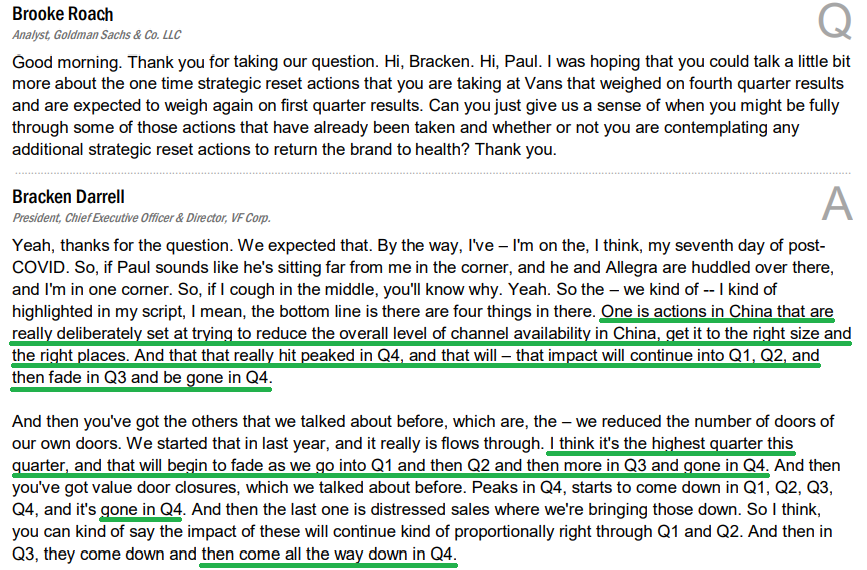
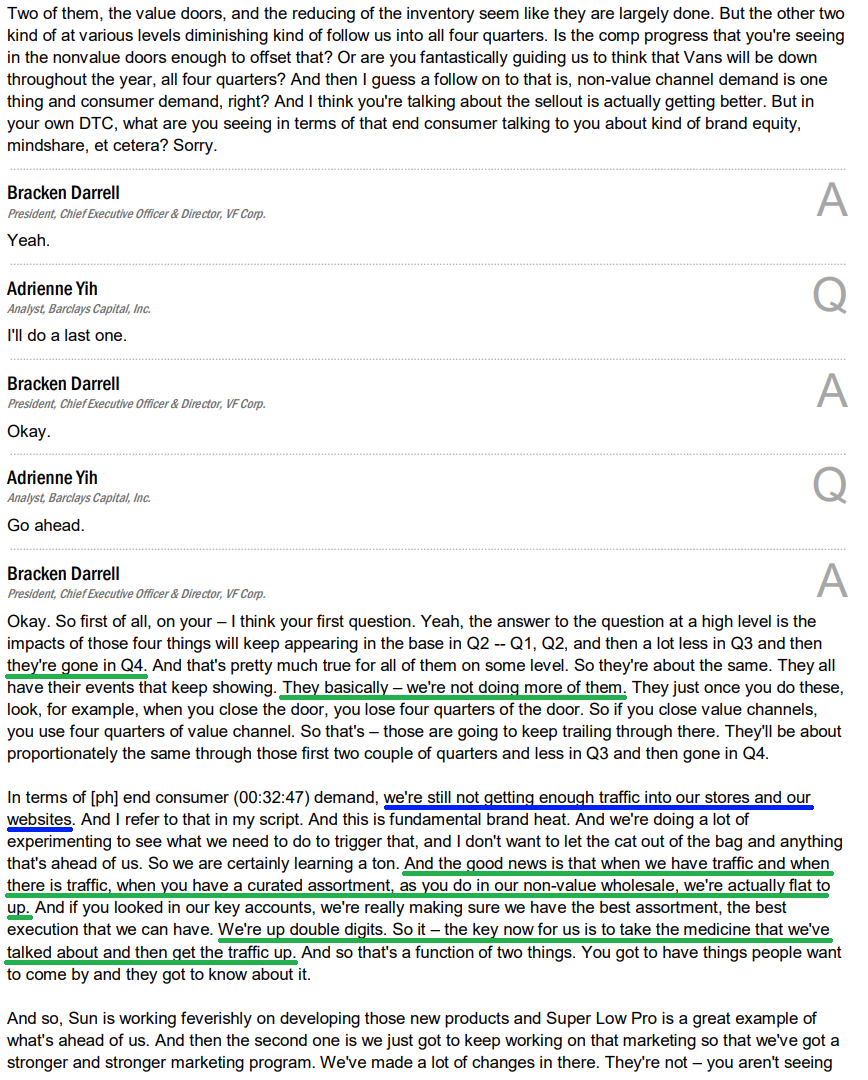
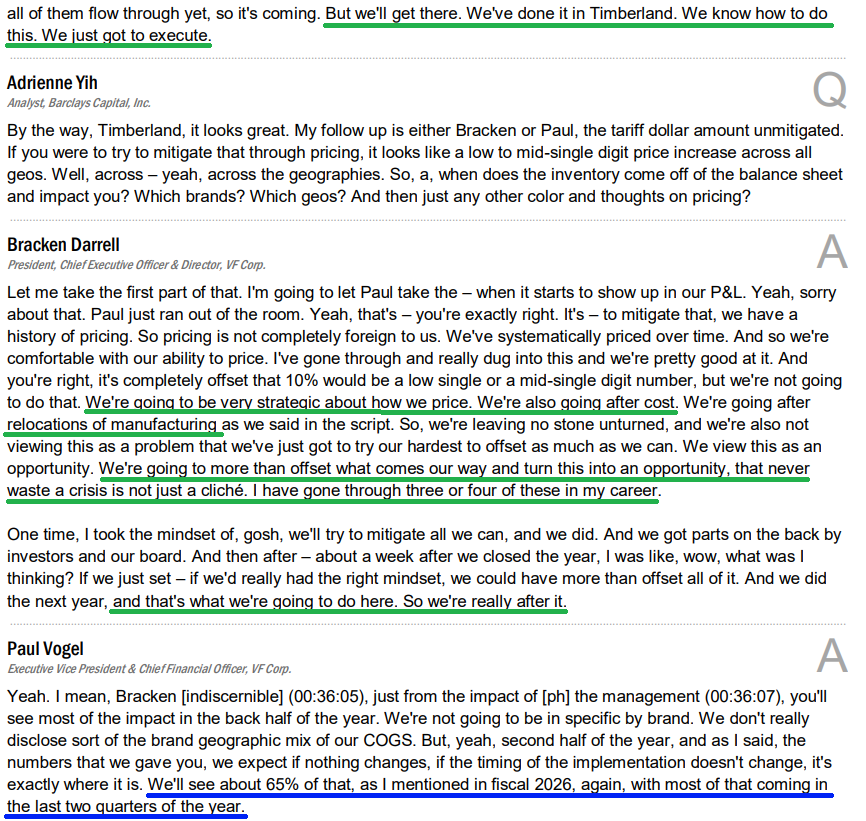
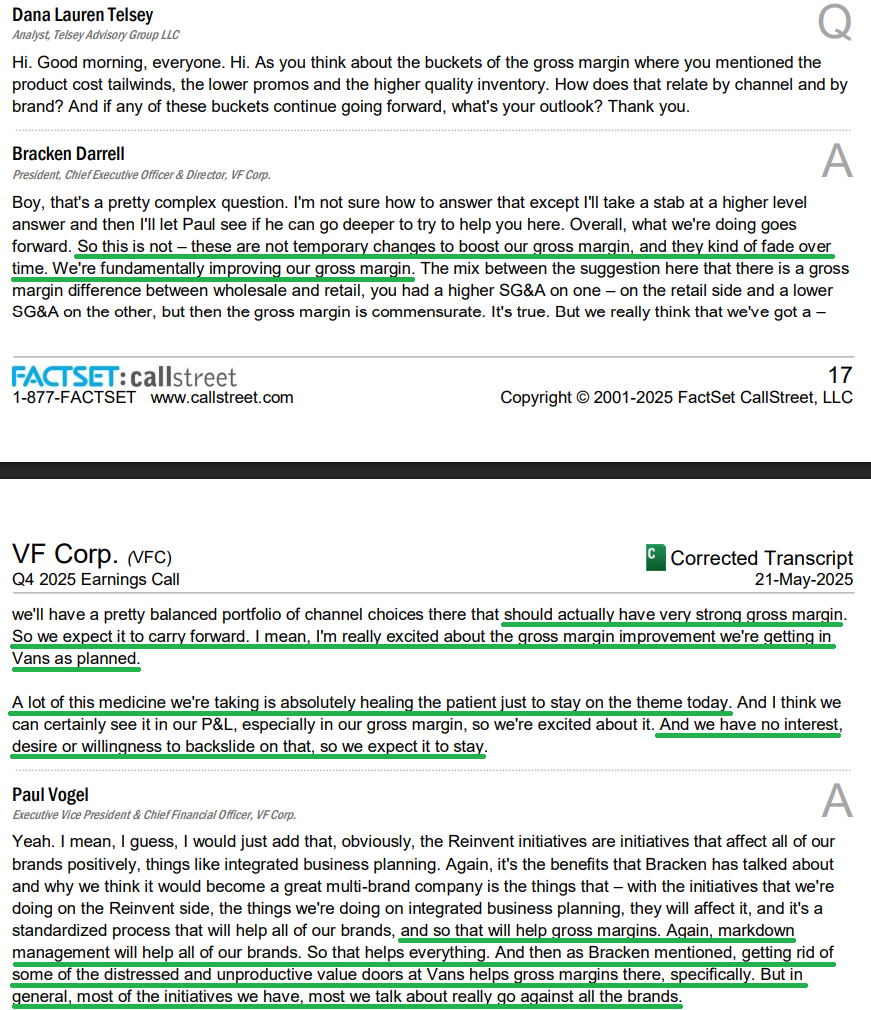
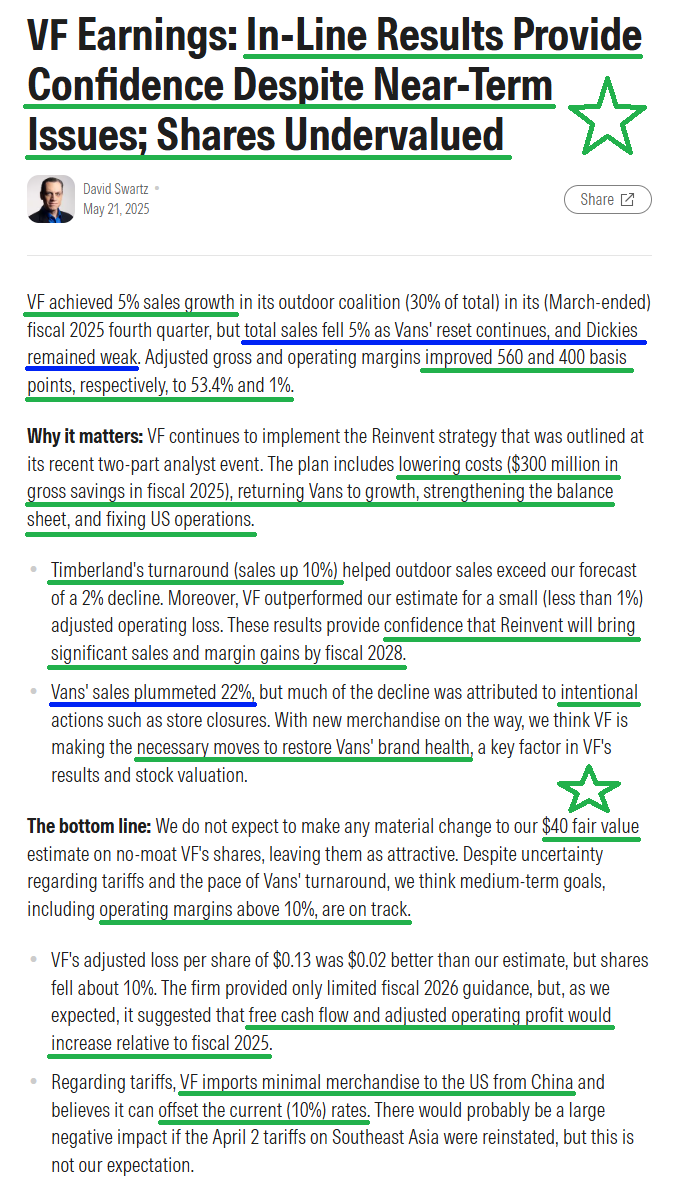
1) Vans Q4 sales declined 20% YoY, compared to an 8% decline in the prior quarter. ~60% of the decline was due to deliberate cleanup efforts — including closing 8% of global Vans stores and reducing exposure to unproductive value channels (35%), along with inventory normalization in China contributing another 25%. These headwinds are expected to fade sequentially and fully lapse by Q4. Adjusted for these actions, revenue would have been down high single digits. More importantly, these efforts drove significant gross margin improvement at Vans.
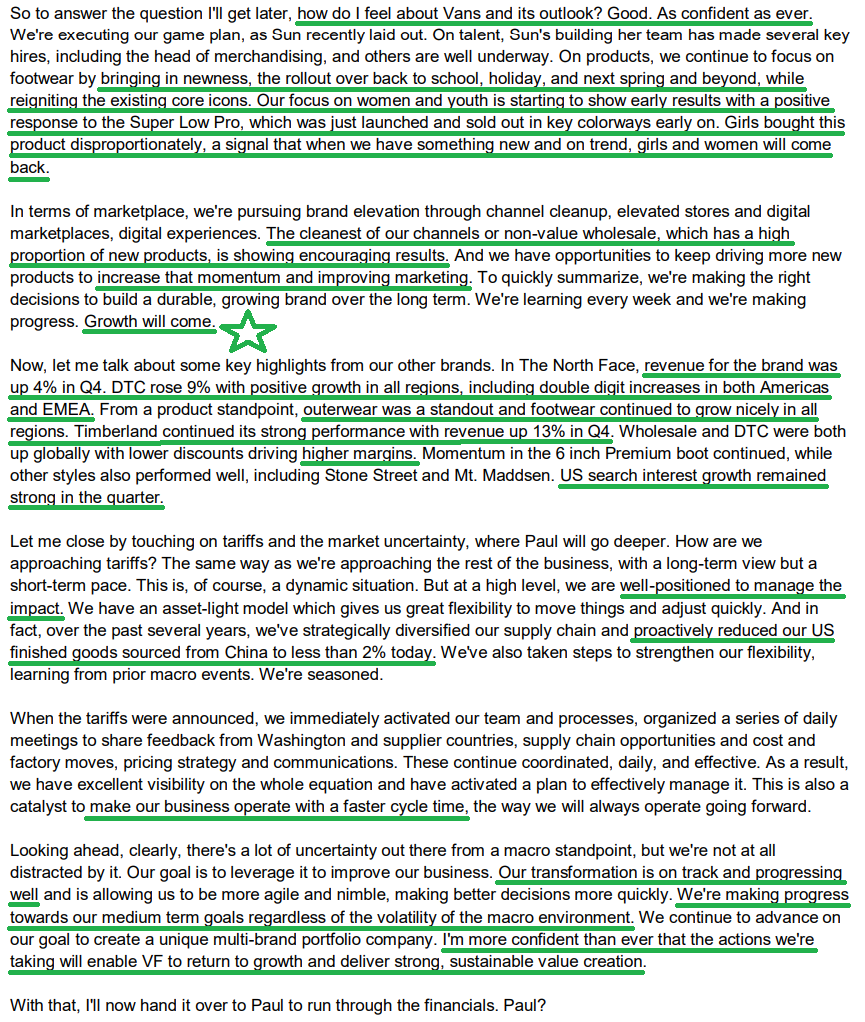
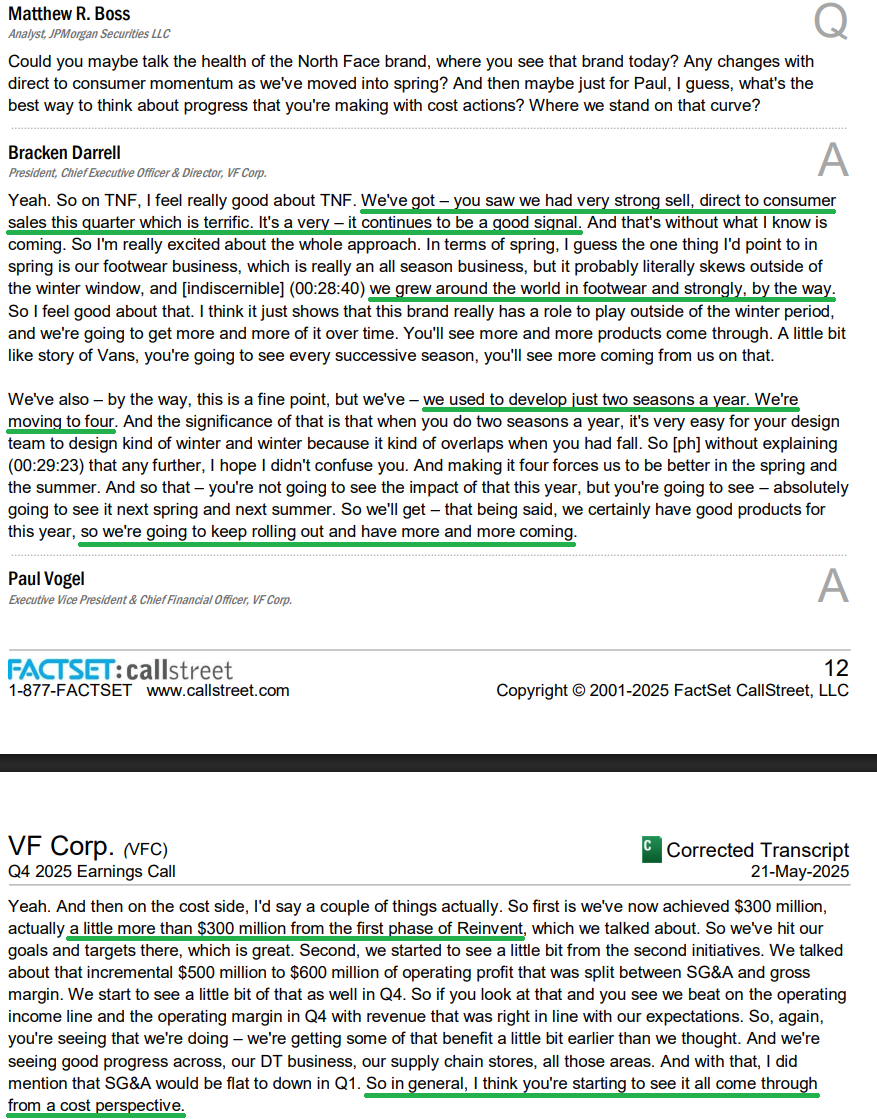
2) The North Face grew revenues 4% YoY in Q4, driven by 9% growth in global DTC. All regions contributed, with double-digit gains in the Americas and EMEA. Outerwear was a standout, while footwear continued to grow across all regions.
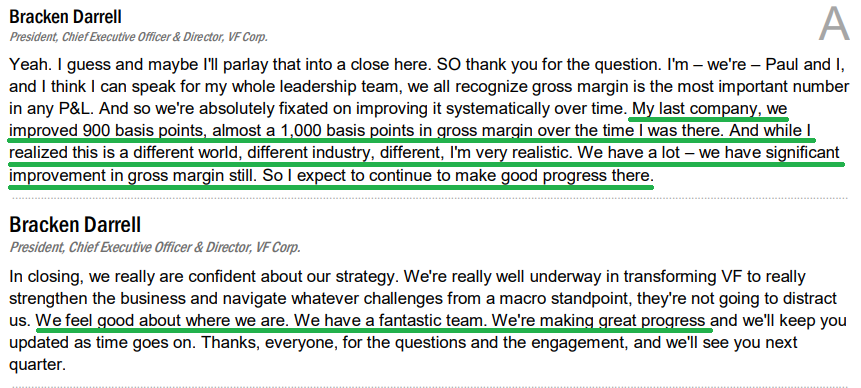
3) Management successfully delivered on the initial $300 million gross cost savings target and remains on track to achieve $500–$600 million in net operating expansion (+10% margins) by FY2028.
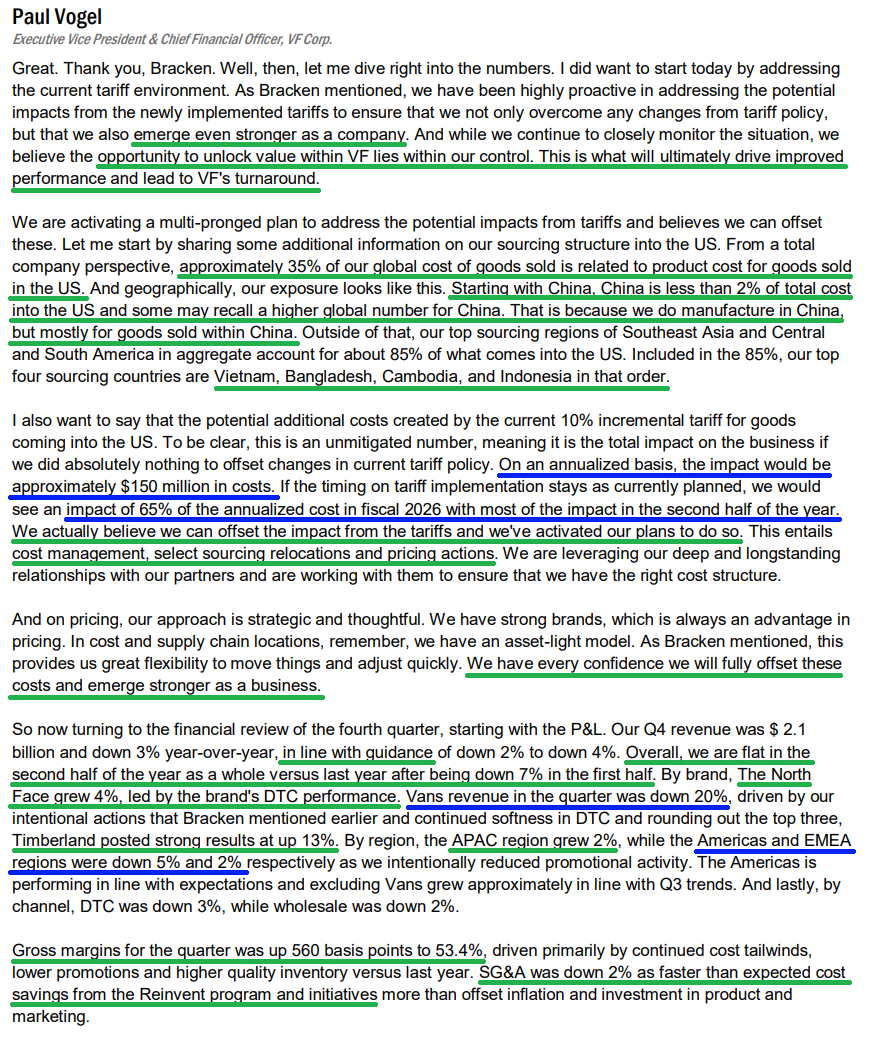
4) In Q4, adjusted gross margins reached 53.4%, up 560 bps YoY, while adjusted operating margins improved by 400 bps YoY.
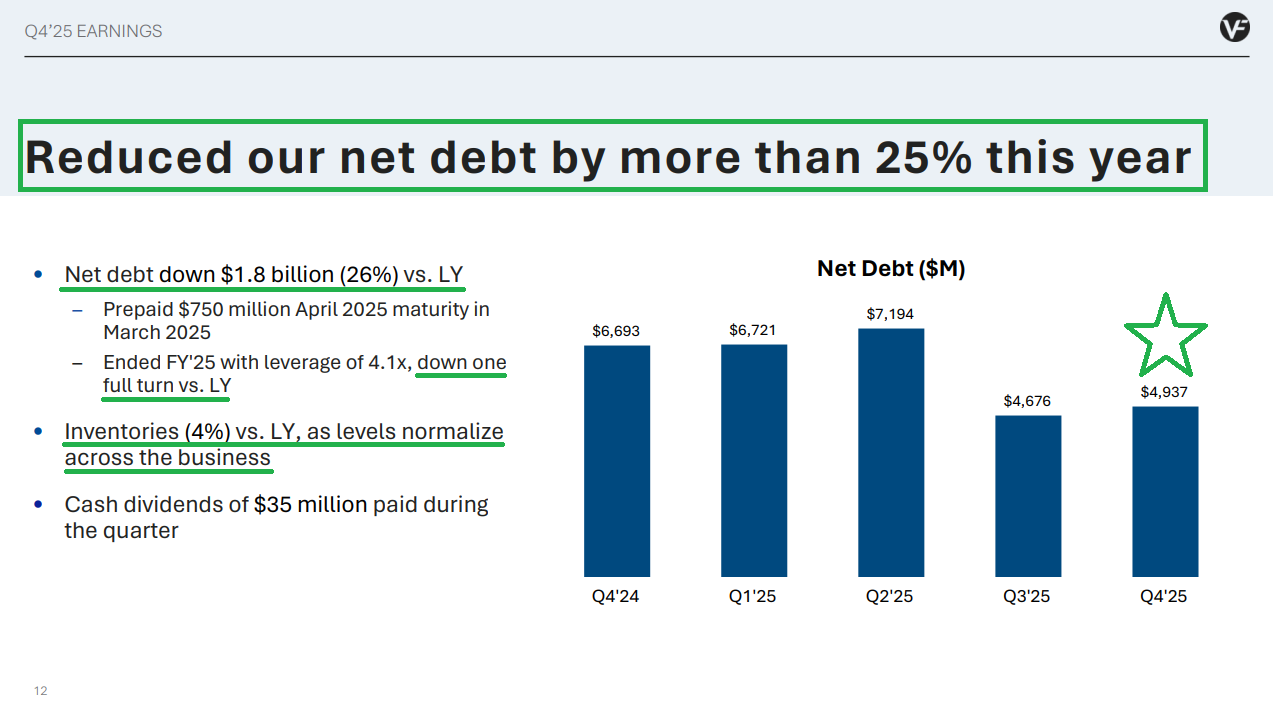
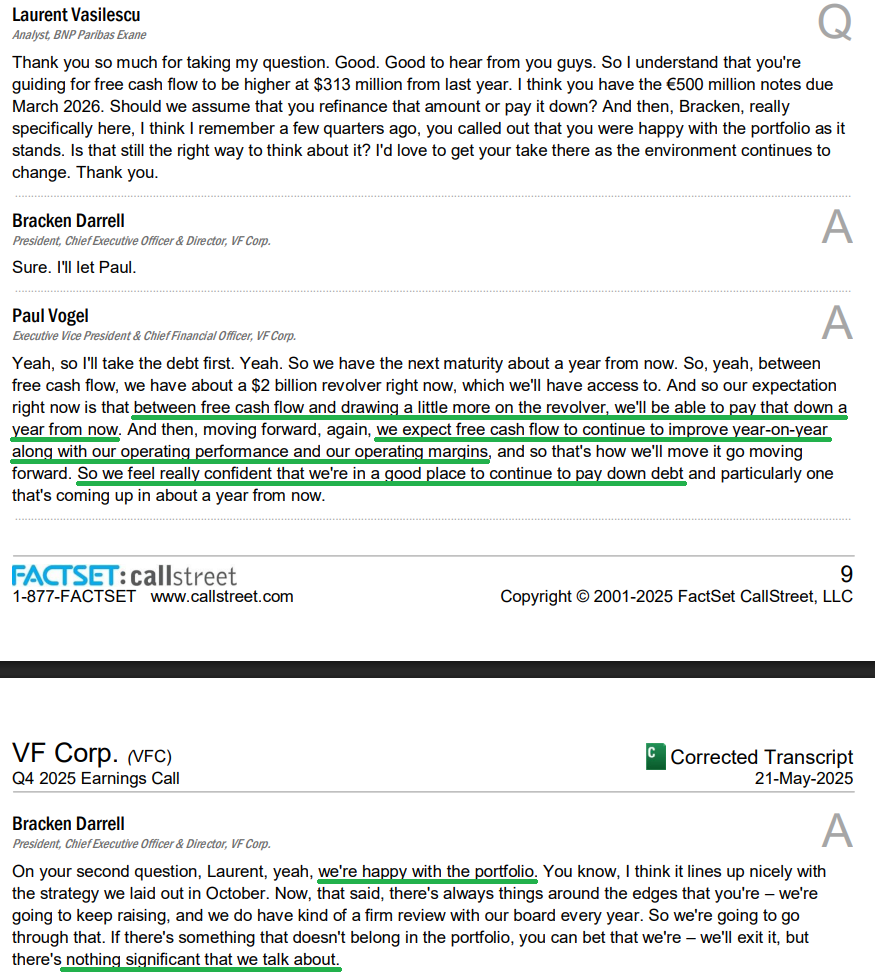
5) Management reduced debt by $1.8 billion during the year, a 26% YoY decline, ending the quarter with 4.1x net leverage—down a full turn—and remains on track to reach 2.5x by FY2028. Net debt now stands at $4.94 billion.
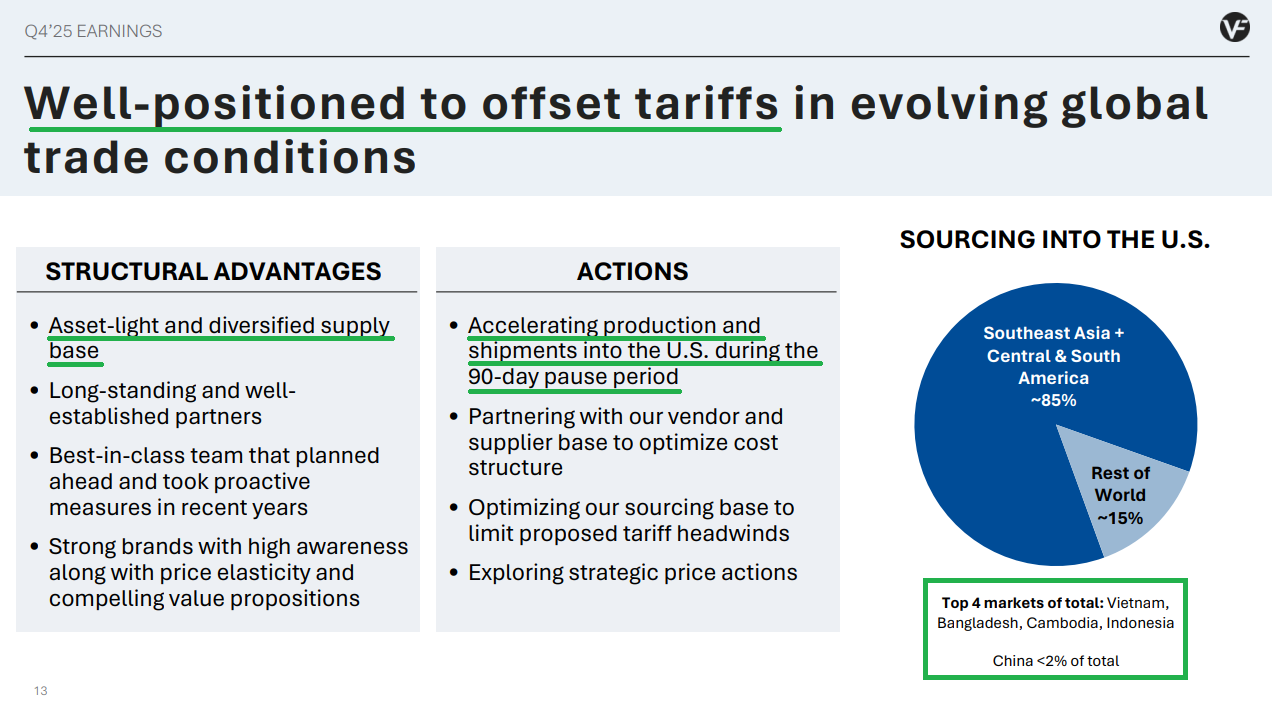
6) Less than 2% of total US imports are sourced from China. Management estimates the annual gross tariff impact at current 10% rates to be about $150 million but expects to fully mitigate this through cost actions and optimized sourcing.
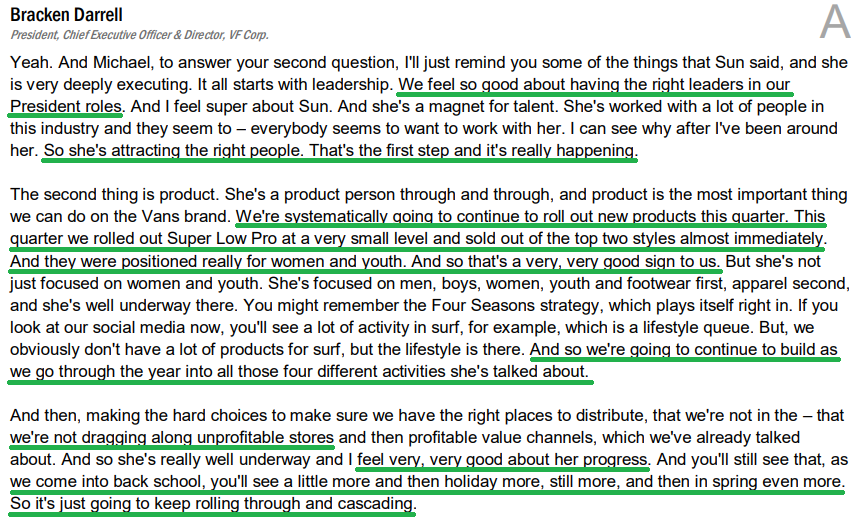
7) New products at Vans continue to see strong demand. The Super Low Pro, launched in Q4, sold out its top two styles almost immediately. Management expects continued momentum throughout the year, with back-to-school and holiday seasons starting to see the influence of new Global Brand President Sun Choe.
8) Timberland’s strength continued with sales up 13% YoY. Strong DTC growth combined with fewer discounts drove significantly higher margins. US search interest also remained strong throughout the quarter.
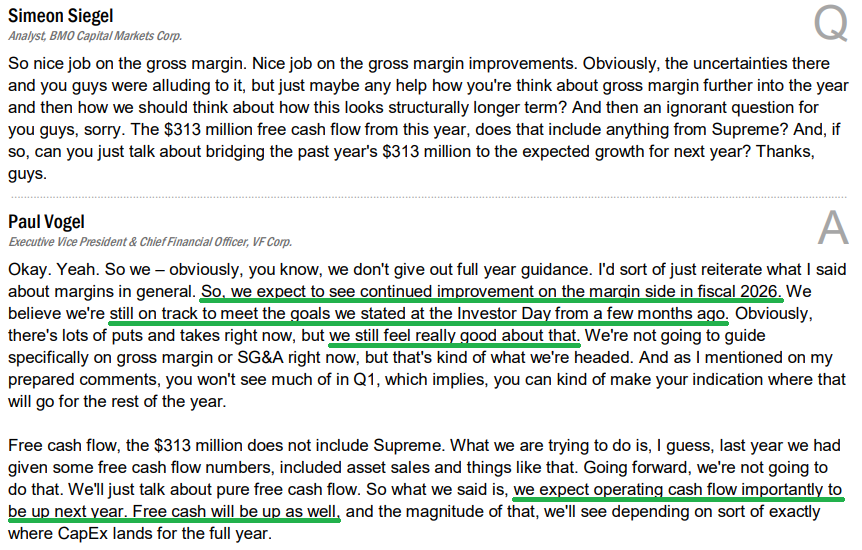
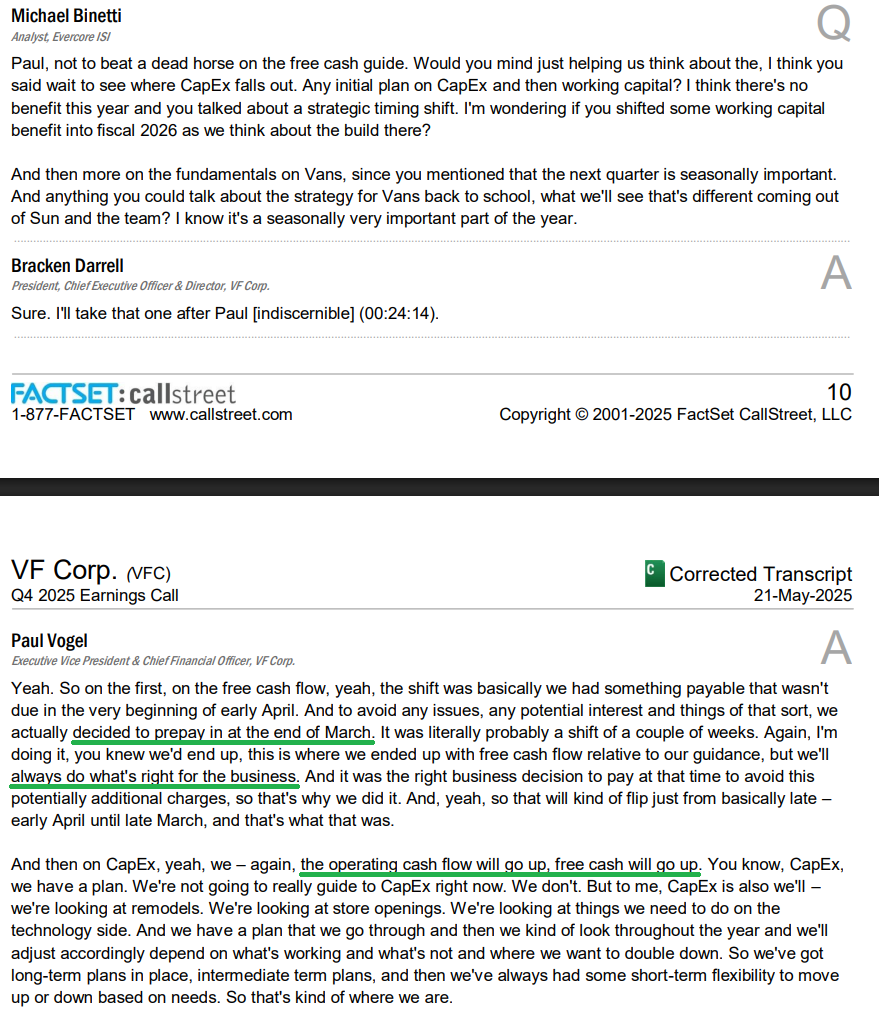
9) For FY2026, management expects free cash flow to improve from FY2025’s $313 million, excluding proceeds from non-core asset sales, while also anticipating full-year operating margin expansion.
10) Inventory reduction continues to progress, down 4% YoY, though it would have been higher during the quarter without accelerated product shipments into the US during the 90-day tariff pause window.
Earnings Call Highlights
Morningstar Analyst Note
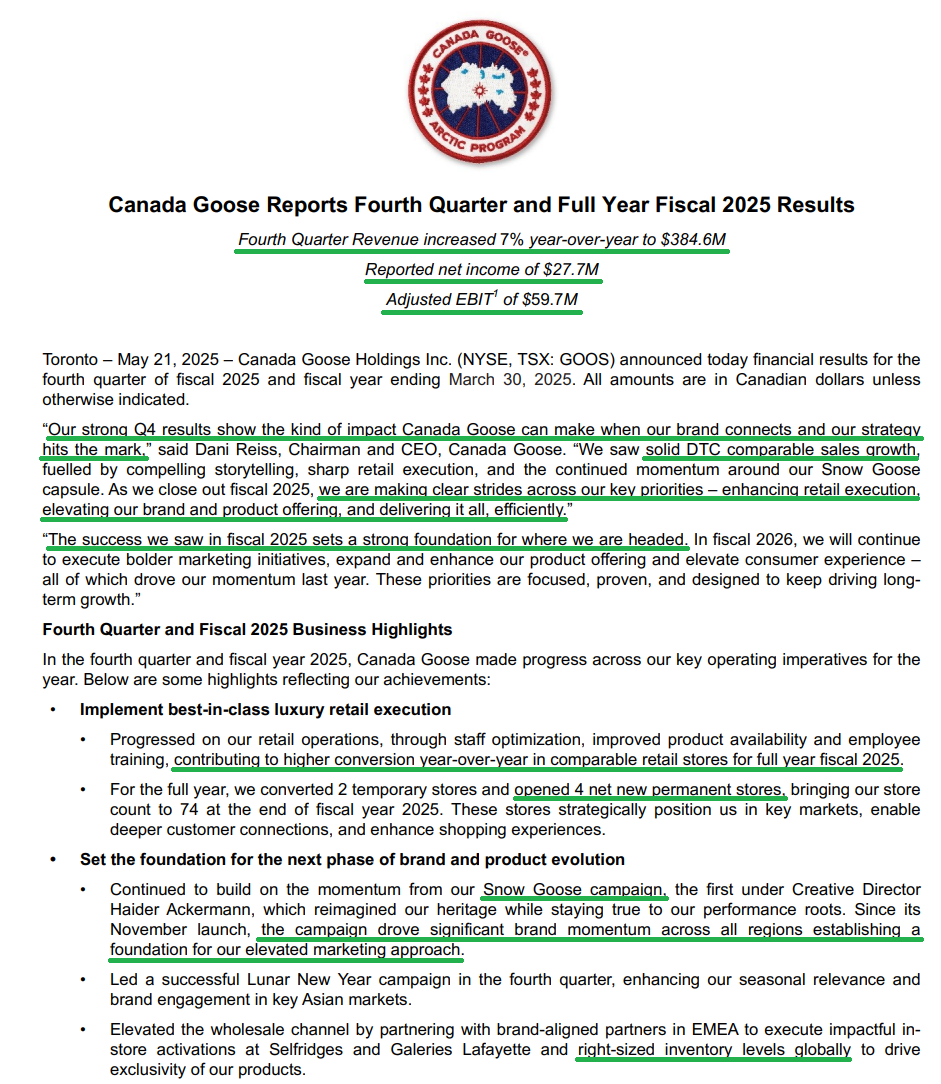
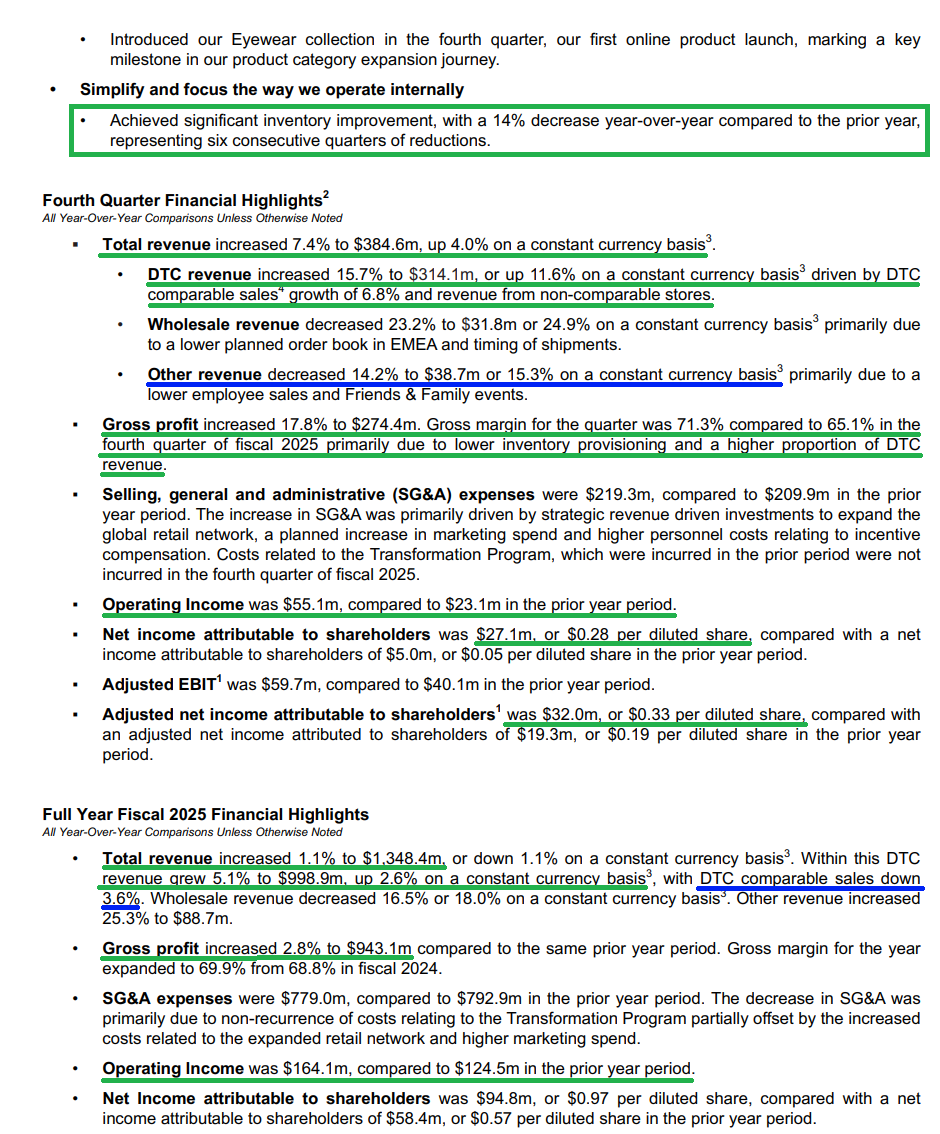
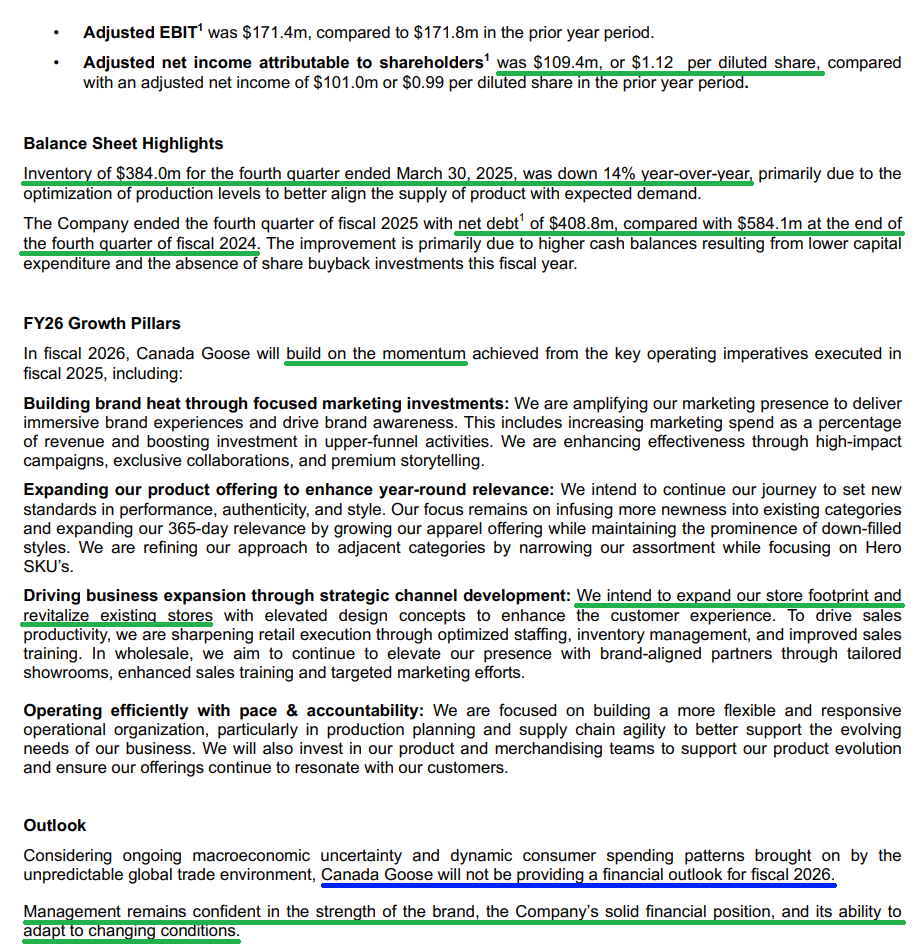
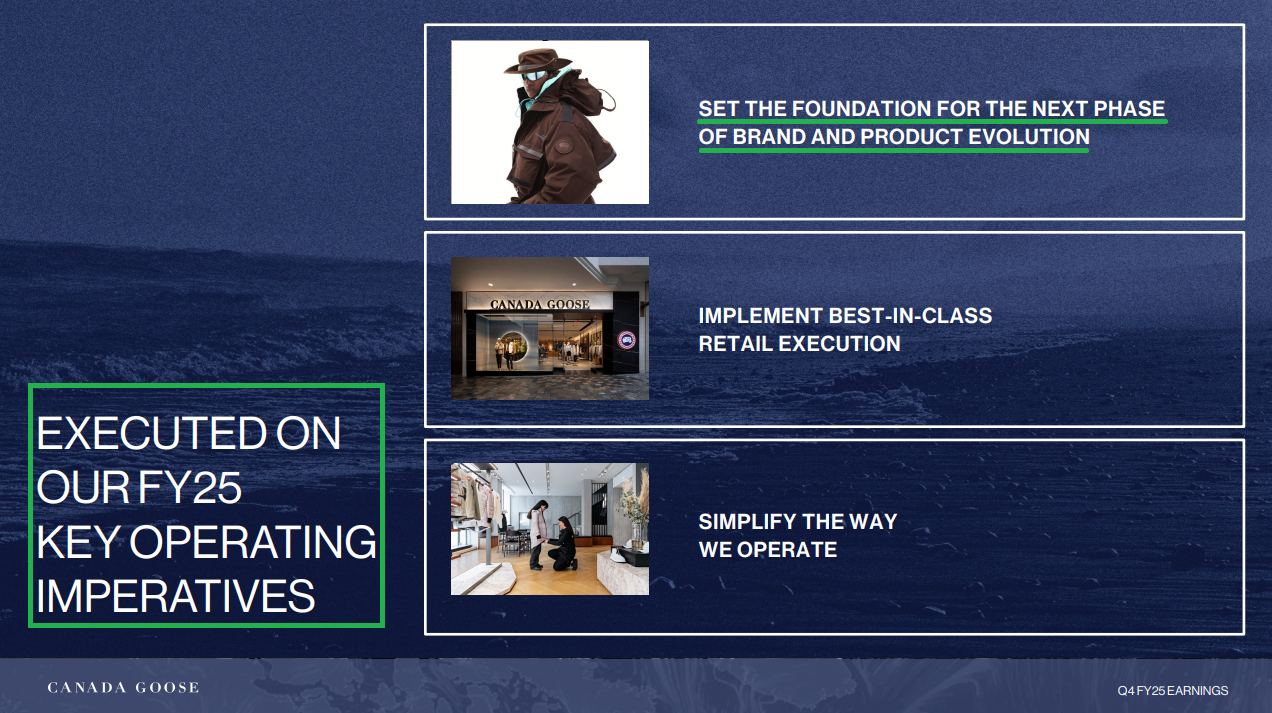
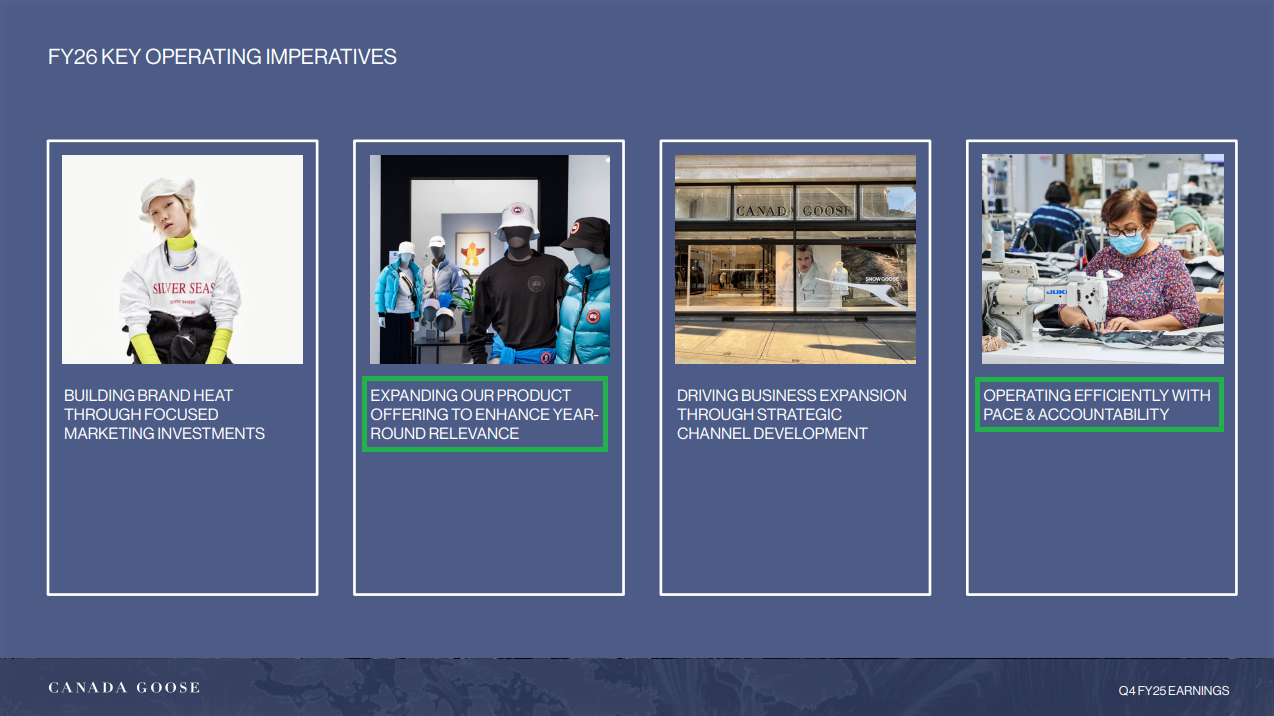
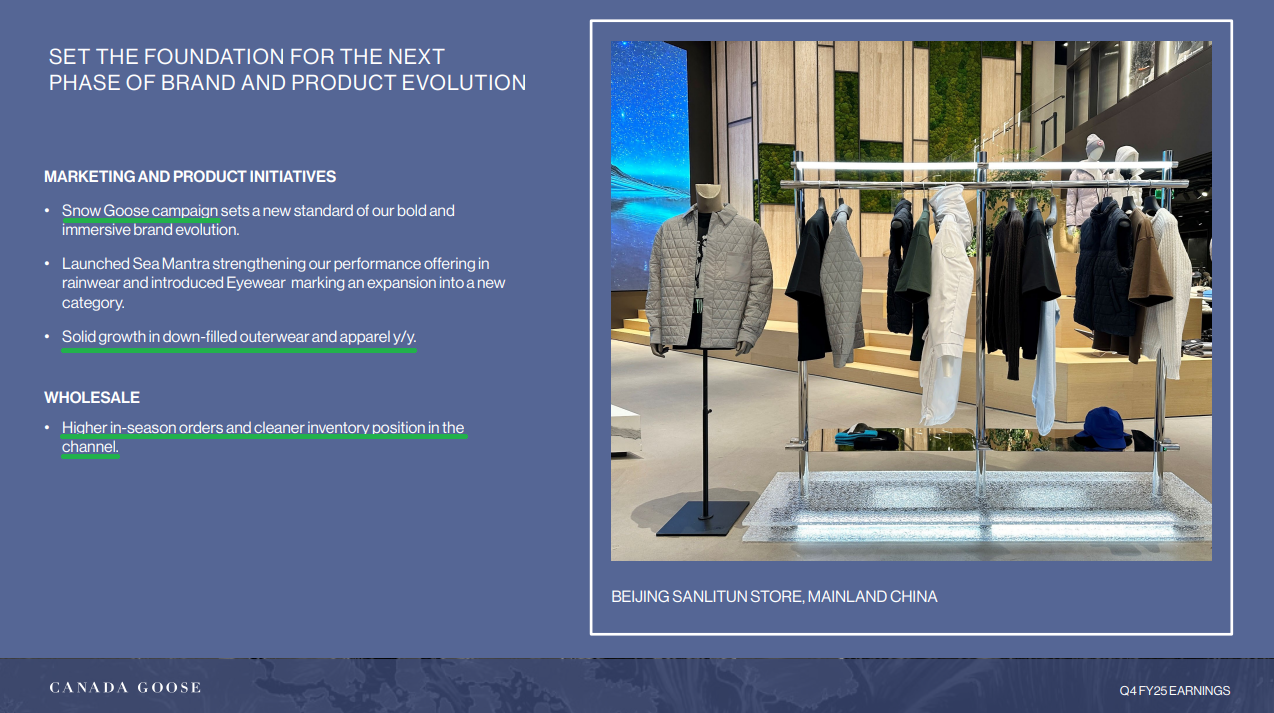
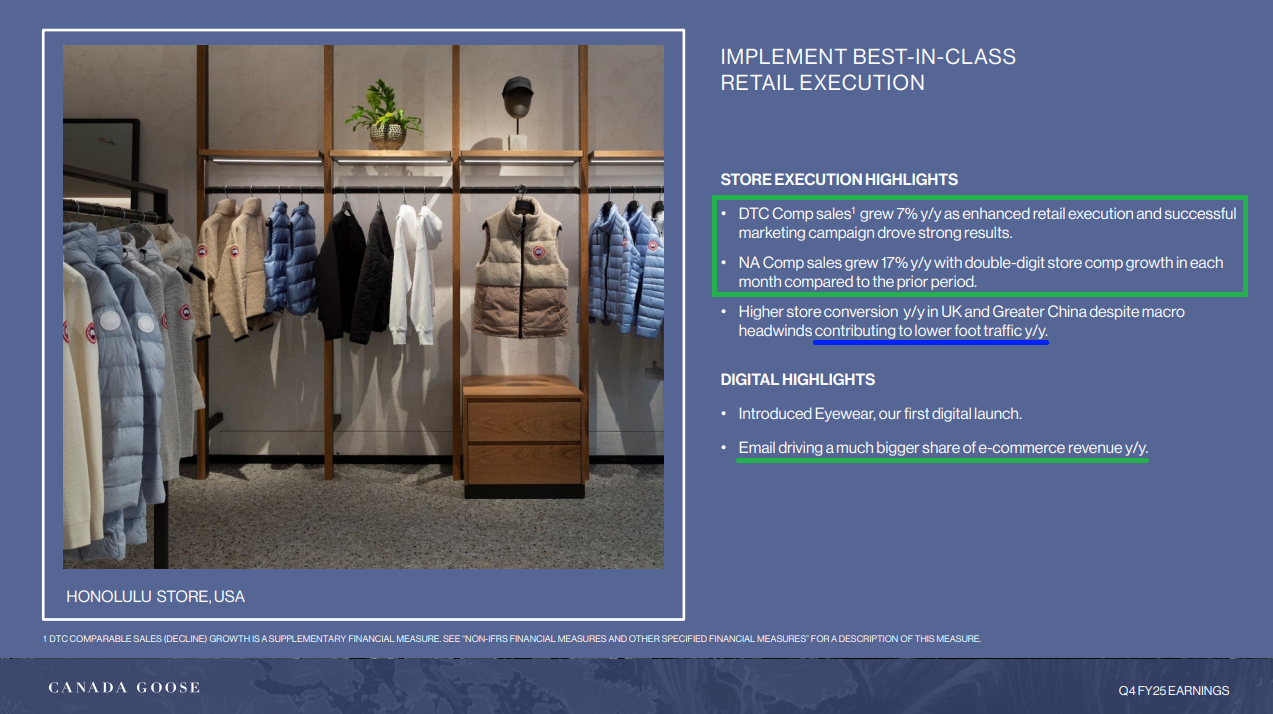
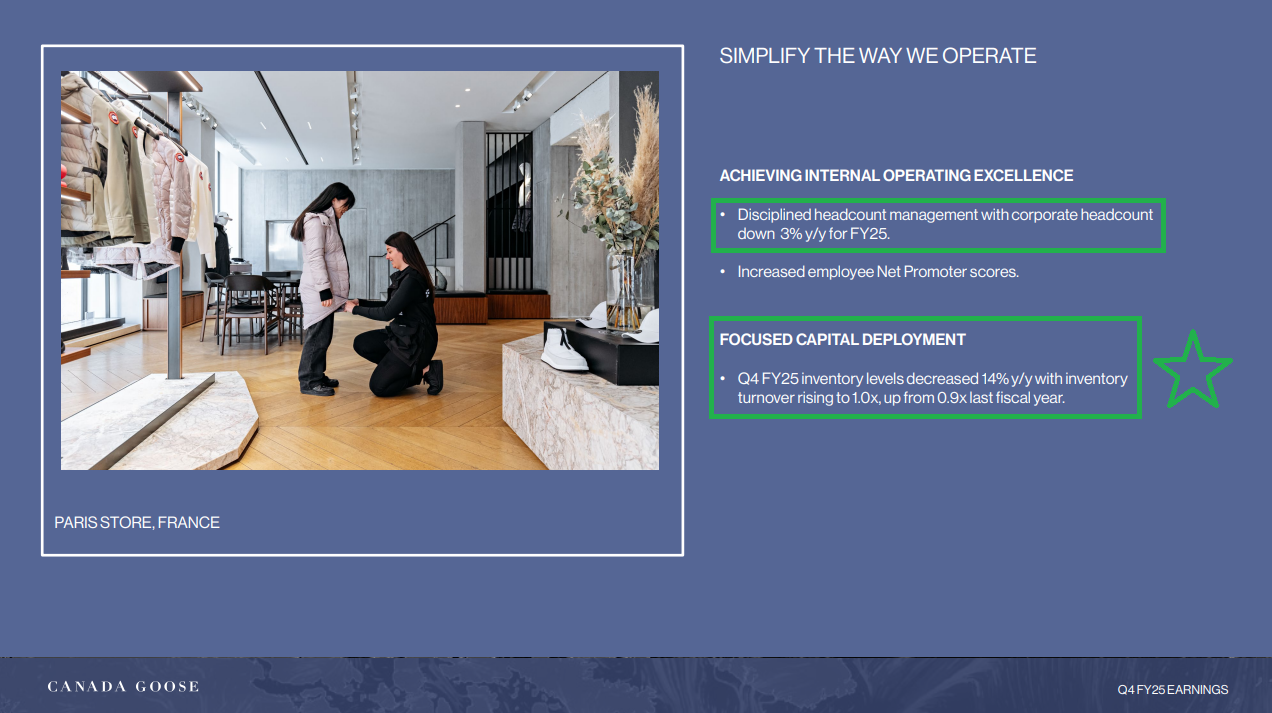
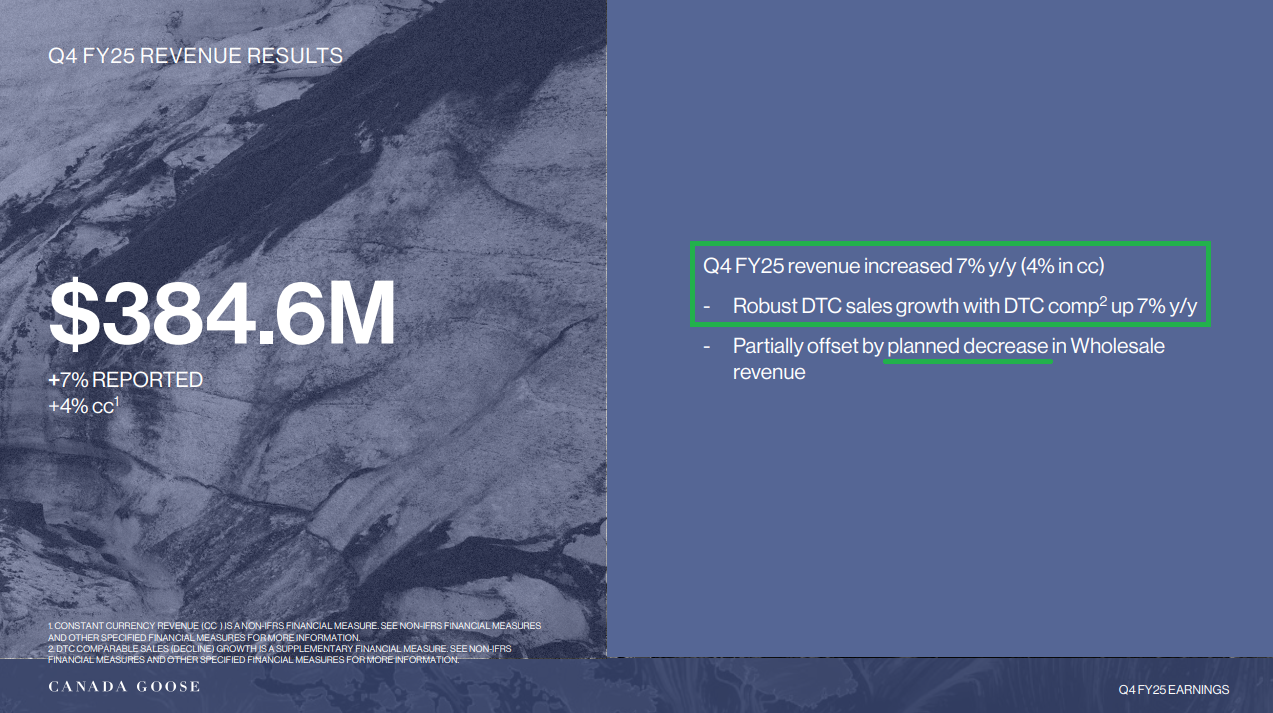
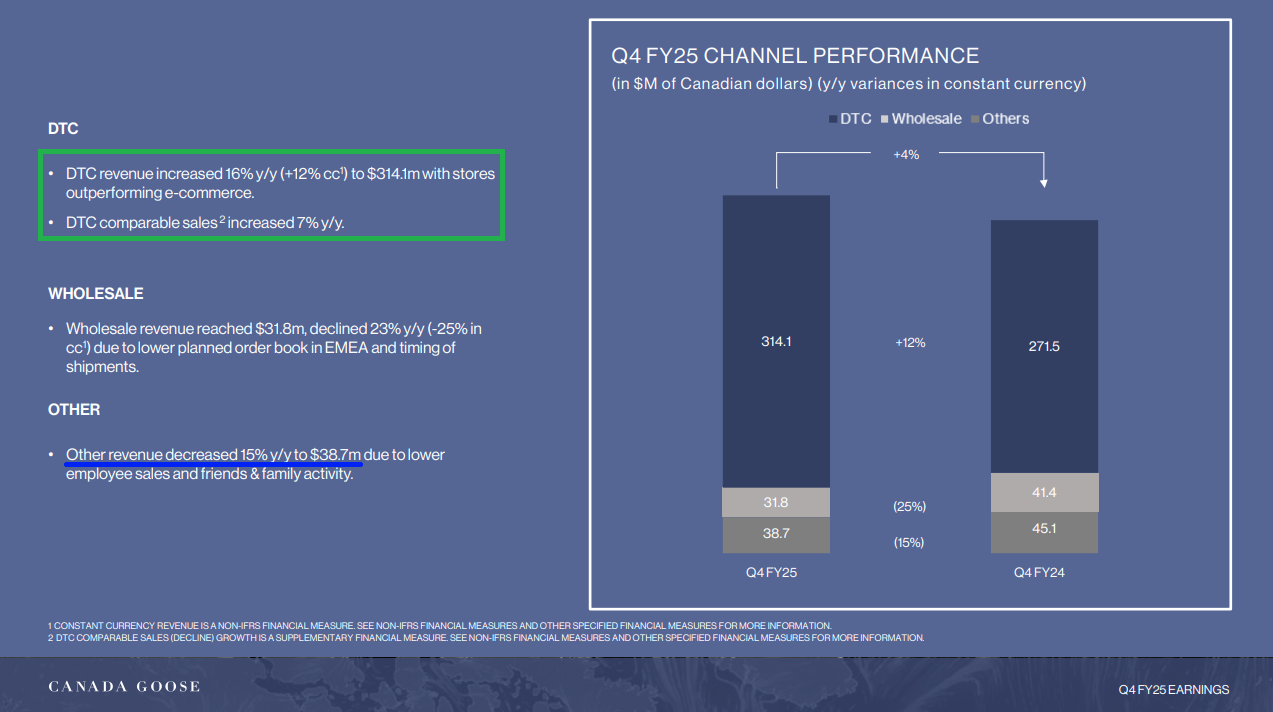
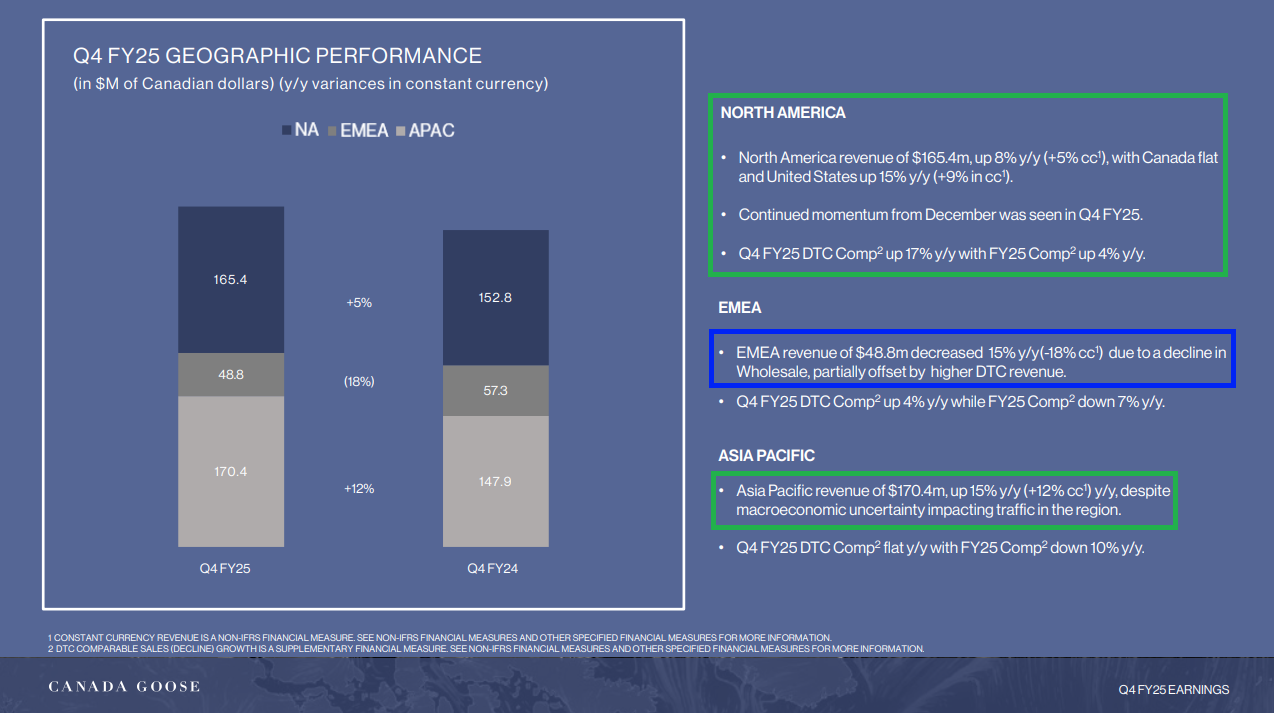
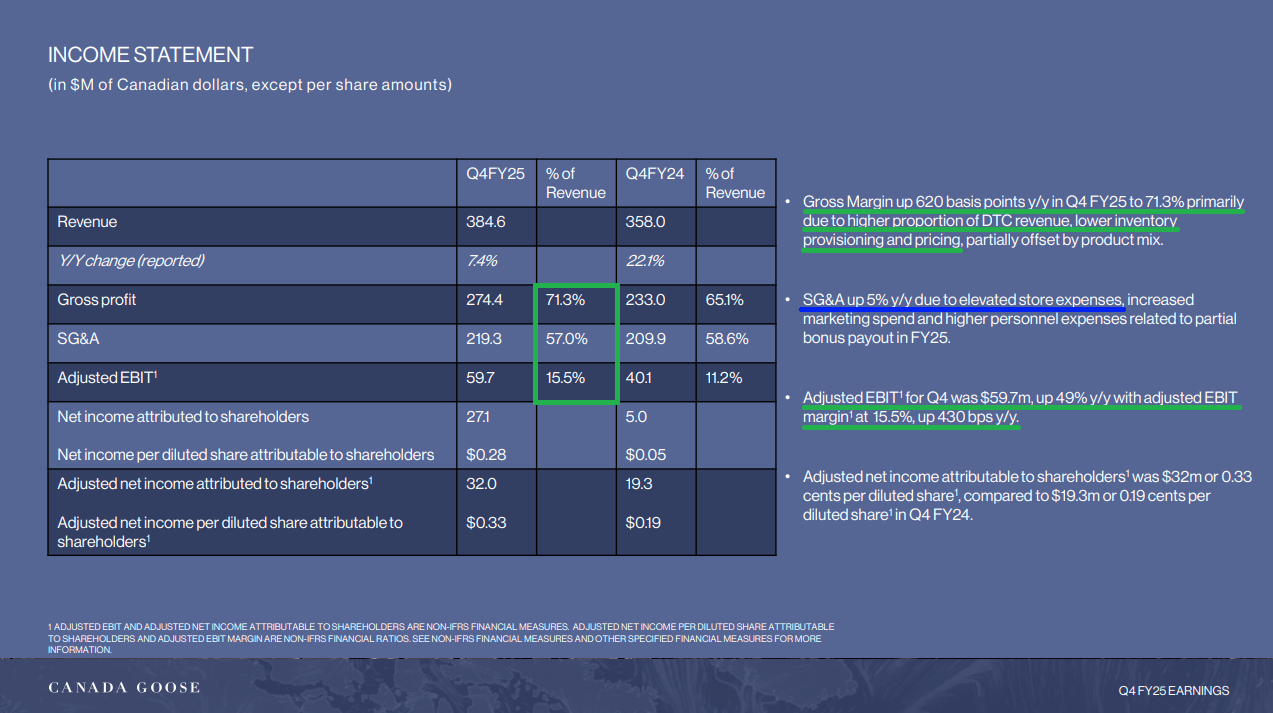
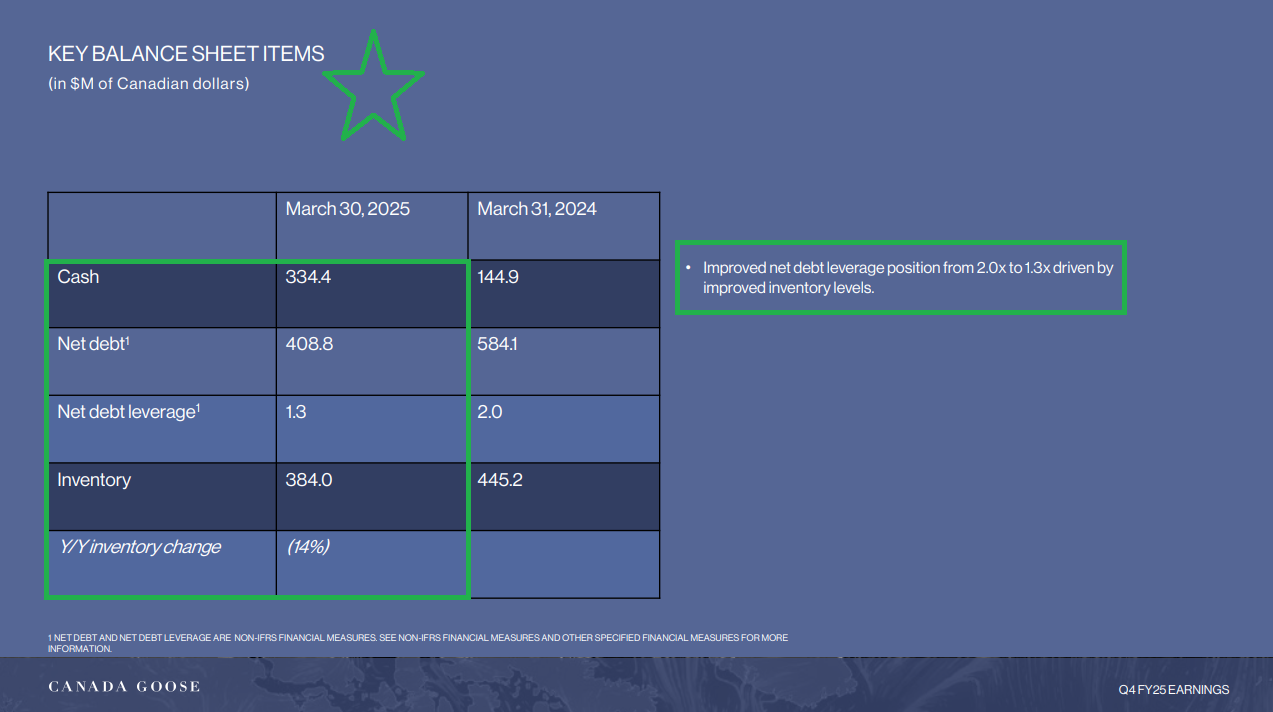
Canada Goose Quick Update
General Market
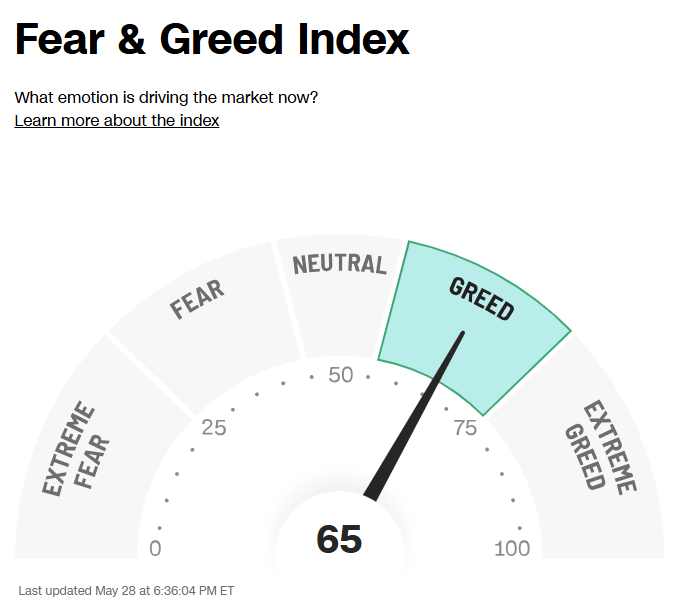
The CNN “Fear and Greed Index” ticked down from 69 last week to 65 this week. You can learn how this indicator is calculated and how it works here: (Video Explanation)
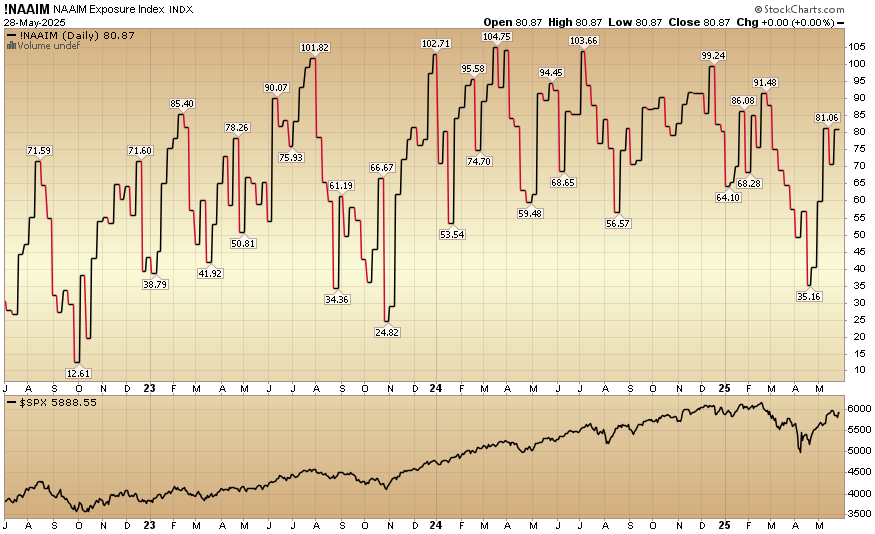
The NAAIM (National Association of Active Investment Managers Index) (Video Explanation) ticked up to 80.87% this week from 70.56% equity exposure last week.
Our podcast|videocast will be out sometime today. We have a lot of great data to cover this week. Each week, we have a segment called “Ask Me Anything (AMA)” where we answer questions sent in by our audience. If you have a question for this week’s episode, please send it in at the contact form here.
*Opinion, Not Advice. See Terms
Not a solicitation.

