
General Market Overview
Thanks to Liz Claman, Kathryn Meyers and Jake Mack for having me on Fox Business – The Claman Countdown – on Tuesday. I joined Jon Najarian – who will be a special guest on our podcast|videocast tonight. Watch here for my outlook and a turnaround pick:
Watch in HD directly on Fox Business
Here were my notes ahead of the segment:
We covered VFC (along with PYPL) in greater detail last week:
Remember this clip from Charles Payne on October 16?
Here’s what has happened to earnings since:
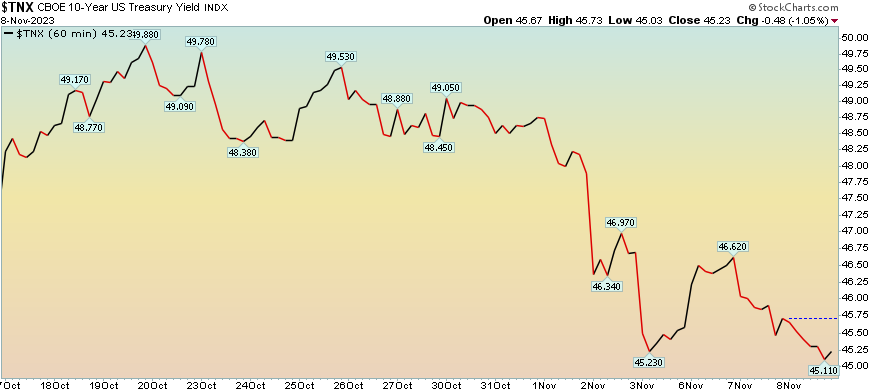
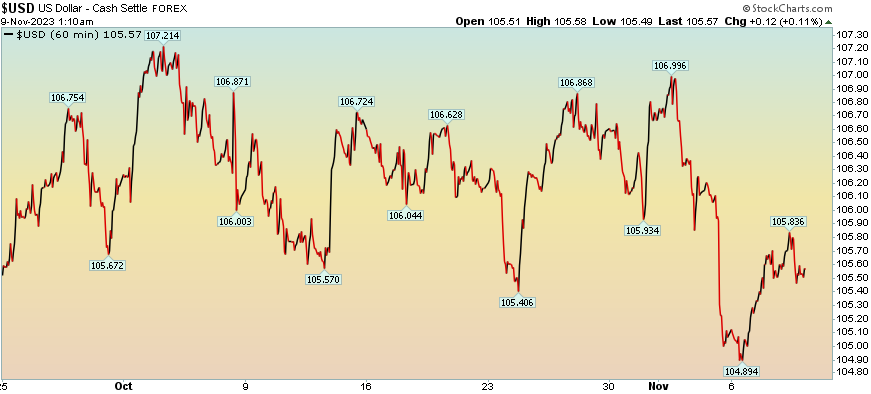
Here’s what has happened to the 10yr yield and the US Dollar since Oct 16:
Watch the CEO of Mondelez (OREO producer) quantify the WORST CASE SCENARIO of GLP-1 Weight Loss Drugs:
Short Term: No Effect
Long Term: Worst Case (7-14% US population using weight-loss drugs) with maximum adoption = potential 1/2 – 1% in volume reduction after 10 years. That is assuming this does not become a major issue (among other known/unknown side-effects).
Zweig Breadth Thrust
The market achieved a “Zweig Breadth Thrust” on Friday. The ZBT is calculated using the 10-day exponential moving average (EMA) of the ratio of advancing issues to the sum of advancing and declining issues on the New York Stock Exchange (NYSE).
The indicator generates a buy signal when it moves from a level below 0.40 (40%) to a level above 0.615 (61.5%) within a 10-day period.
There have been only 17 previous signals since WWII. The average 12 month return following a breadth thrust is 23.3%.
Side note from Jay Kaeppel (Sentiment Trader): 2nd signals that occurred within 18 months of previous signal have done even better than the average (avg. +26.8% 12 months later).
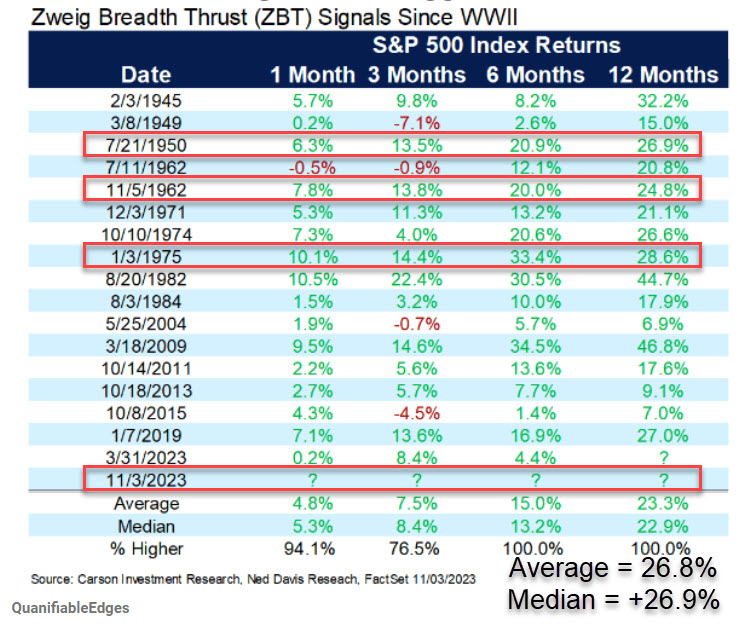 Source: Carson + Others listed on image.
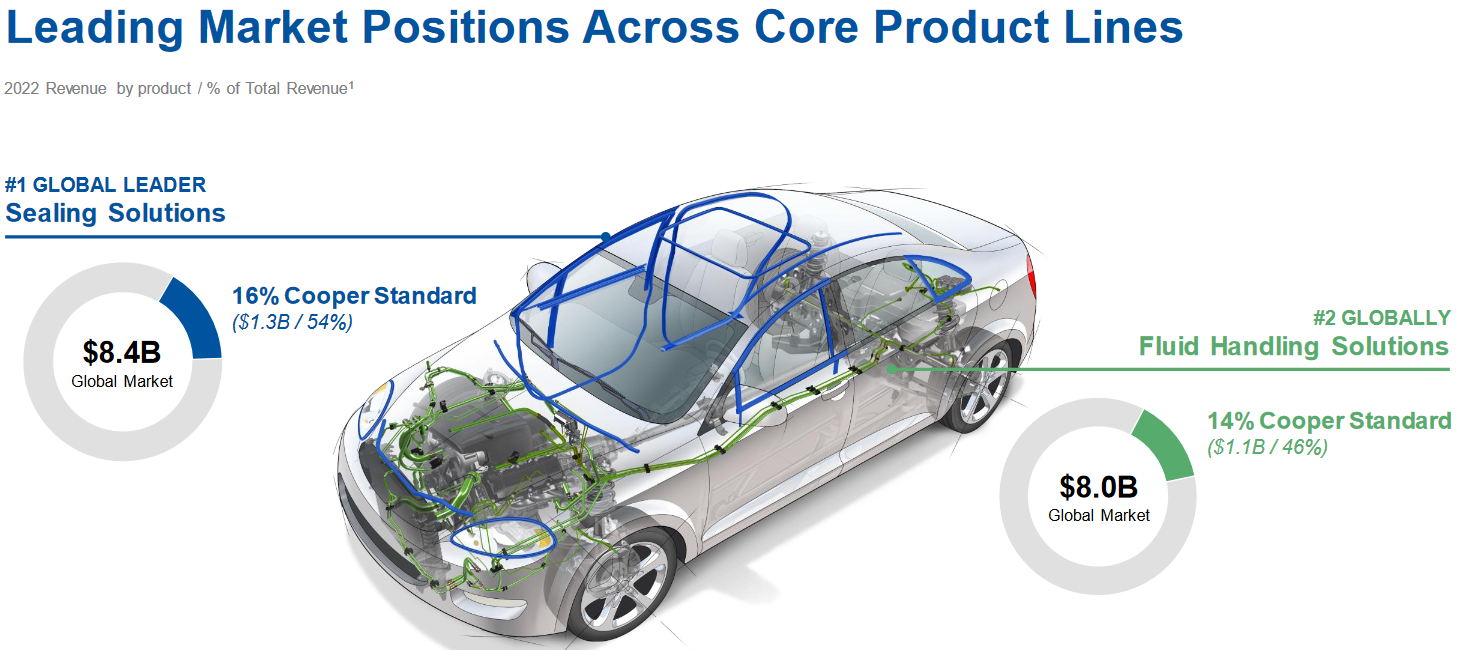
Cooper Standard Update
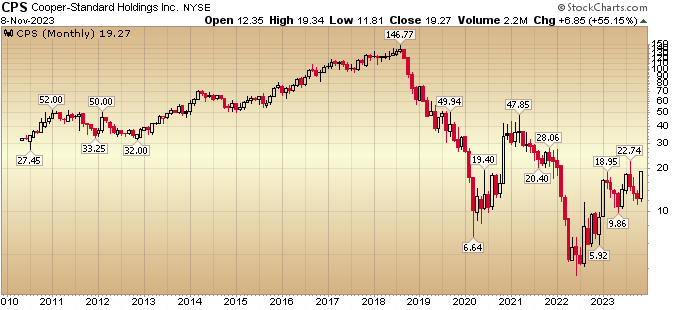 Cooper Standard continues to climb on above average daily volume. Since we put it out publicly on the podcast|videocast in May 2022 and on Fox Business with Liz Claman in June 7, 2022 – it us up > 3x (> 200%). We believe the move is just getting started. Clip from Claman Countdown (Fox Business) on June 7, 2022:
I followed up on the thesis publicly on December 28, 2022:
And again on July 18, 2023 on Yahoo! Finance. It’s very important to watch this clip as it relates to our expectations moving forward. It will also make the post below the video (from this weekend) make more sense:
New car volume expansion just beginning as OEM incentives now rolling. Hard to buy a used car at 9-11% financing when new car payment much lower despite higher sticker. Helps new car OEM auto suppliers like $CPS that are a leveraged play on volume recovery. Avg. car > 13yrs old. pic.twitter.com/CdshzqRr5F
— Thomas J. Hayes (@HedgeFundTips) November 5, 2023
Here is some information from our original thesis and updates:
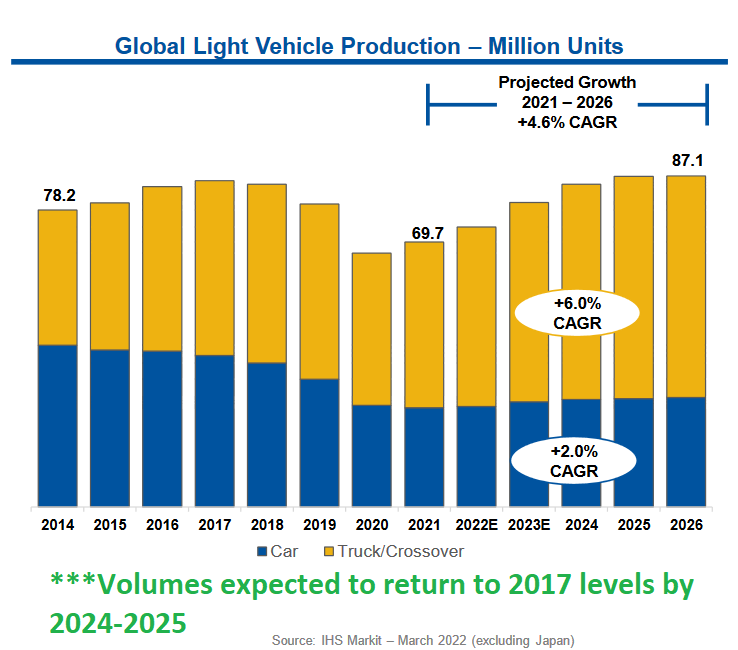
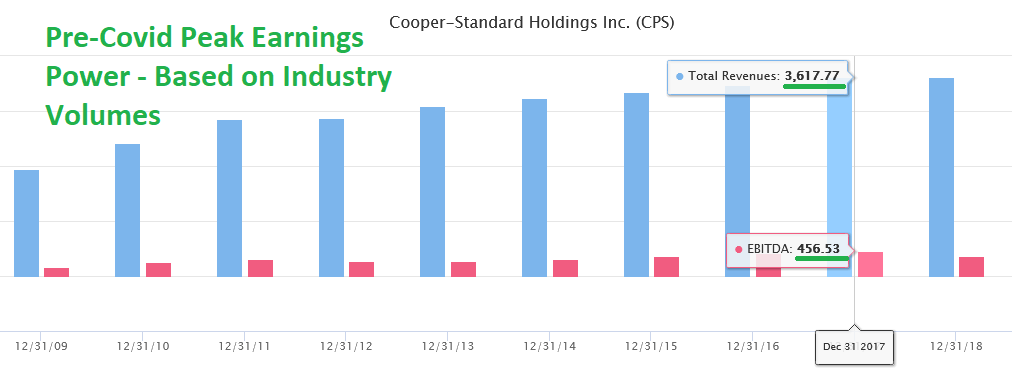
The most important table is the one above with the IHS estimates of Global Light Vehicle production. The key takeaway is that volumes are expected to return to 2017 levels by 2024 or 2025.
Here’s what Cooper Standard achieved in 2017:
$3.62B Revenues
$452M Adj. EBITDA (12.5% of revs)
$135M Net Income (3.73% of revs) ~18.78M fully diluted shares = ($7.21/share EPS)
Peak stock price on $7.21/share EPS was $146.78 (August 3, 2018) = ~20x P/E multiple.
Here’s what Cooper could achieve in 2024-2025 IF INDUSTRY VOLUMES MEET EXPECTATIONS AND RETURN TO NEAR 2017 LEVELS:
$3.3B Revenues (Anti-Vibration unit sold. $320M revenue 2017)
$412M Adj. EBITDA (12.5% of revs)
$123M Net Income (3.73% of revs) ~17.16M fully diluted shares = ($7.19/share EPS).
At 10x P/E = $71.90. At 2017 peak multiple = $146.37. Cut both in half and you’re still at a 5-10x+ bagger.
BUT, you say, EPS will be effected by increased interest expense. THAT IS CORRECT. Interest expense in 2017 was $42M, but TAXES were $74M. While the Interest expense in 2024 or 2025 will be ~$100M (assuming they don’t refinance at lower rates in coming year(s)), keep in mind they have $130MM in Deferred Tax Assets. They will just be moving into profitability and will be able to use a significant portion of that asset to dramatically reduce their cash tax obligation. In effect, it’s possible that EPS in 2024 or 2025 could be a tick higher than 2017 on the same volumes. The key will be what multiple is assigned (peak or trough)?
As I have said numerous times on our podcast|videocast there are 3 key reasons I bought ownership in the company: 1) management respects equity (they have brought share count DOWN over the years), 2) management comp is tied to ROIC (return on invested capital) 3) the operating leverage in this business is unparalleled coming out of industry troughs.
*Past performance is no guarantee of future results. See “terms” above.
What’s NEW?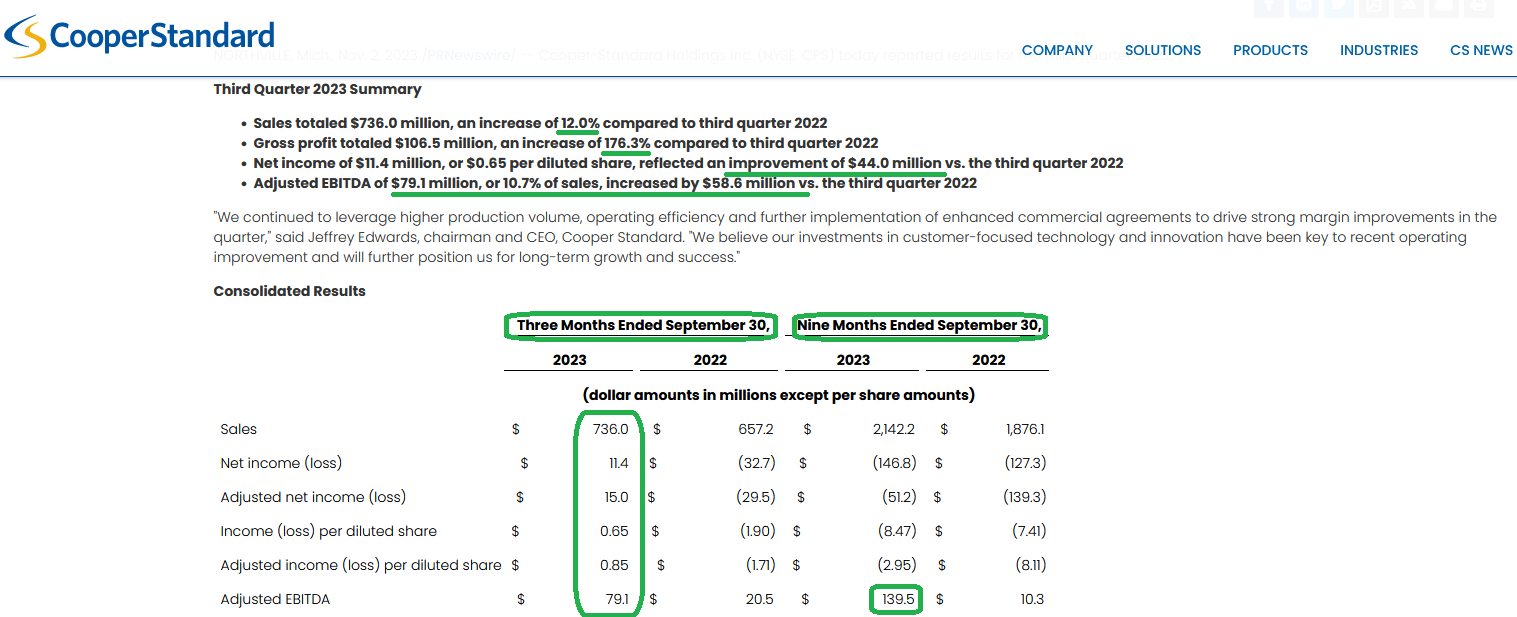


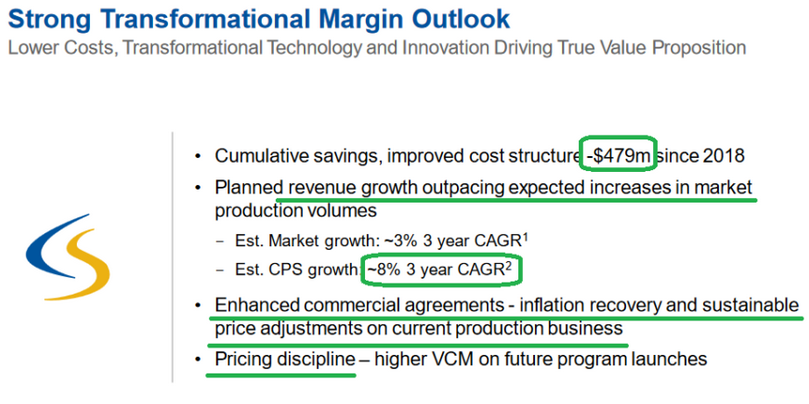
This last slide is the most important. While there is low estimated market growth, they also have conservative revenue growth for the company at 8% CAGR. An 8% CAGR implies $3.15B of top-line revenue in 2025 and $3.4B in 2026. This puts us right in line with our original thesis from last year:
“$3.3B Revenues (Anti-Vibration unit sold. $320M revenue 2017)
$412M Adj. EBITDA (12.5% of revs)
$123M Net Income (3.73% of revs) ~17.16M fully diluted shares = ($7.19/share EPS).
At 10x P/E = $71.90. At 2017 peak multiple = $146.37. Cut both in half and you’re still at a 5-10x+ bagger.”
KEEP IN MIND OUR ORIGINAL THESIS IS PREDICATED ON 2017 MARGINS. AS YOU CAN SEE THEY HAVE TAKEN OUT MEANINGFUL COSTS IN THE LAST FEW YEARS (AND INCREASED PRICING) WHICH MEANS OUR BOTTOM LINE TARGETS COULD BE EXCEEDED OR REACHED EARLIER THAN ANTICIPATED. Time will tell…
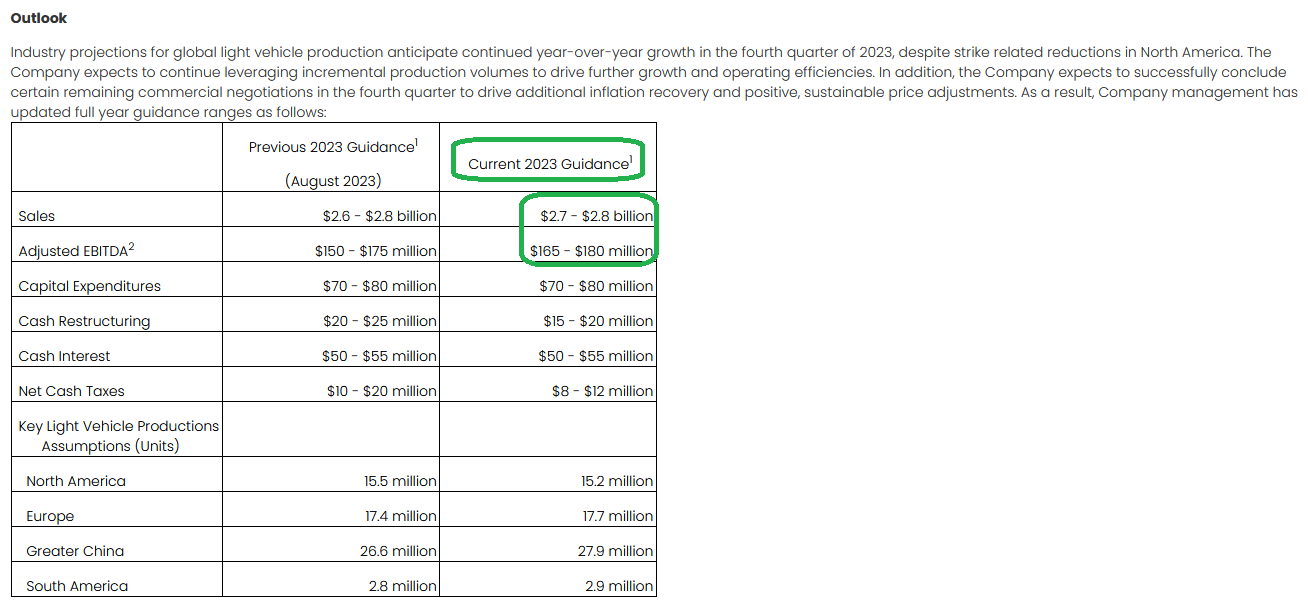
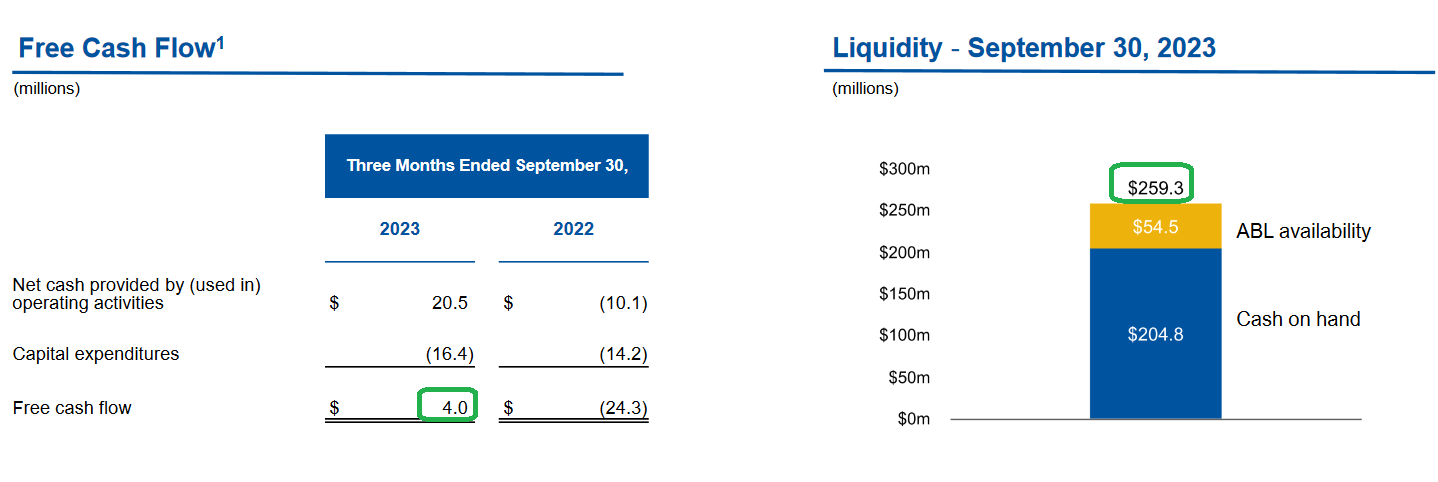
Highlights from Friday’s Earnings Call:
Earnings Hopping:
Here are some other companies we have discussed on the podcast|videocast in recent weeks and months and how they did this quarter:
Some Highlights From These Earnings Calls:
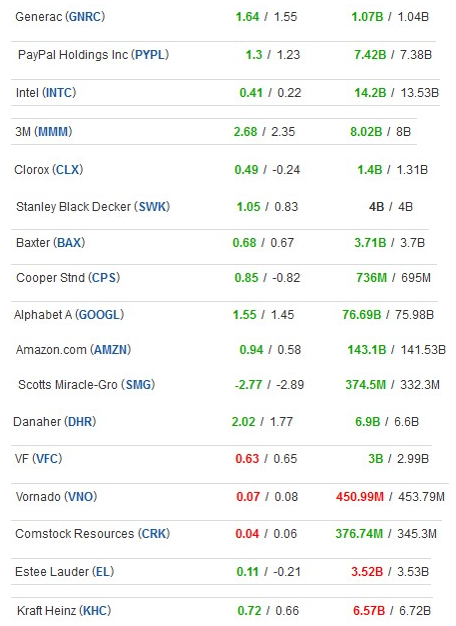
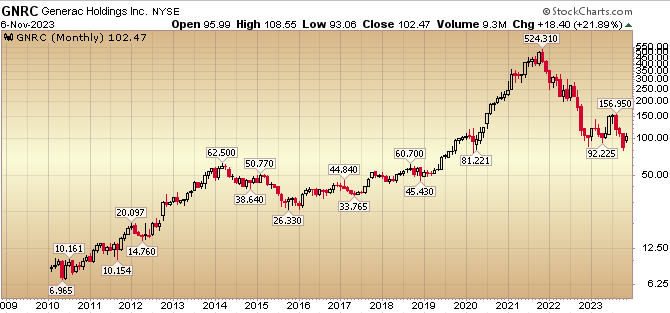
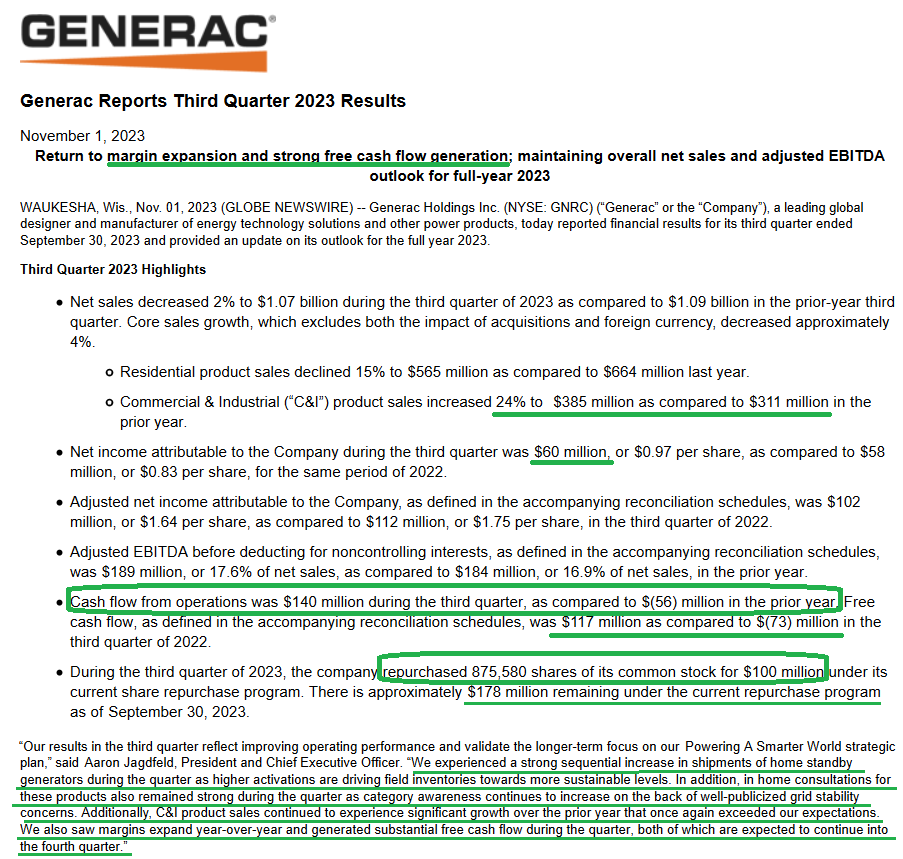
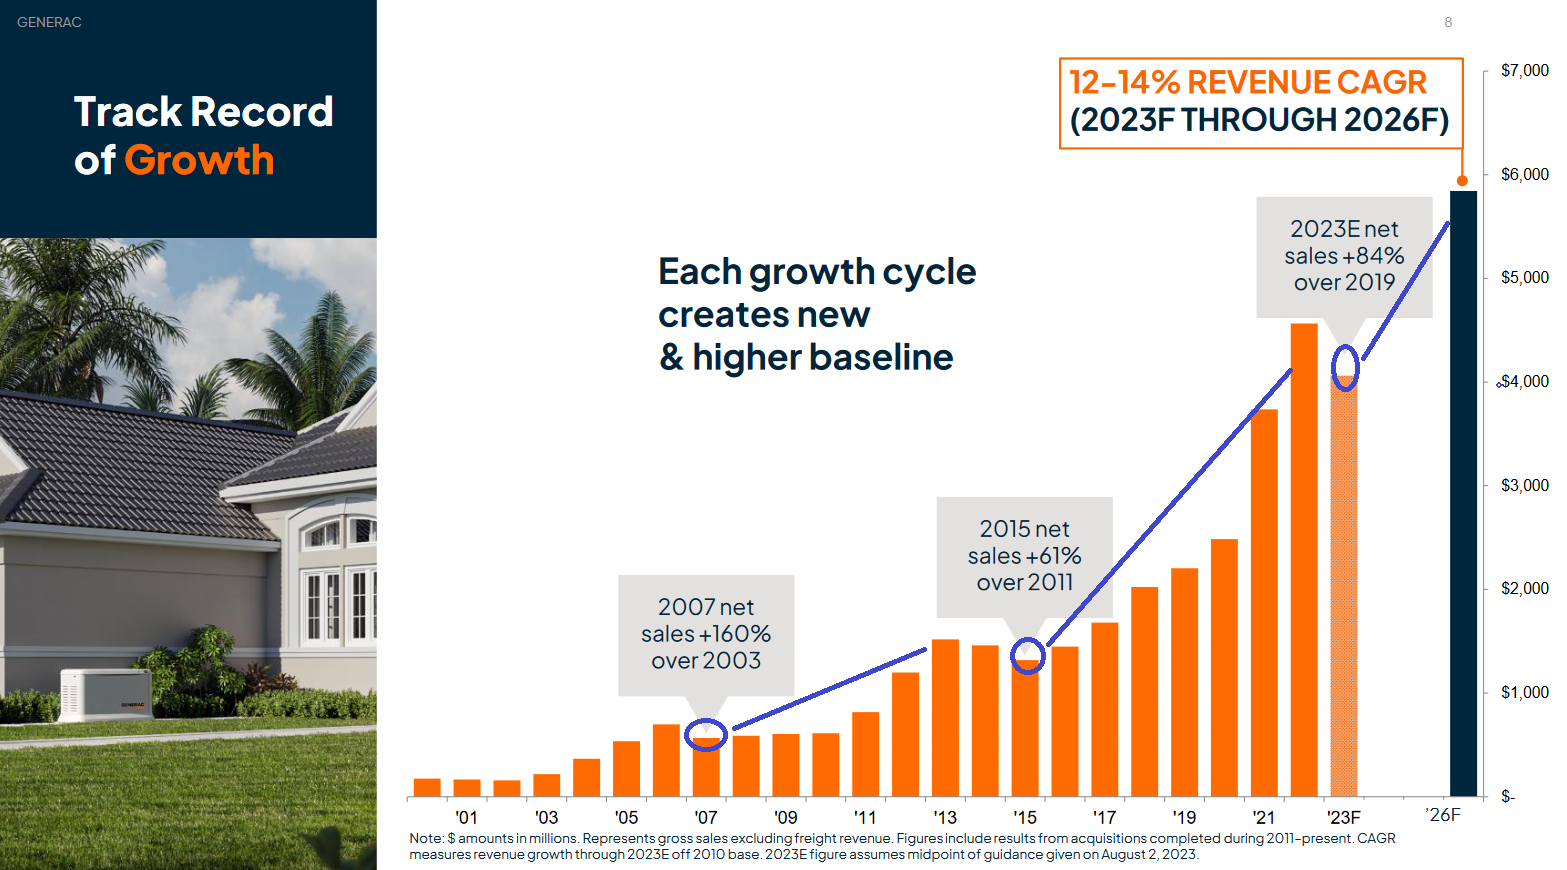
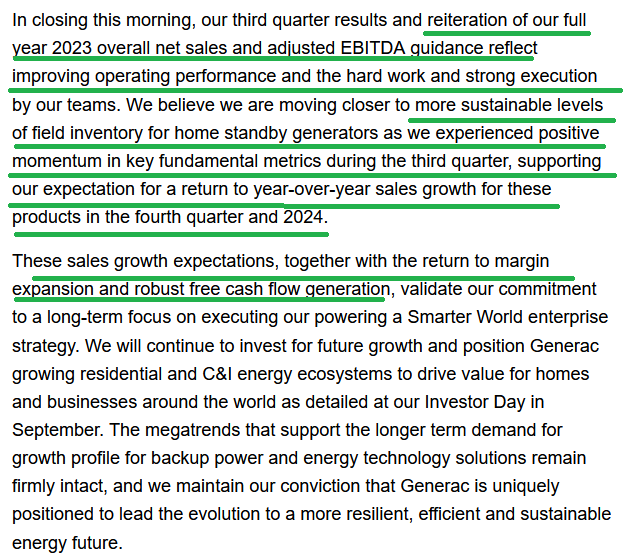
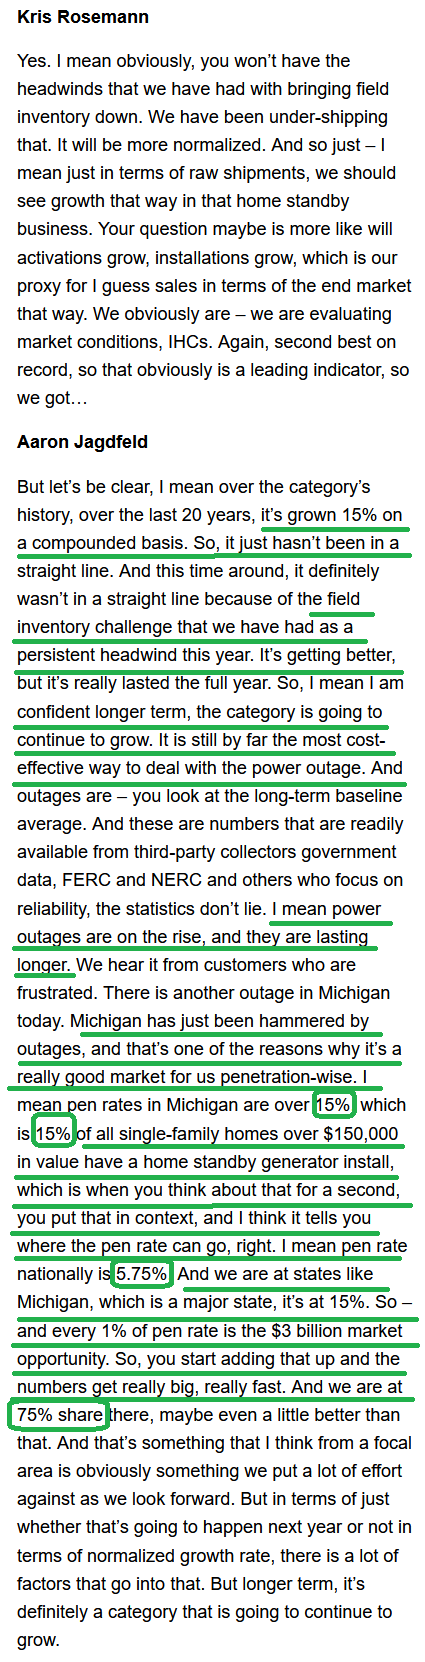
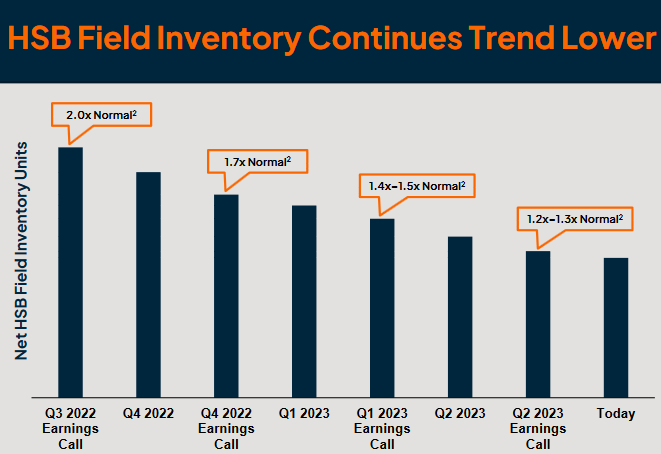
GNRC
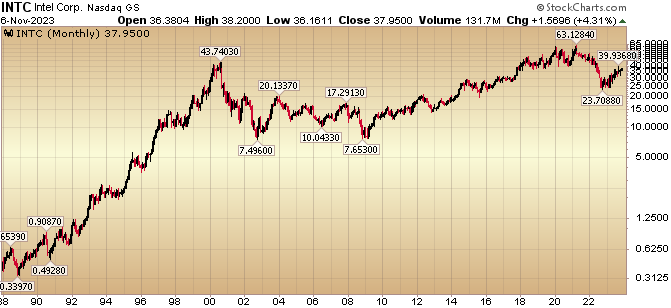
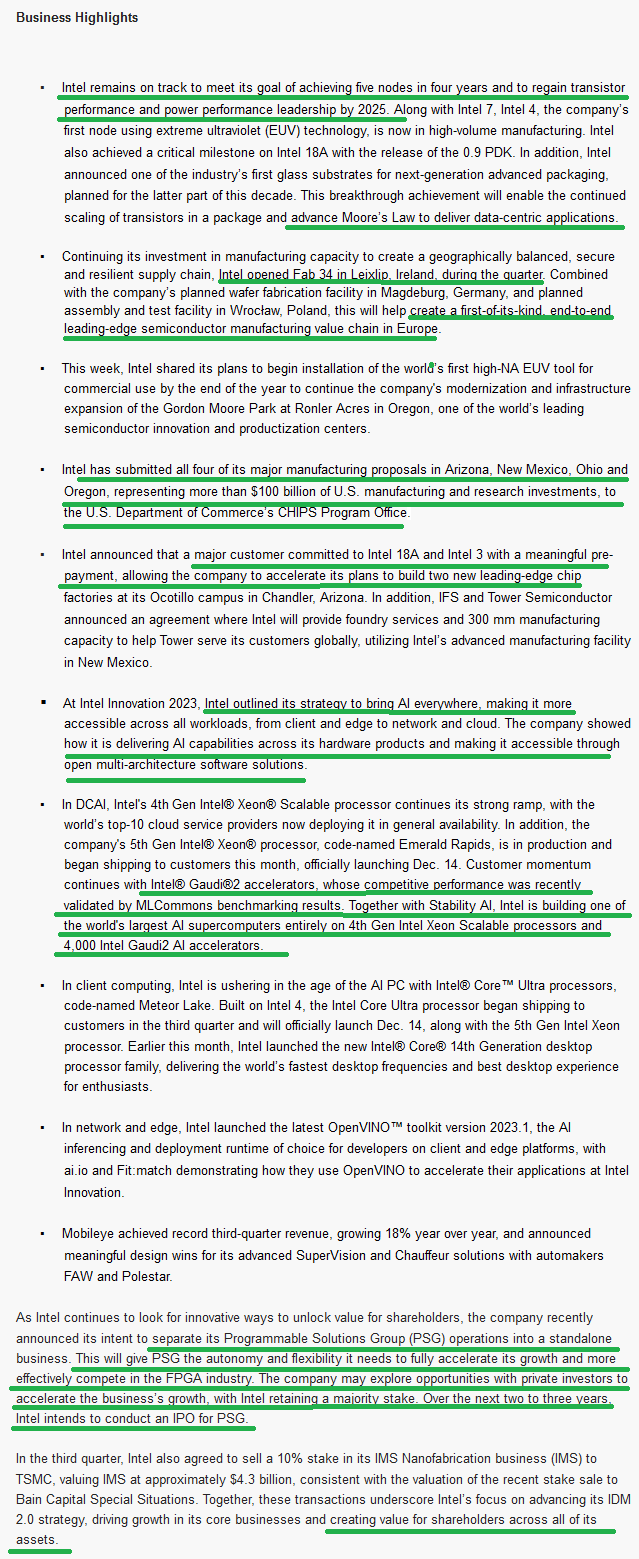
 INTC
INTC
![]()
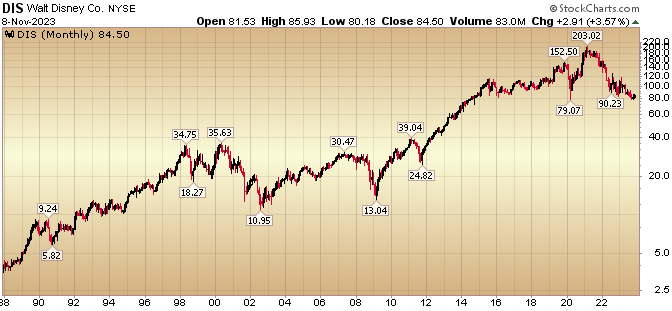
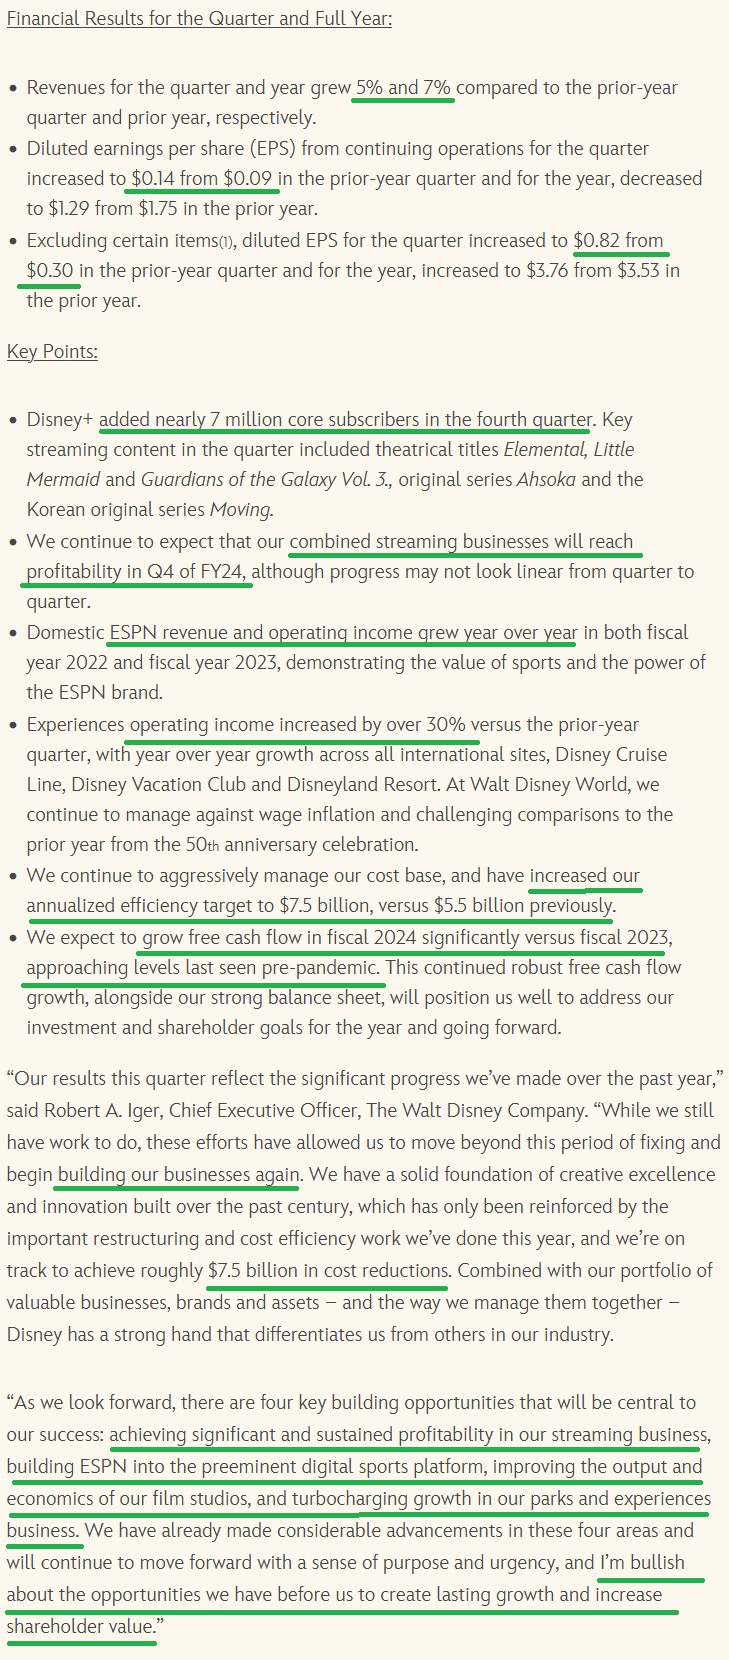
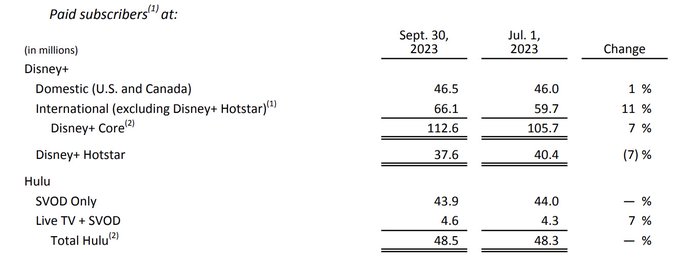
Disney

Now onto the shorter term view for the General Market:
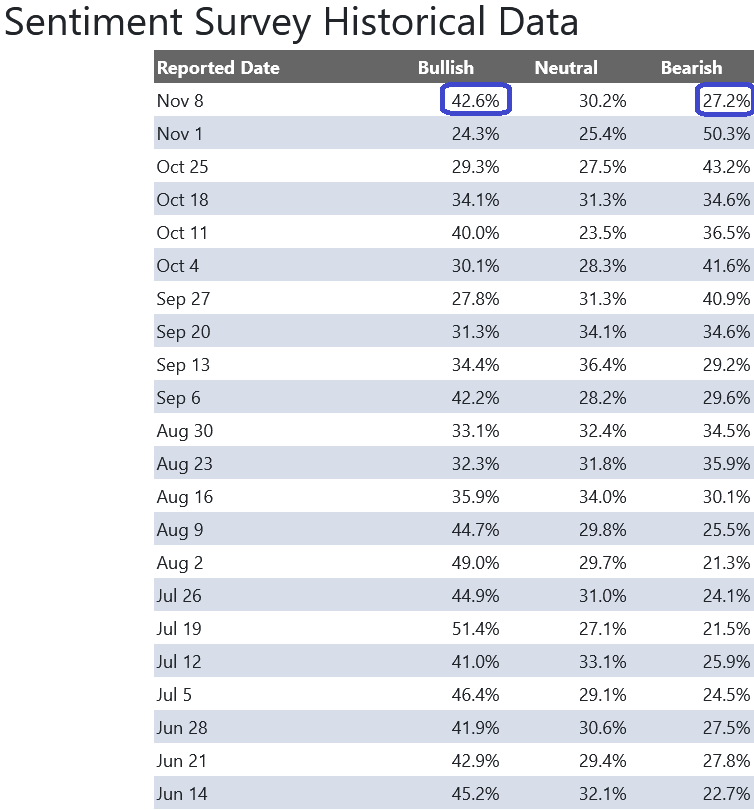
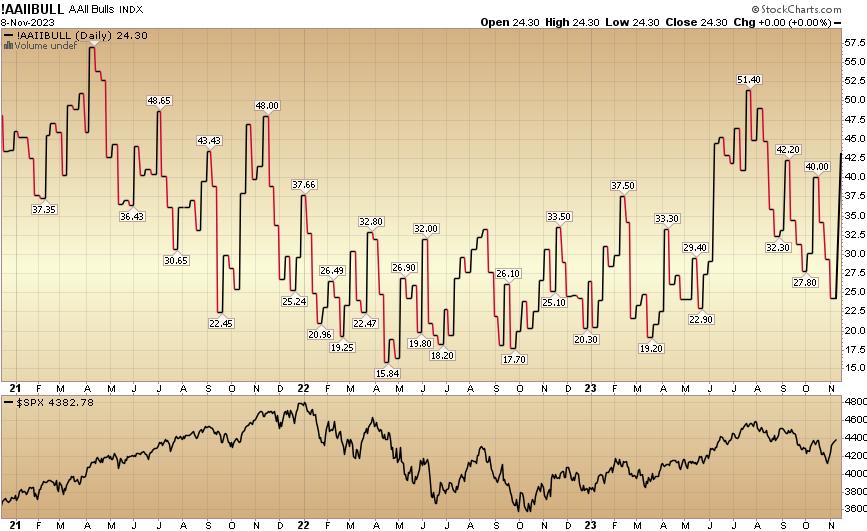
In this week’s AAII Sentiment Survey result, Bullish Percent (Video Explanation) jumped to 42.6% from 24.3% the previous week. Bearish Percent collapsed to 27.2% from 50.3%. What a difference a week makes. Opinion follows trend…
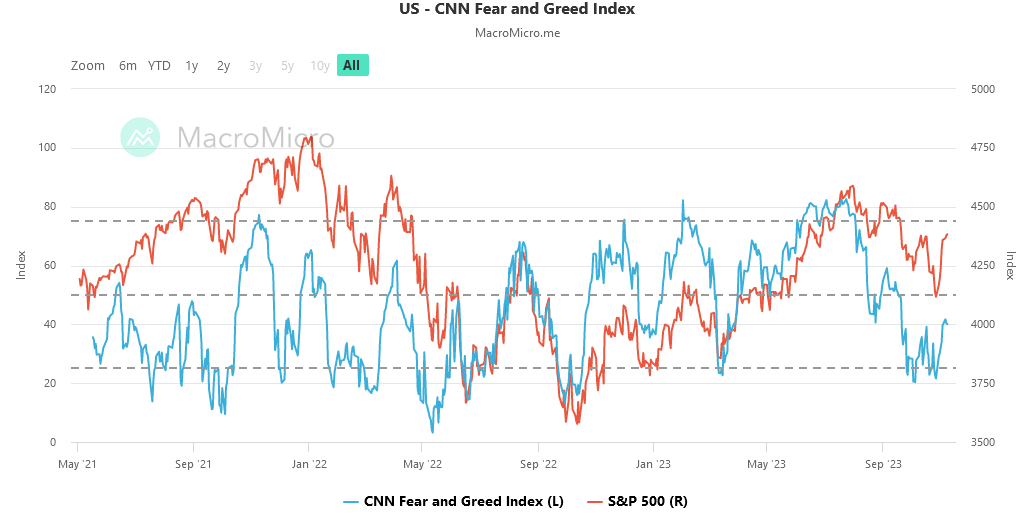
 The CNN “Fear and Greed” moved up from 30 two weeks ago to 40 this week. Investors are still fearful. You can learn how this indicator is calculated and how it works here: (Video Explanation)

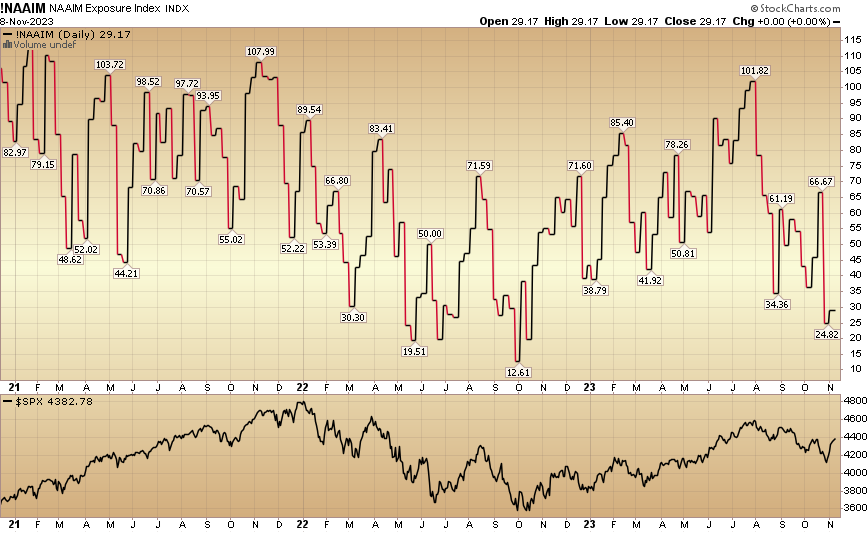
 And finally, the NAAIM (National Association of Active Investment Managers Index) (Video Explanation) collapsed to 29.17% this week from 66.67% equity exposure last week. The year end chase is going to continue from these depressed levels:
Our podcast|videocast will be out late today or tomorrow. Each week, we have a segment called “Ask Me Anything (AMA)” where we answer questions sent in by our audience. If you have a question for this week’s episode, please send it in at the contact form here.
***After being highly exclusive since 2019 (and closed to new investors prior to that), our business has expanded to serve an additional tier of clients. The response we have received since opening up in the past few months has dramatically exceeded our expectations. If you missed our opening in early Q3, we are opening for our Q4 round this week. For details, and to see if you qualify, go here.
*Opinion, Not Advice. See Terms


