
On the heels of my post earlier today and the concept of consolidation followed by expansion – both in earnings and price, I decided to look at it from a long term perspective.
While this 100 year chart would be much more interesting to me if it was overlayed with S&P 500 EPS by year – the data is not available that far back. Leaving that aside, let’s do the best with what we have.
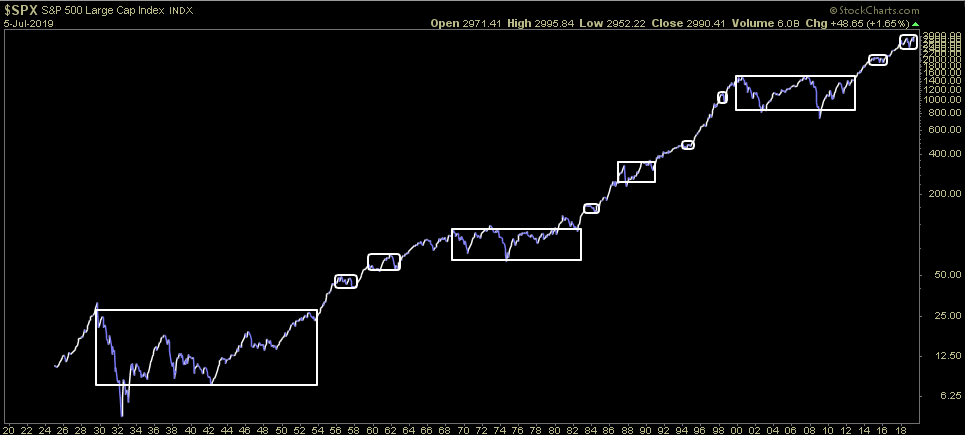
Many in the bearish camp (and rightfully so – with backward looking data slowing), point to the “monumental” move we have had off the 2009 “Depression” lows. While that is a reasonable assessment, one should also consider all of the major and minor consolidations of the past 100 years. Consolidation (sideways price action and growth) always precedes expansion – both on major time frames and minor time frames.
Too be accurate, one should be looking from the point at which price/growth broke out of the long term sideways range and started the period of expansion (new highs in price). In rough numbers you can see the three major consolidations from the past 100 years were 1929- ~1953, 1968- 1982, and 2000-2013.
PERIOD 1:
The expansion that started in 1953 went for ~15 years before topping in 1968. There were 2-3 minor consolidations during the 15 year expansion (as defined by the smaller sideways boxes). I can only imagine the amount of people calling for a depression in 1956 (at the first minor consolidation box in 1956). They would have said, “look how far we have run off the 1942 ‘bottom’, we have been expanding for 14 straight years (the longest ever expansion). The S&P is up 545% off the 1942 low. How long can this expansion continue?” The answer was: 12 years and 119% more.
PERIOD 2:
The expansion that started in 1982 went for ~18 years before topping in 2000. There were 4 minor consolidations during the 18 year expansion (as defined by the smaller sideways boxes). I can only imagine the amount of people calling for a depression in 1989 (at the second minor consolidation box in 1989). They would have said, “look how far we have run off the 1974 ‘bottom’, we have been expanding for 15 straight years (the longest ever expansion). The S&P is up 480% off the 1974 low. How long can this expansion continue?” The answer was: 11 years and 332% more.
PERIOD 3:
We are now at the second consolidation box after the 2013 breakout. The expansion has been going for 6 years since making new highs. What do we hear? The same thing they heard in 1989 and 1956. They are saying, “look how far we have run off the 2009 ‘bottom’, we have been expanding for 10 straight years (the “longest” ever expansion). The S&P is up 349% off the 2009 low. How long can this expansion continue?” The answer is: no one – including myself – can say with absolute certainty. However, if history carries any weight in your analysis I would say, “be open to the possibility that there’s more good to come in coming years.”
This is my earlier post talking about the correlation between sideways earnings and sideways price:
Now stop looking at charts and go have a great weekend!


