Key Market Outlook(s) and Pick(s)
On Monday, I joined Liz Claman on Fox Business’s The Claman Countdown to discuss markets, outlook, the software selloff, PayPal ($PYPL), Dentsply Sirona ($XRAY), Estée Lauder ($EL), and more. Thanks to Liz and Brooke Haliscak for having me on:
Watch in HD directly on Fox Business
On Tuesday, I joined Stuart Varney on Fox Business’s Varney & Co. to discuss markets, outlook, the economy, the software selloff, Diageo ($DEO), Hormel ($HRL), and more. Thanks to Stuart, Christian Dagger, and Maggie Edwards for having me on:
On Wednesday, I joined Taylor Riggs, Brian Brenberg, Jackie DeAngelis, and Gerri Willis on Fox Business’ The Big Money Show to discuss markets, the economy, news, and a lot more. Thanks to Taylor, Brian, Jackie, Gerri, and Madison Murtagh for having me on:
On Monday, I joined Jenny Horne on Schwab Network to discuss markets, the economy, outlook, tariffs, hyperscalers, earnings, defensives, Estée Lauder ($EL), Dentsply Sirona ($XRAY), and more. Thanks to Jenny, Diane King Hall, Althea Thompson, and Kaitlyn Crist for having me on:
Bank of America Fund Manager Survey Update
Last Tuesday, we put out a summary of the monthly Bank of America “Global Fund Manager Survey.” This month they surveyed 190 institutional managers with ~$512B AUM:
February 2026 Bank of America Global Fund Manager Survey Results (Summary)
Here were the 5 key points:
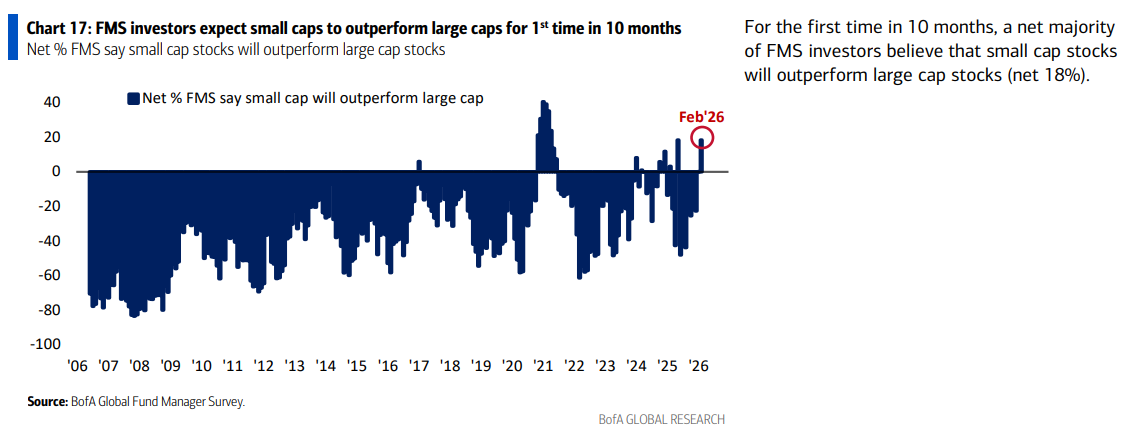
1) For the first time in 10 months, a net majority of fund managers (net 18%) believe small caps will outperform large caps. Opinion follows trend.
We continue to see this rotation as being in the very first inning, with multiple catalysts lined up to drive the next leg higher: an earnings inflection back to positive after 10 consecutive negative quarters, a dovish Fed easing cycle, low allocation levels with short interest near multi year highs, and the long term record of 2.85% annual outperformance since 1927 despite the past decade plus of underperformance.
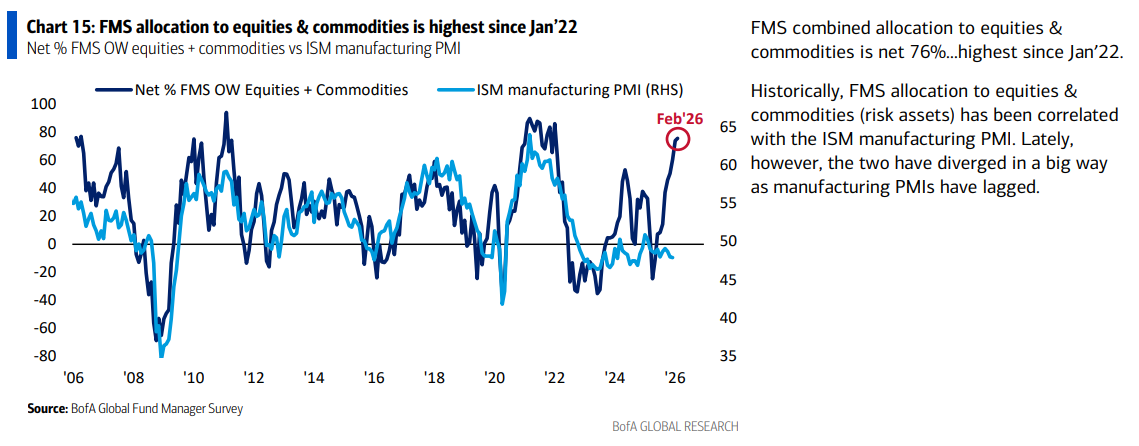
2) Fund managers’ combined allocation to equities and commodities sits at a net 76% overweight (highest since January 2022). Historically, elevated exposure to risk assets (equities + commodities) has moved closely with ISM Manufacturing PMI, which is now emerging from one of the longest downturns in modern history (>2 years in contraction). The latest print (post BofA survey) rose 4.7 points to 52.6, the strongest expansion since 2022. If ISM catches up to where positioning already stands, the cyclical recovery has room to run MATERIALLY higher = green light for small caps and cyclicals.
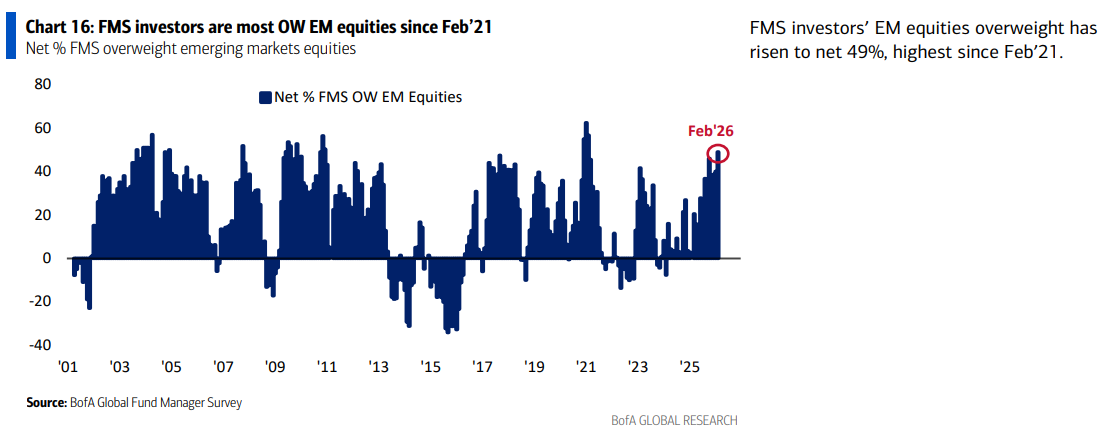
3) Fund managers are now the most overweight emerging markets equities since February 2021, with a net 49% OW position. This is a rotation we were pounding the table on when it was left for dead, making the case for mean reversion after the longest stretch of US outperformance on record at 16 years and the added tailwind of a weaker dollar. Now that the trade is working, everyone wants to climb aboard. Similar to small caps, this passing of the torch is still in the early innings.
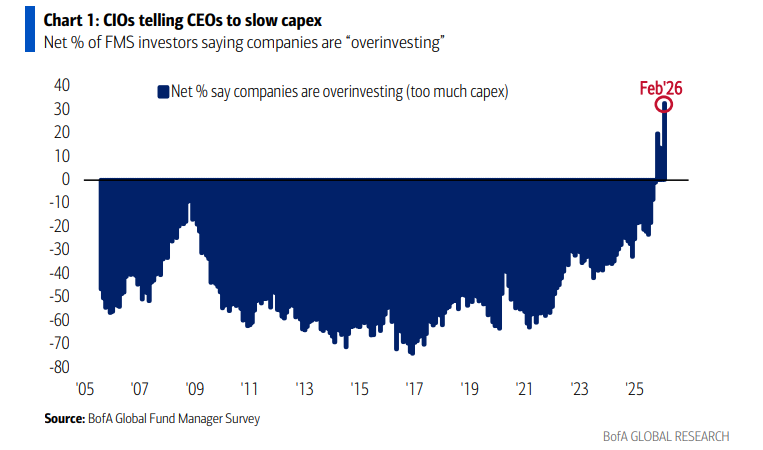
4) A record high share of FMS investors now believe companies are overinvesting, with a net 35% saying capex is too high versus 26% last month. The asset light model that once defined big tech’s dominance has shifted to a capital intensive arms race, with capex now consuming more than 60% of operating cash flow, levels on par with big oil and tracking toward 92% in 2026. Investors are no longer blindly applauding the spend and are beginning to ask where the R is in ROIC.
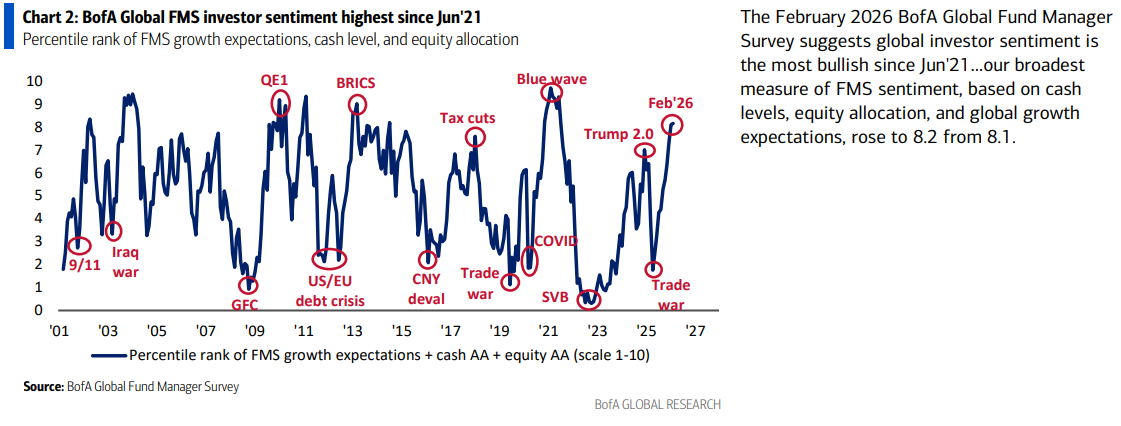
5) Global investor sentiment, as measured by cash levels, equity allocations, and global growth expectations, rose to 8.2 from 8.1, the most bullish reading since June 2021. Expect some near term volatility, typical of a mid term year, to shake out weak hands.
Advance Auto Parts Update
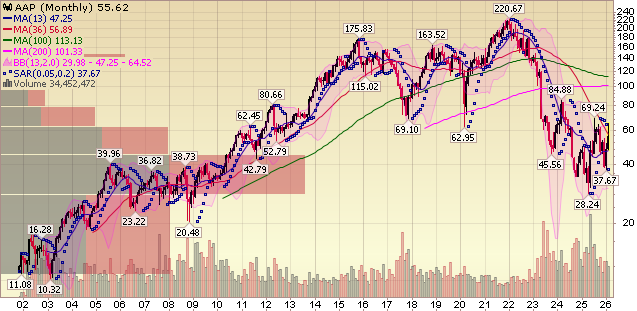
Advance is advancing.
2025 marked a clear step forward in the AAP turnaround, as CEO Shane O’Kelly’s expertise has proven to be exactly what this long-struggling auto parts retailer needed.
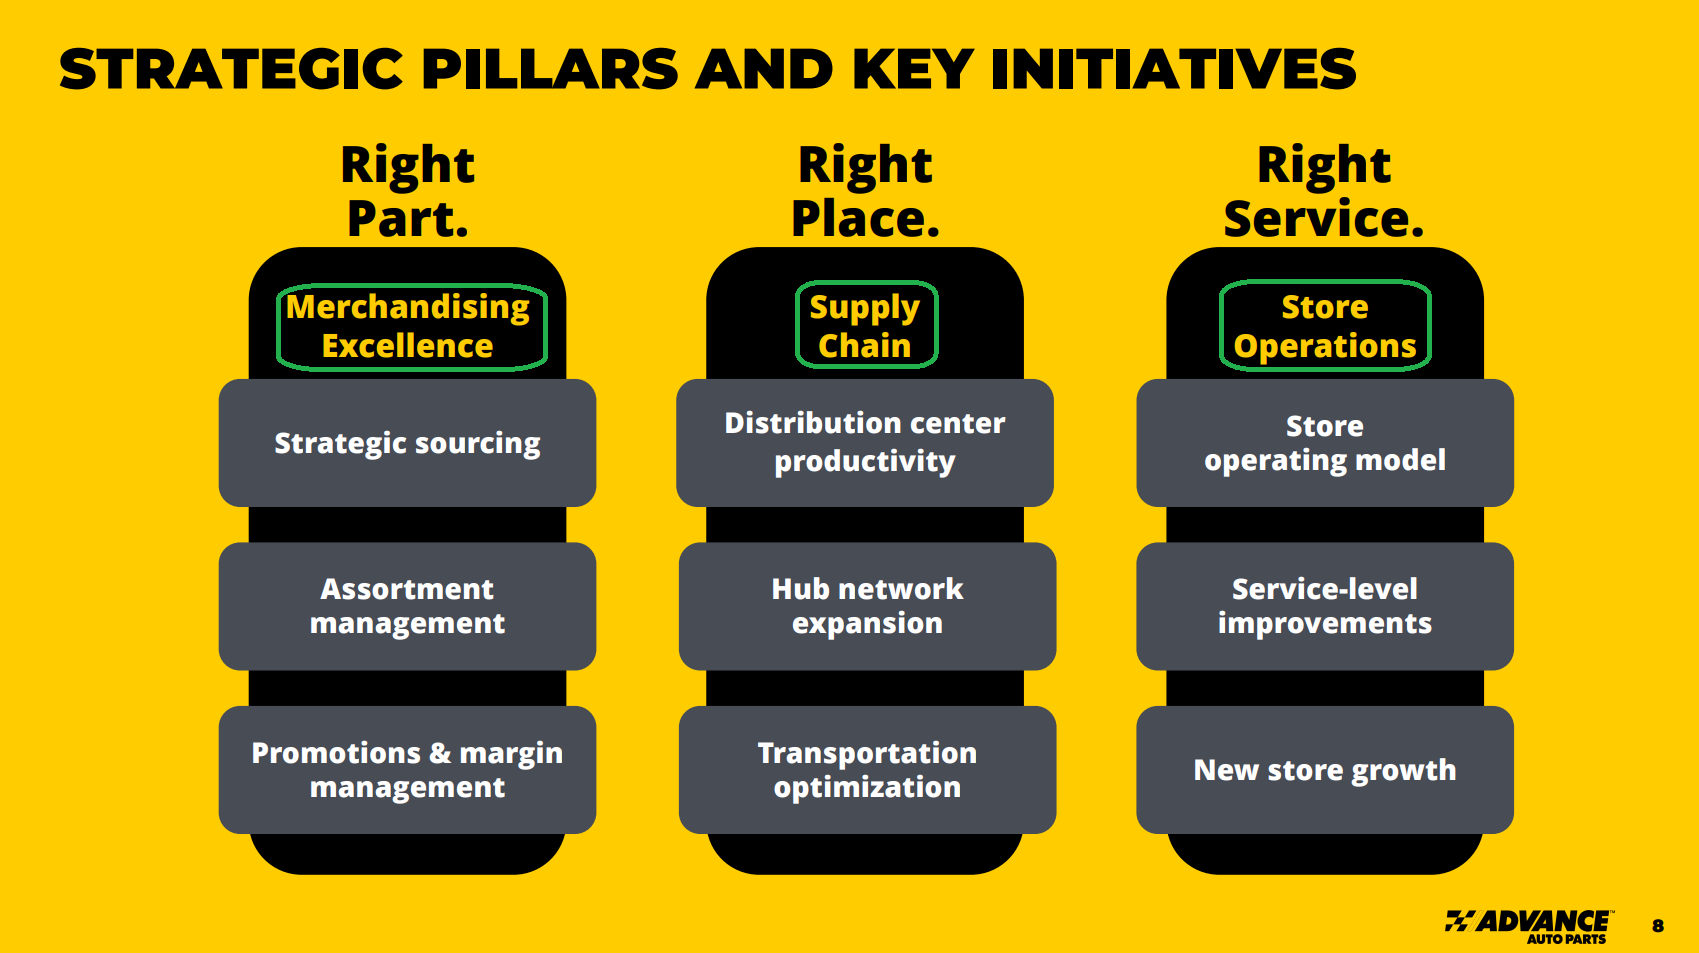
The playbook is centered on replicating the highly successful hub-and-spoke model that industry peers like O’Reilly and AutoZone have used for years to frankly eat AAP’s lunch.
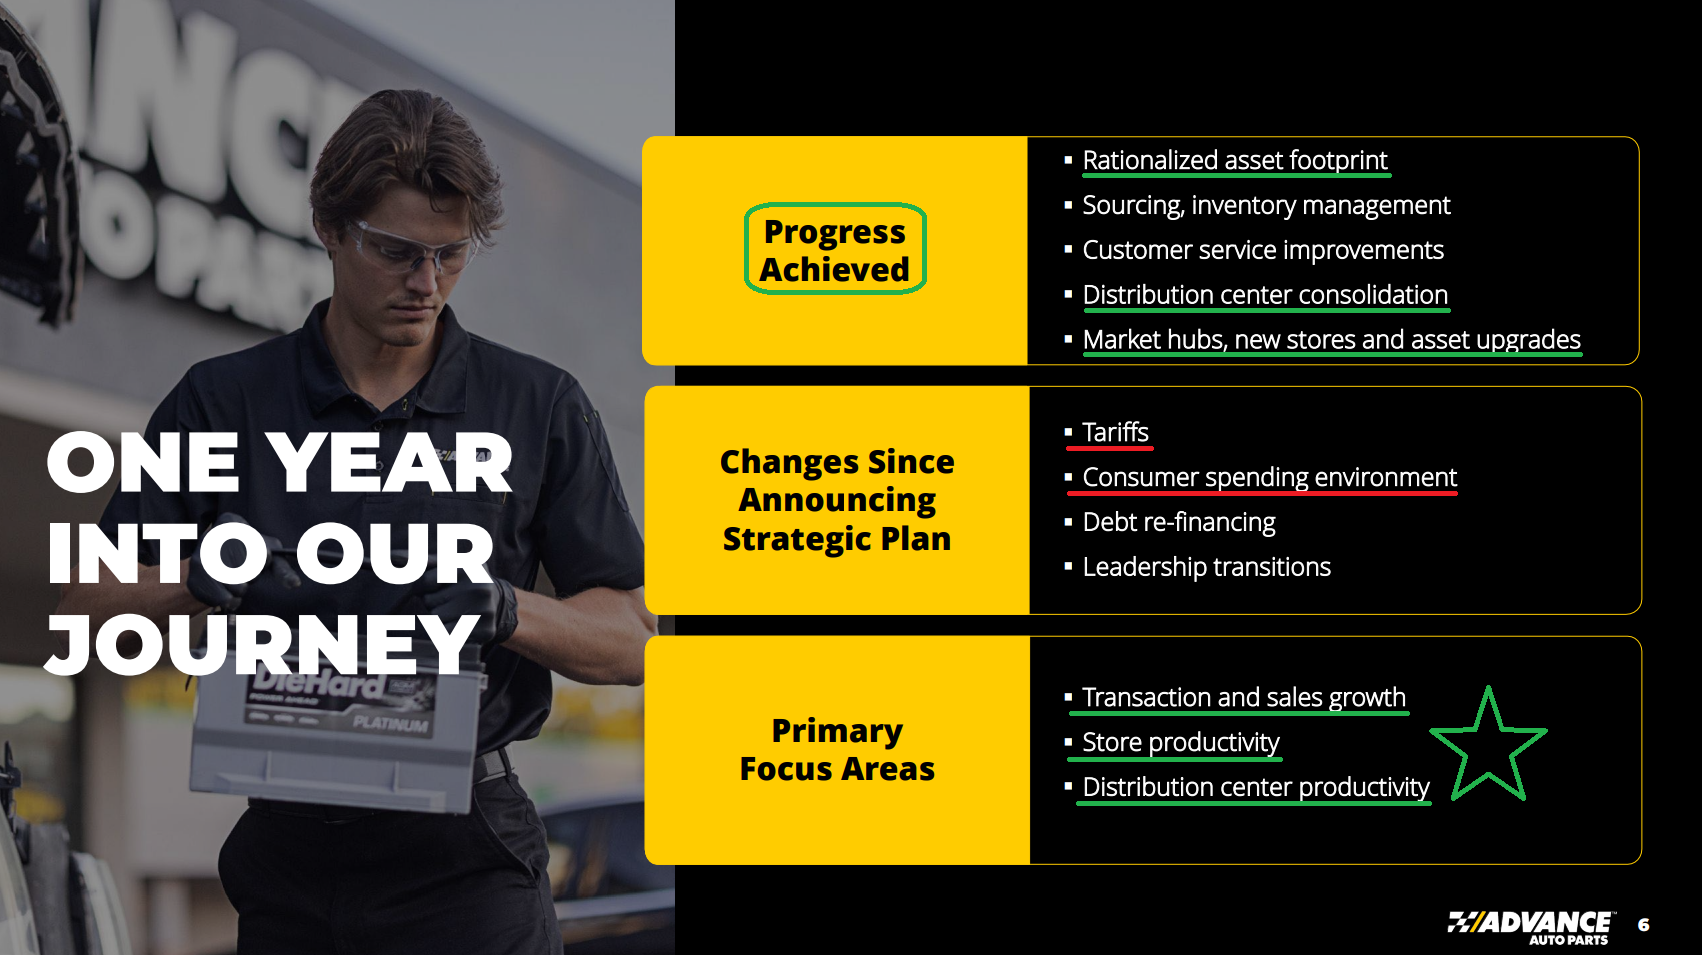
AAP has been the industry’s red-headed stepchild for too long, running an inefficient supply chain that failed at the most basic objective of having the right part in the right place at the right time. O’Kelly, who previously led major supply chain overhauls as CEO of $8B HD Supply and PetroChoice, wasted no time rolling up his sleeves and ripping off the Band-Aid.
Distribution centers have been consolidated from an inefficient 38 facilities, all with varying sizes and systems, to just 16 by the end of 2025. More importantly, those DCs are no longer being asked to do everything. They are now complemented by a growing network of market hubs.
These hubs carry 75k to 80k SKUs and enable same-day delivery across 60 to 90 stores, a strategy already driving ~100 bps of average comp lift. Advance opened 14 new hubs in 2025, bringing the total to 33 and keeping the company on track for 60 by 2027.
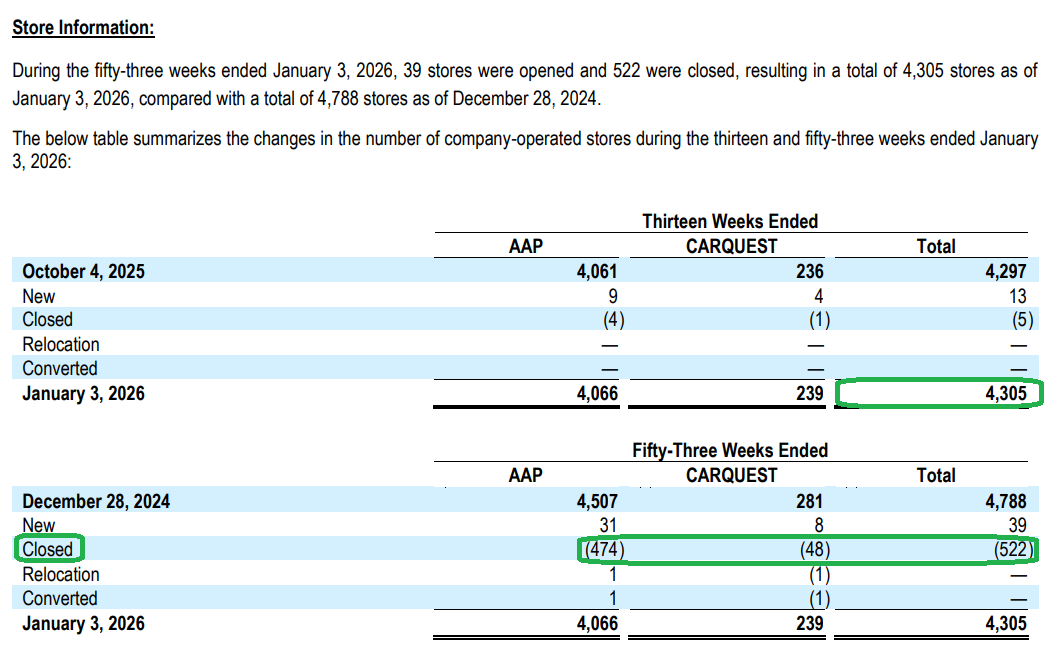
At the same time, AAP completed its store footprint rationalization, closing more than 700 underperforming and unprofitable stores to focus on the strongest markets. Auto parts retail is a game won through concentration and density, and Advance now holds a #1 or #2 share position in more than 75% of the markets it serves. The remaining 4,305 stores are receiving long-overdue facelifts, from parking lots to signage to racking, so they actually look open for business.
This is blocking and tackling at its finest. No reinventing the wheel or curing cancer, just getting back to the basics of selling auto parts.
While it’s a multiyear endeavor and an intensive turnaround effort, the fruits of this heavy lifting are starting to show up in the numbers.
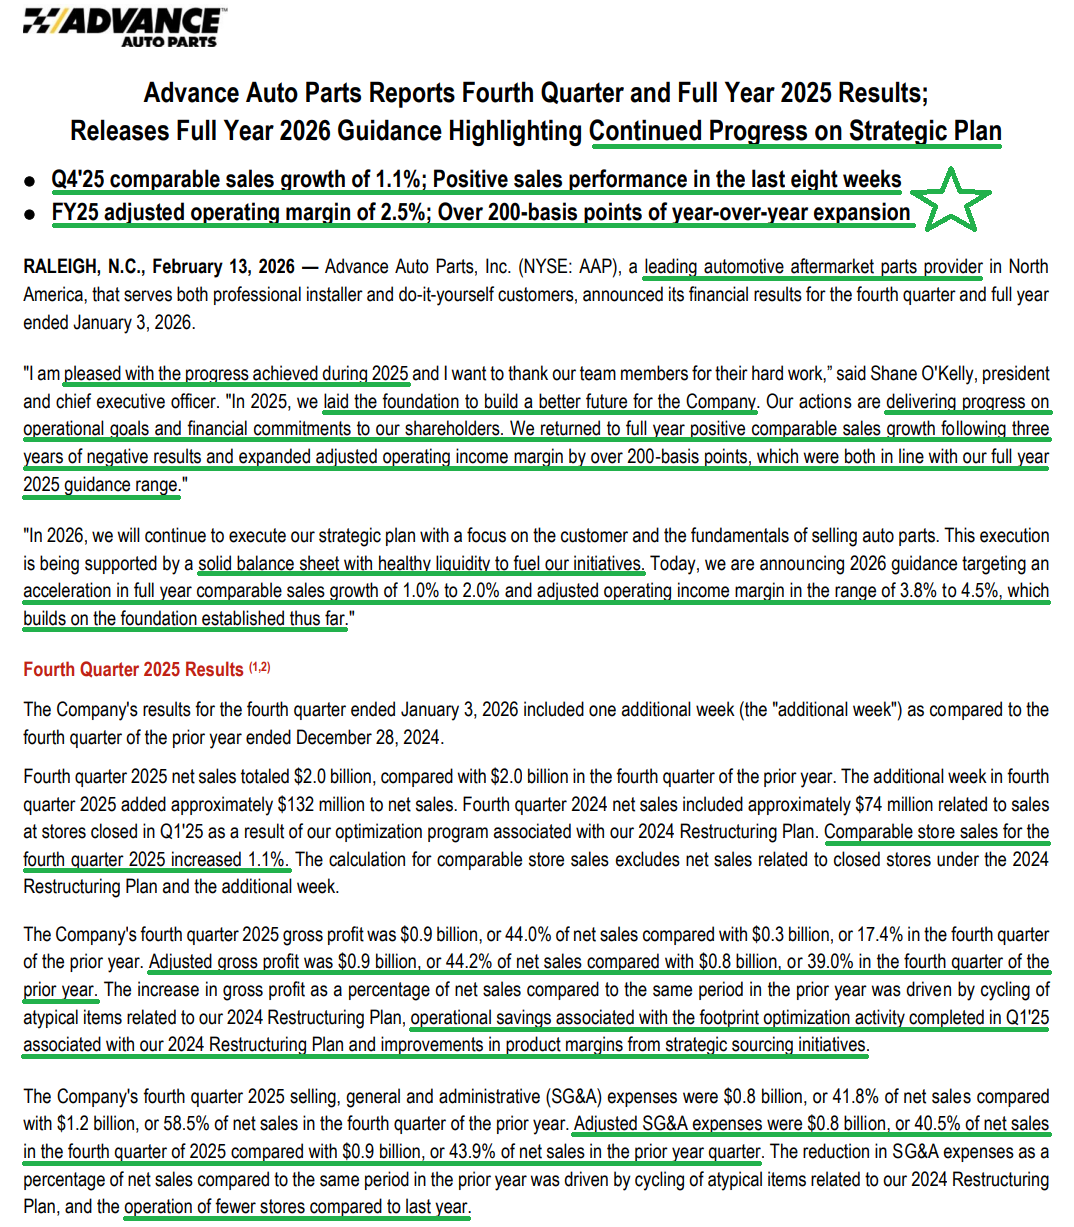
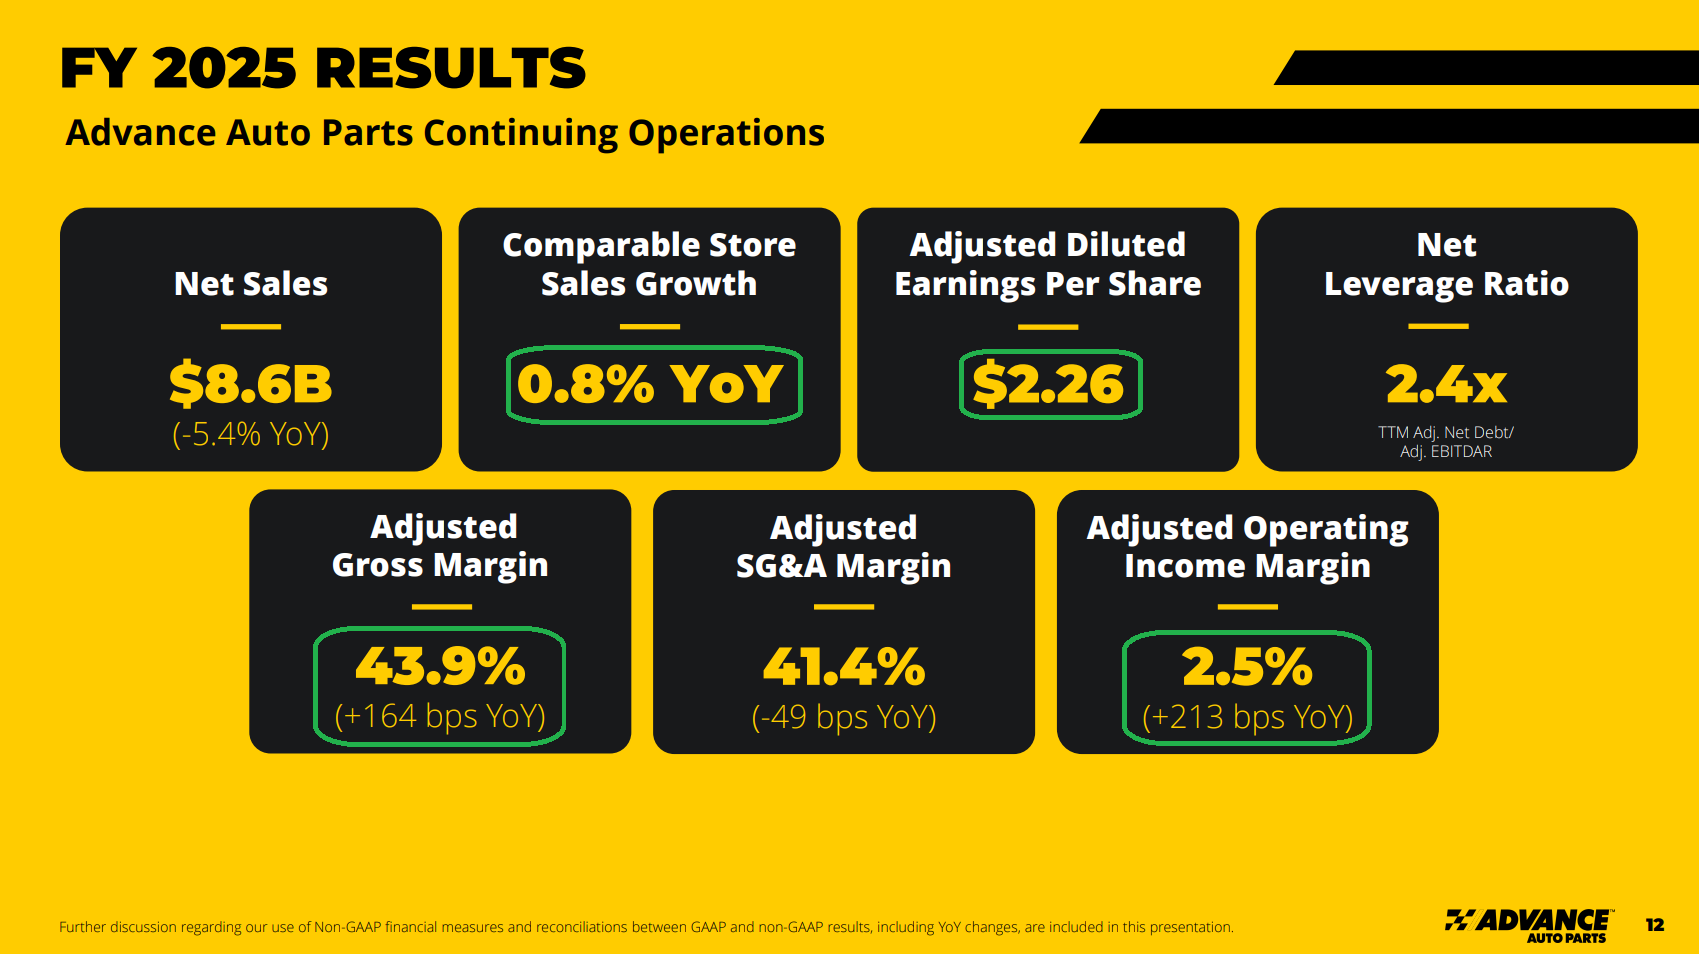
Advance delivered +0.8% comp growth in 2025, inflecting positive after three consecutive years of declines.
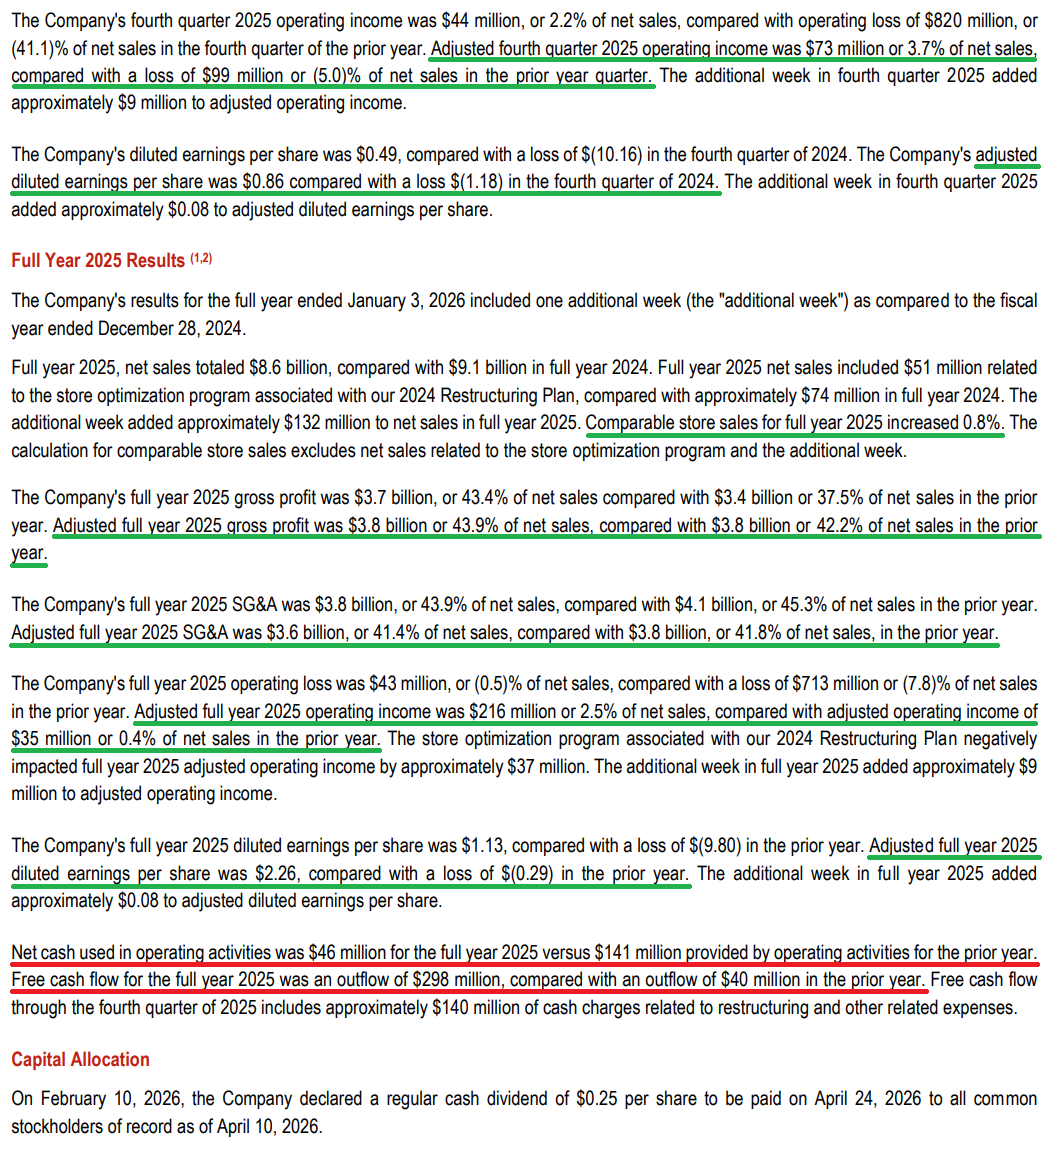
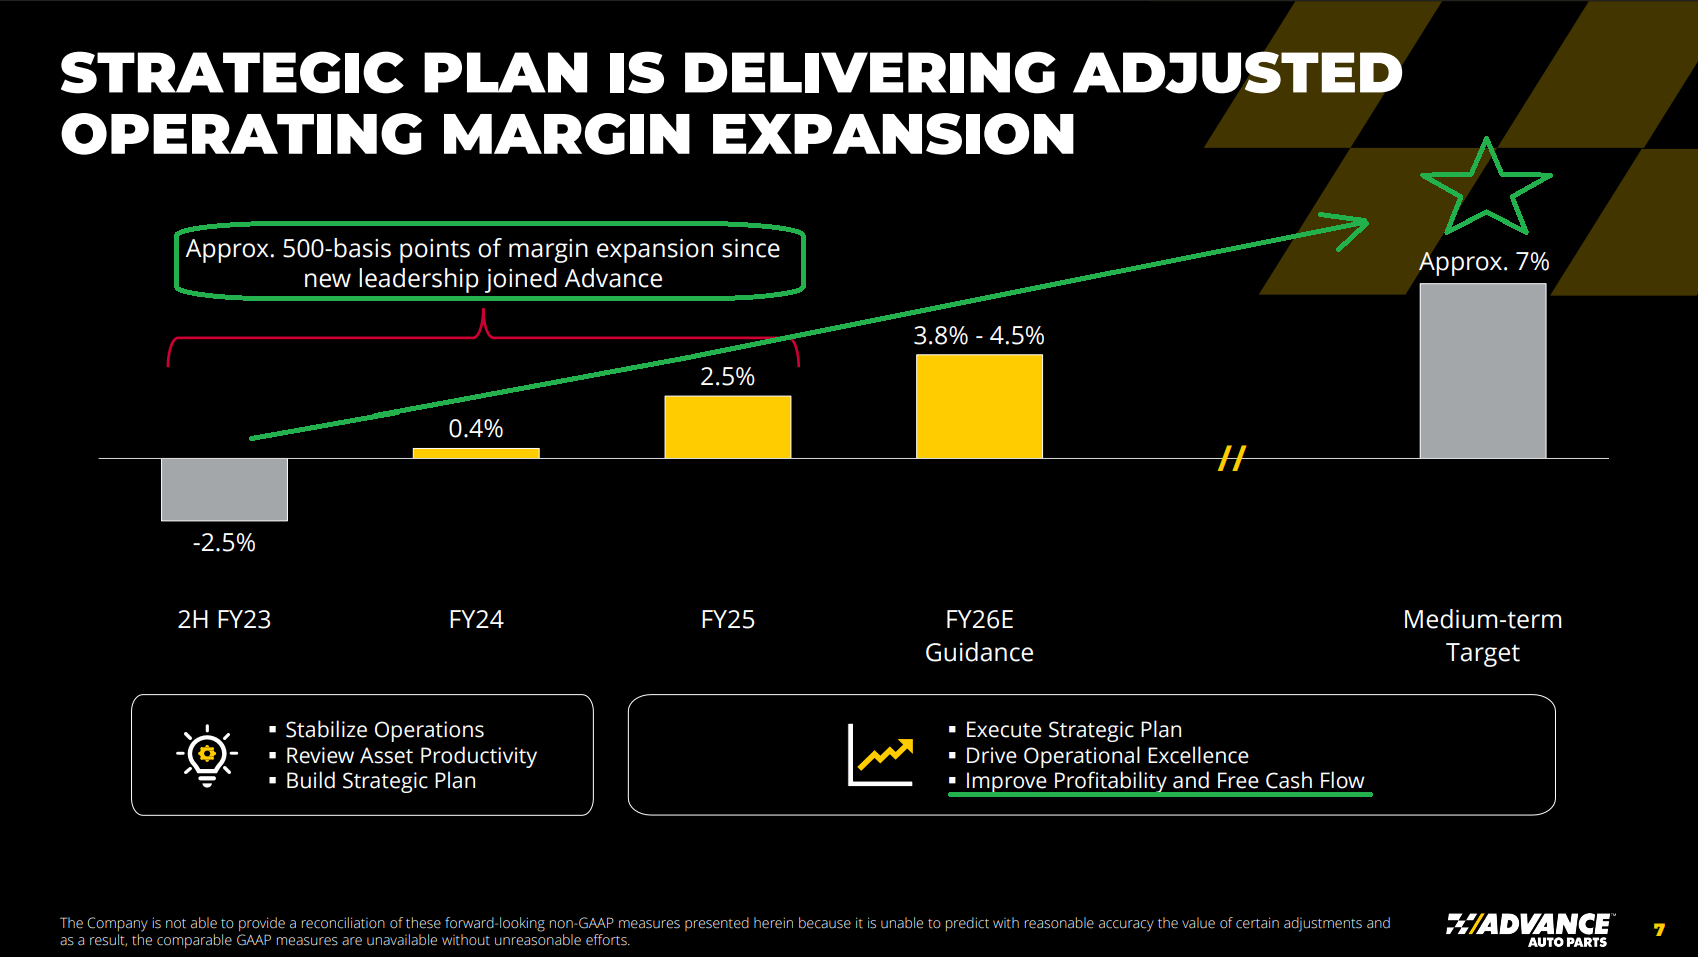
The most important metric of the turnaround, adjusted operating margins, expanded +213 bps to 2.5%, marking more than 500 bps of improvement since O’Kelly and his team took the reins.
For context, margins troughed at just 0.4% in 2024, the weakest level in more than 20 years and a far cry from Advance’s historical 9% to 11% range and the 19% to 20% posted by peers AutoZone and O’Reilly.
Today’s results are only just coming off the mat from these depressed levels, with plenty of low-hanging fruit to help narrow the massive gap.
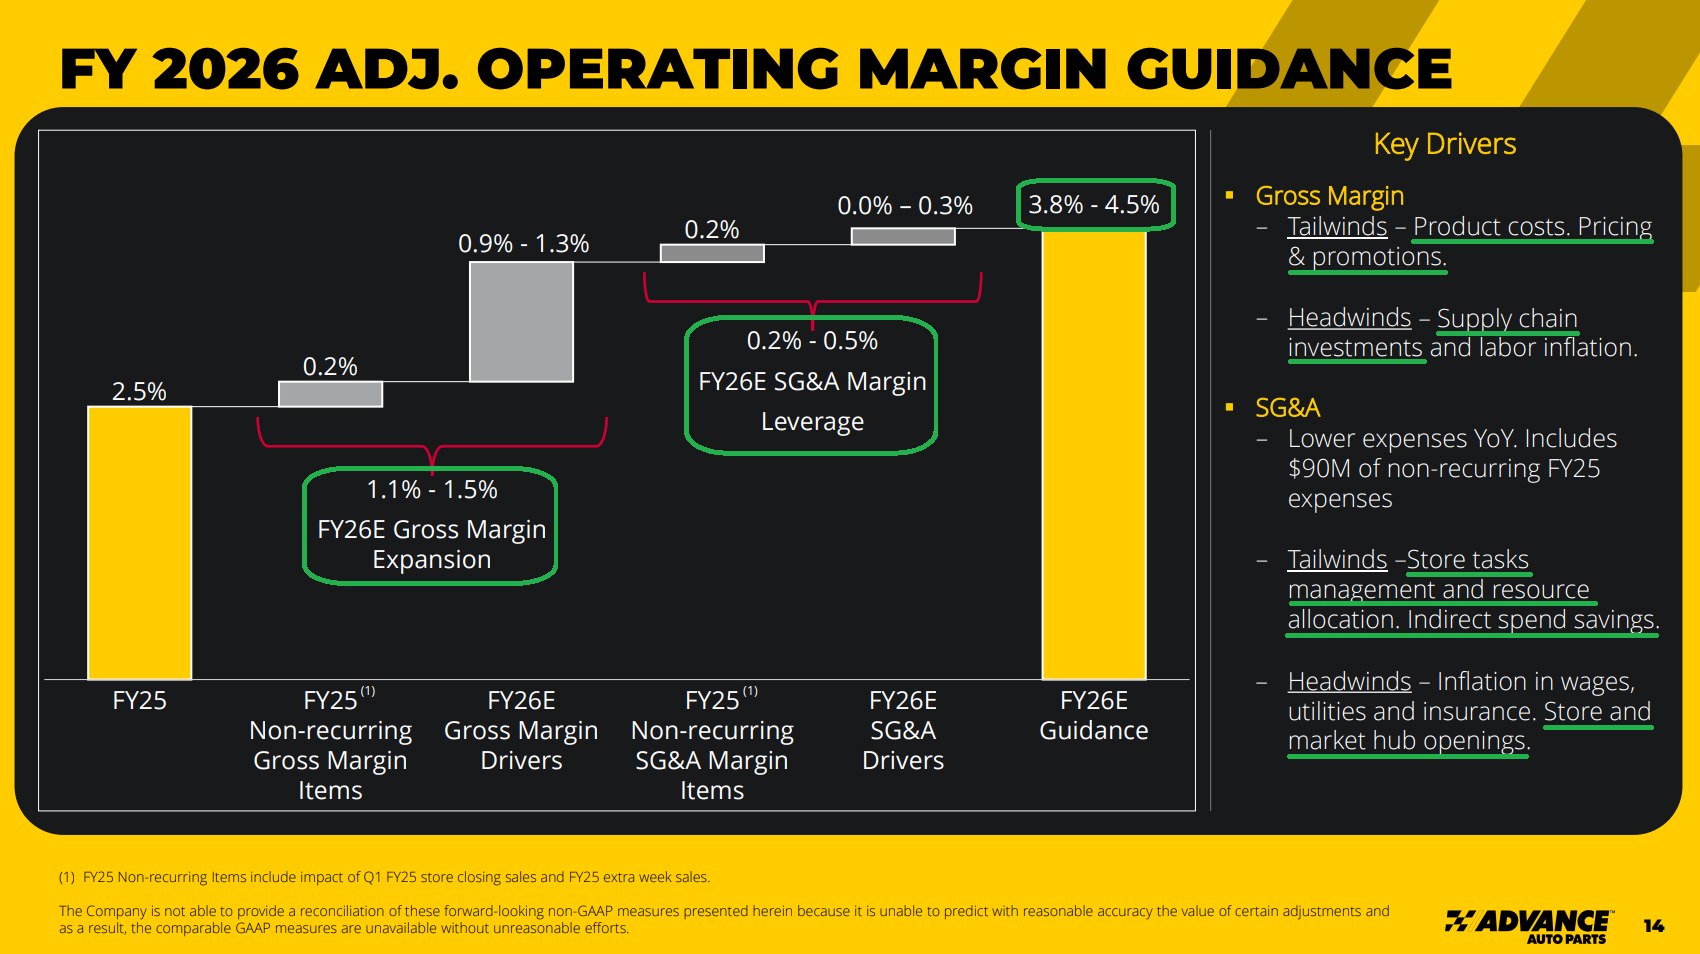
Management’s midpoint guidance for 2026 implies another +165 bps of margin expansion to 4.15%, with at least +100 bps on deck for 2027.
While that likely pushes the original 7% target into 2028, management remains confident in the framework, and it is simply a matter of pacing.
This delay was largely telegraphed by consensus heading into the report, and even despite the clear signs of progress, estimates are still taking the under, sitting at just 4.9% for FY2027 and 5.2% for FY2028.
With the underlying margin framework in place and showing signs of working, we are more than happy to side with a proven operator like O’Kelly on this one.
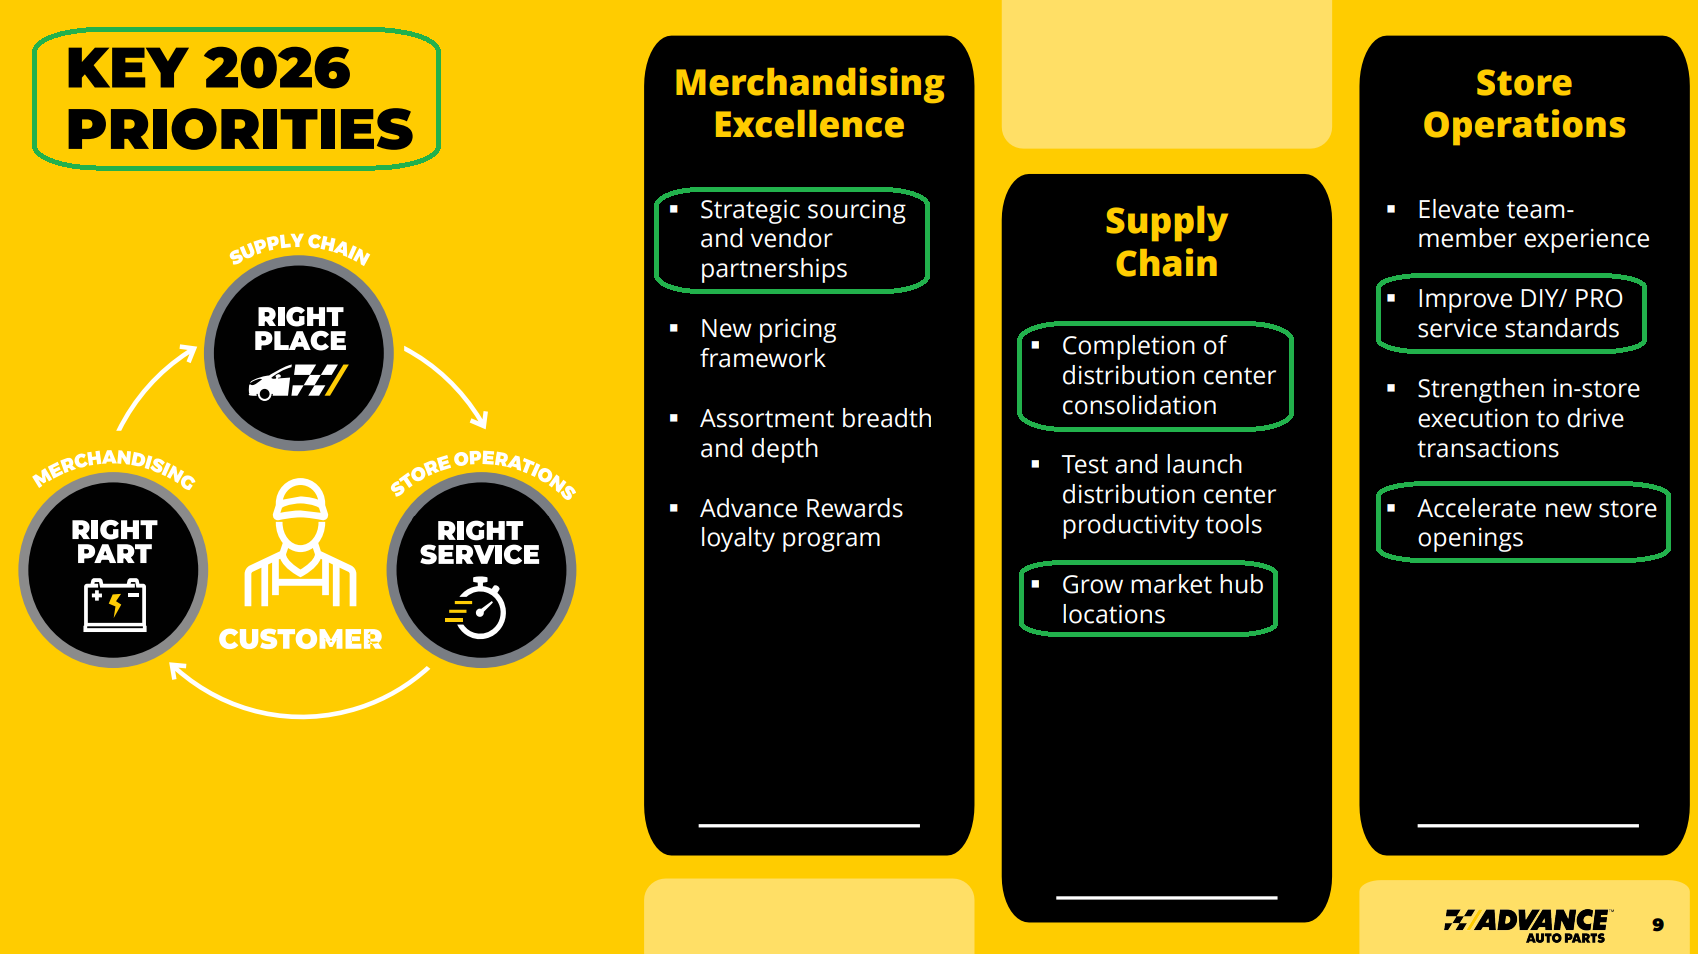
At the end of the day, the foundation has been laid and the heavy lifting is largely complete. 2026 comes down to executing the playbook: cleaning up merchandising, unlocking supply chain productivity, and improving store-level operations.
Again, this is simply blocking and tackling done right.
It also helps to operate in an industry that is 90% break/fix and non-discretionary. If your car breaks down, you have no choice but to get it fixed. On top of that, there are structural demand drivers that aren’t going anywhere and put the wind at their backs:
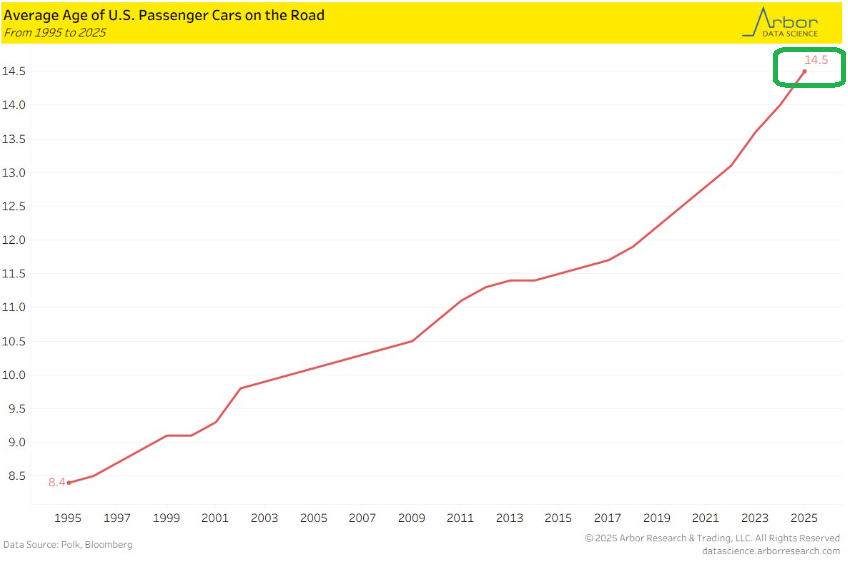
Record-high average vehicle age of 14.5 years
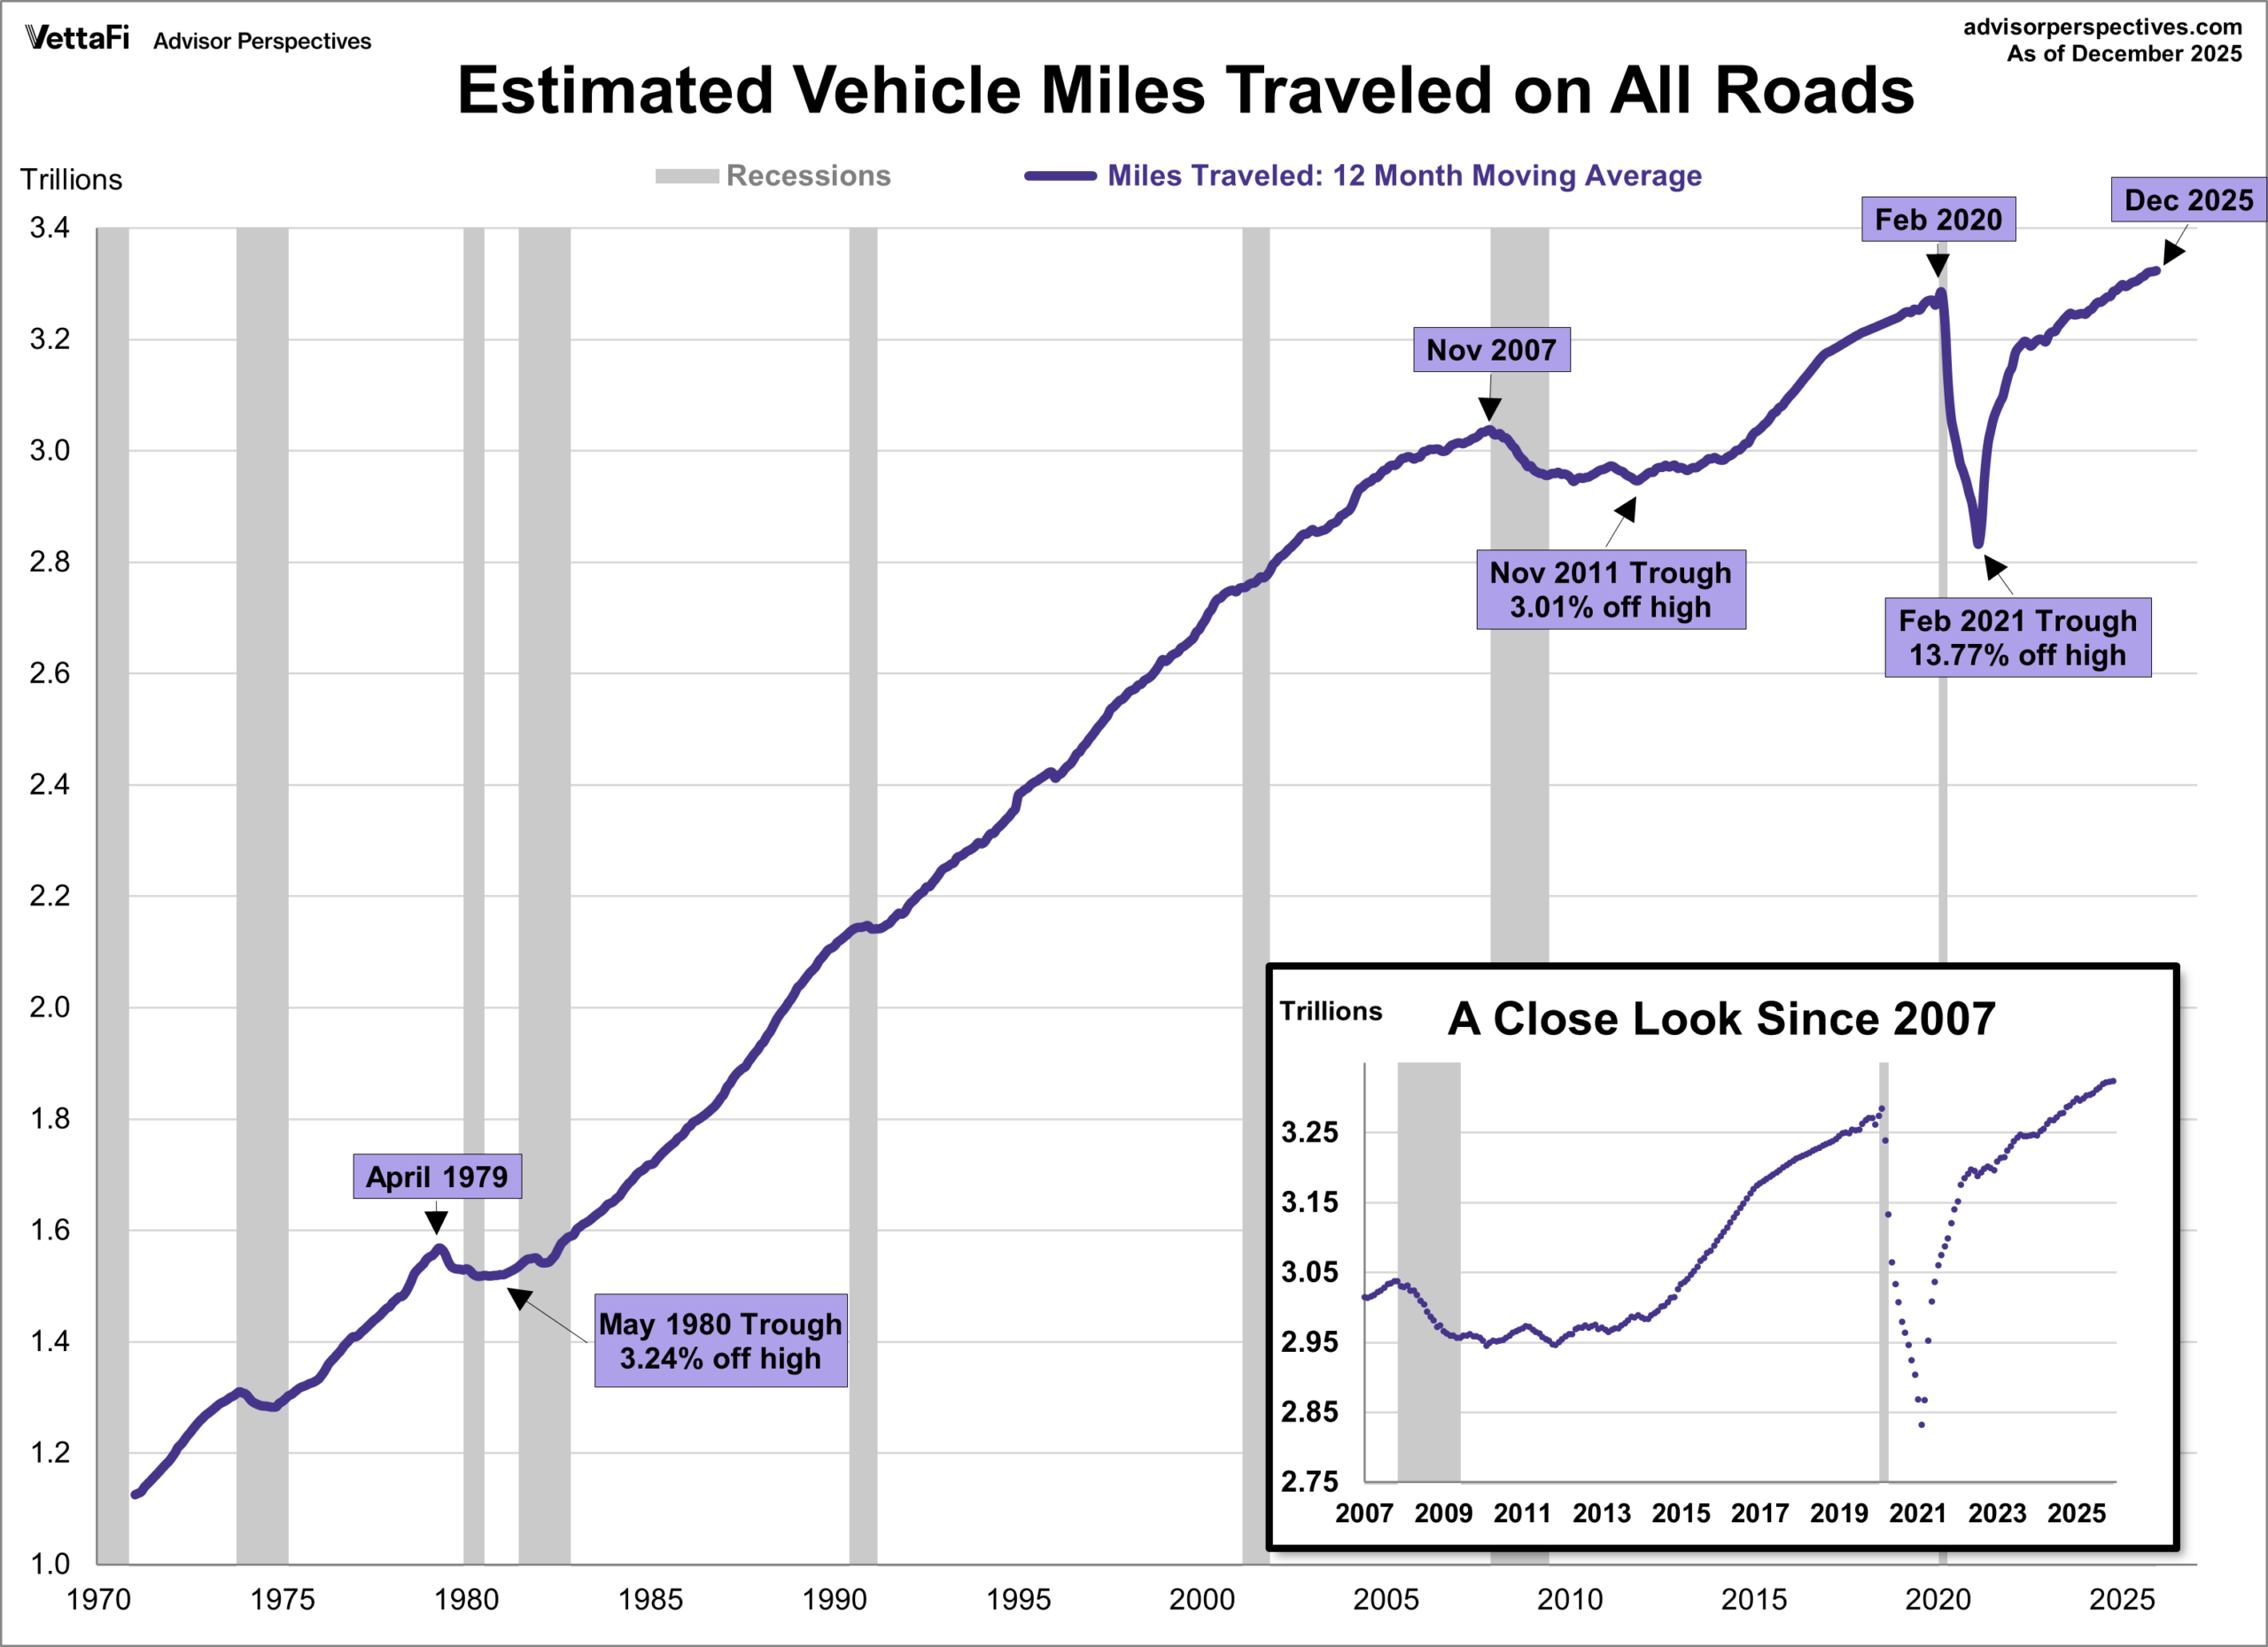
Record-high vehicle miles traveled exceeding 3.3T
Our confidence in the AAP turnaround continues to work higher. It may take some time, but when operating leverage meets a proven operator and structural demand drivers, good things tend to happen.
Q4 Earnings Breakdown

10 Key Points
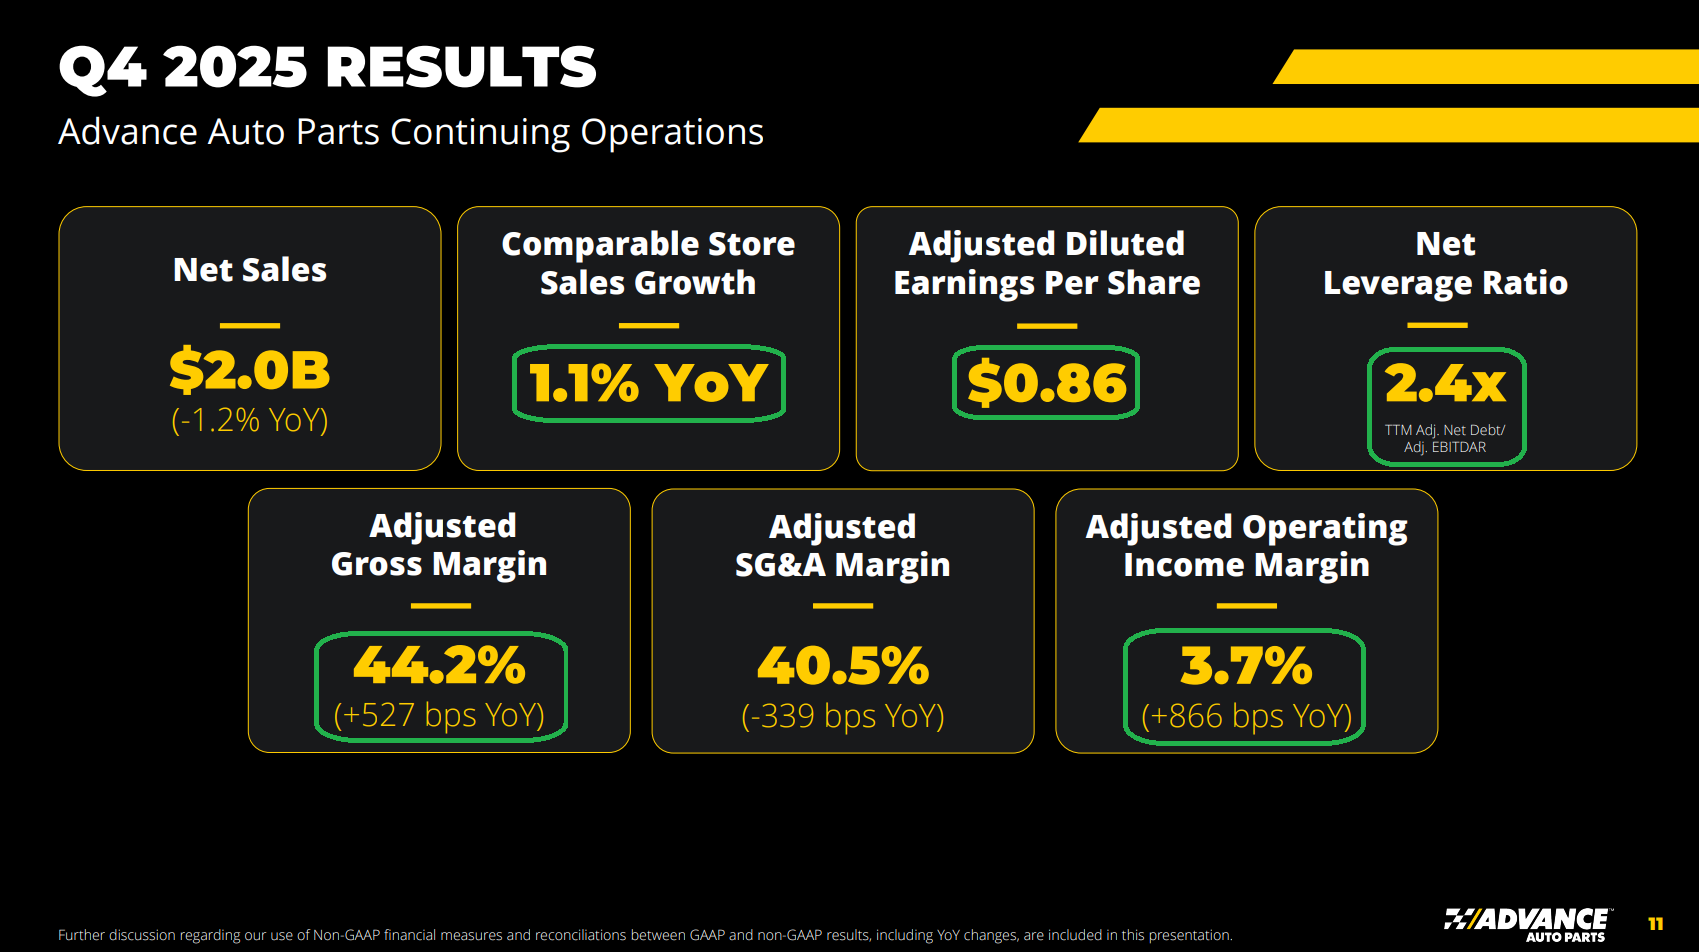
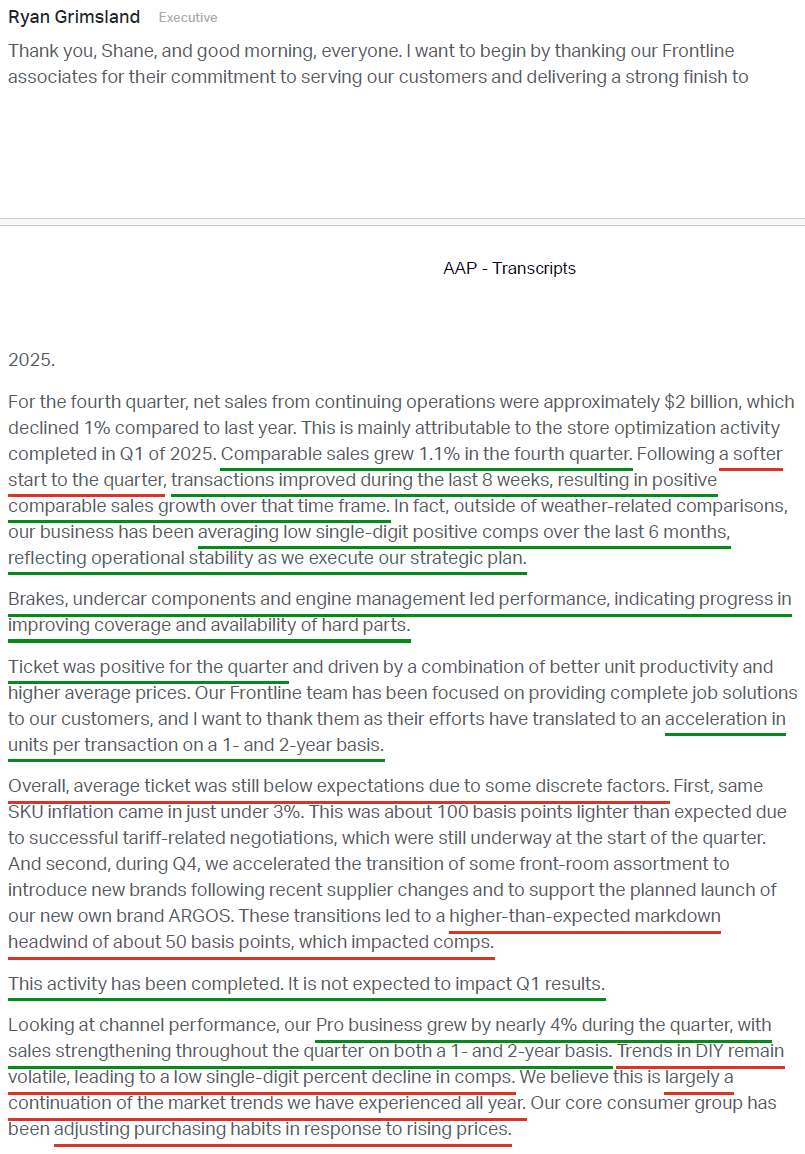
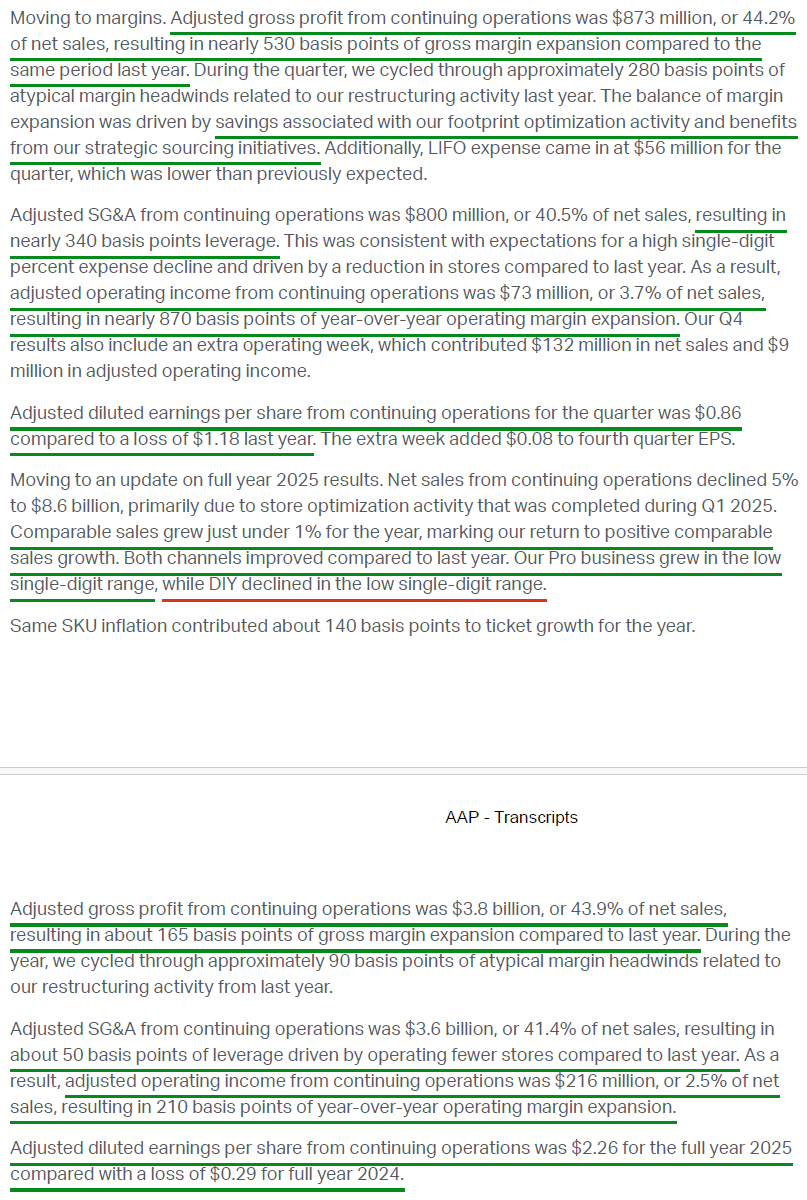
1) Q4 revenue totaled $1.97B (-1.2% Y/Y), ahead of the $1.95B consensus estimate, bringing FY25 revenue to $8.6B (-5.4% Y/Y). Adjusted diluted EPS came in at $0.86 (vs. -$1.18 last year), more than double the $0.41 Street estimate. For FY25, adjusted diluted EPS totaled $2.26 (vs. -$0.29 last year).
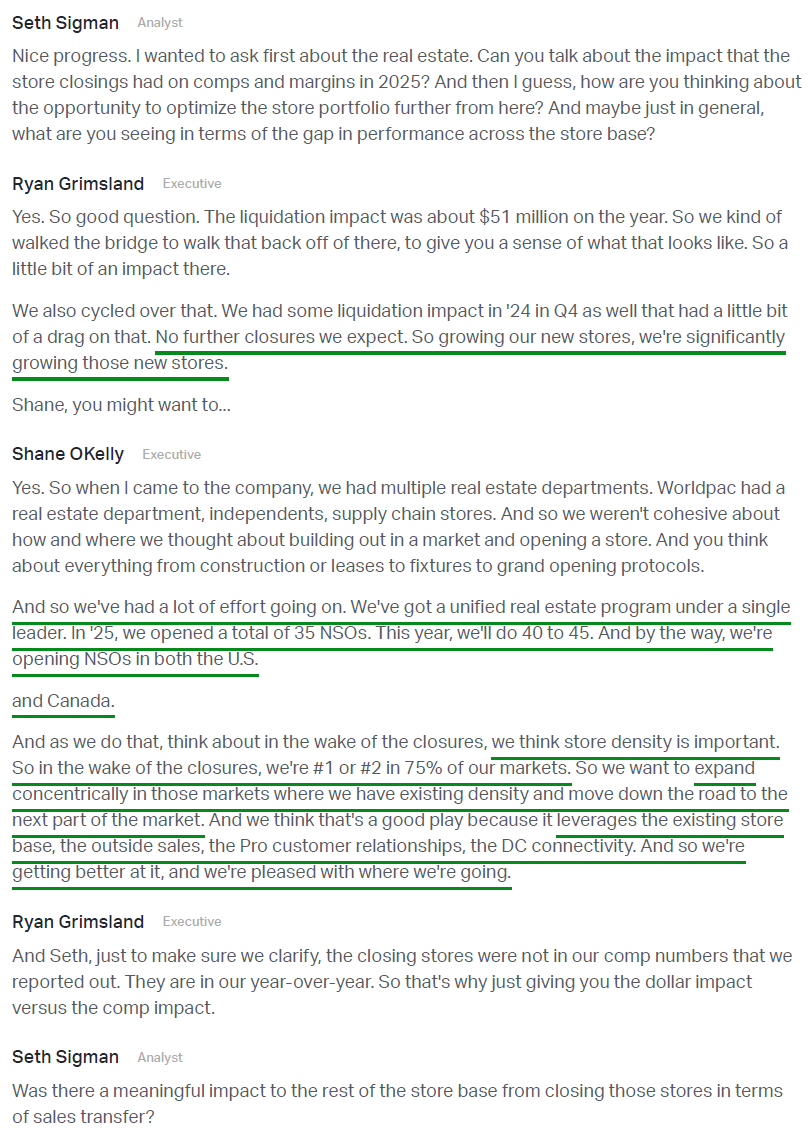
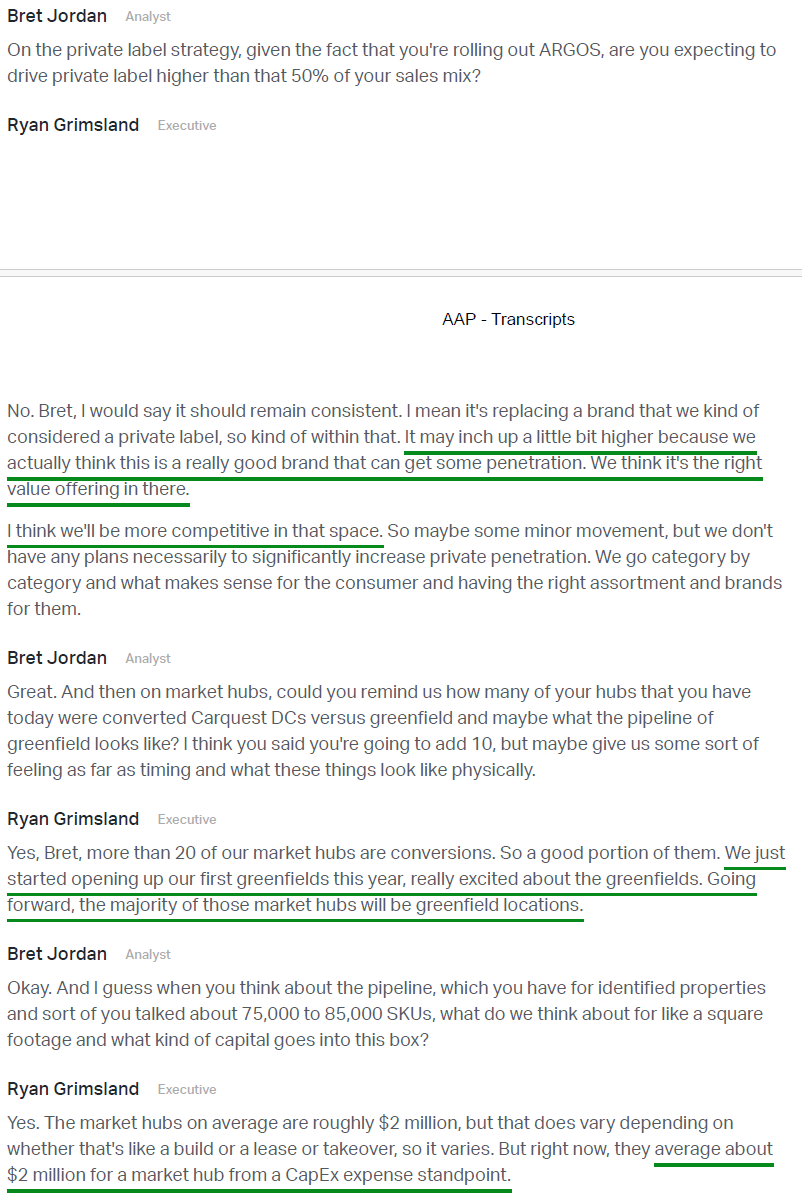
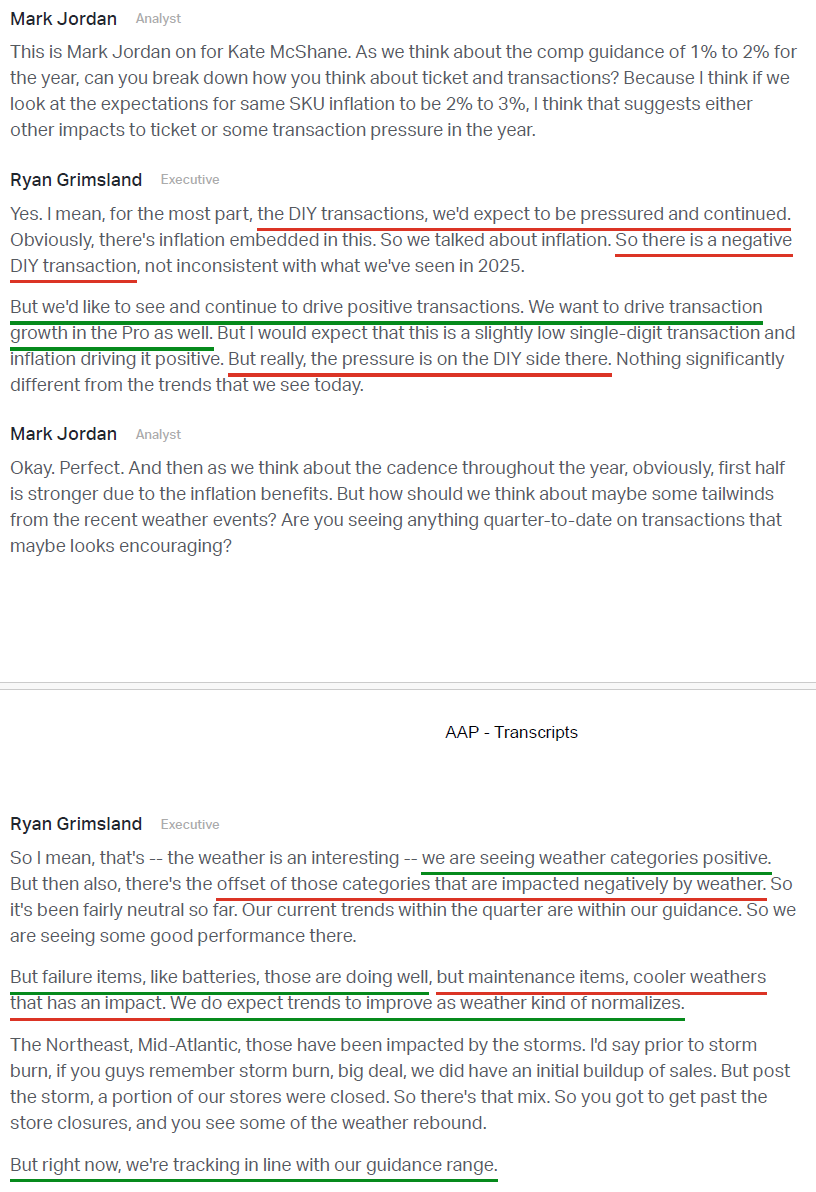
2) Comp sales growth in Q4 was 1.1%, with a slower start to the quarter followed by positive sales performance over the final eight weeks. For FY25, comps accelerated to 0.8%, marking the first full year of positive comp growth after three consecutive years of declines. The Pro channel delivered low single digit growth for the year, while DIY declined low single digits, though both channels improved Y/Y. Importantly, excluding weather related comparisons, the business has averaged low single digit positive comps over the past six months, with acceleration in units per transaction on both a one and two year basis.
3) The Pro channel strengthened as the year progressed and delivered nearly 4% comp sales growth in the quarter. While the channel benefited from store transfer sales tied to closed locations that exceeded initial expectations, it still generated positive growth even excluding those transfers. Performance was supported by improved store availability, which increased from the low 90% range at the start of the year to the high 90% range, along with faster delivery times, reducing average delivery by more than 10 minutes from over 50 minutes at the start of 2025.
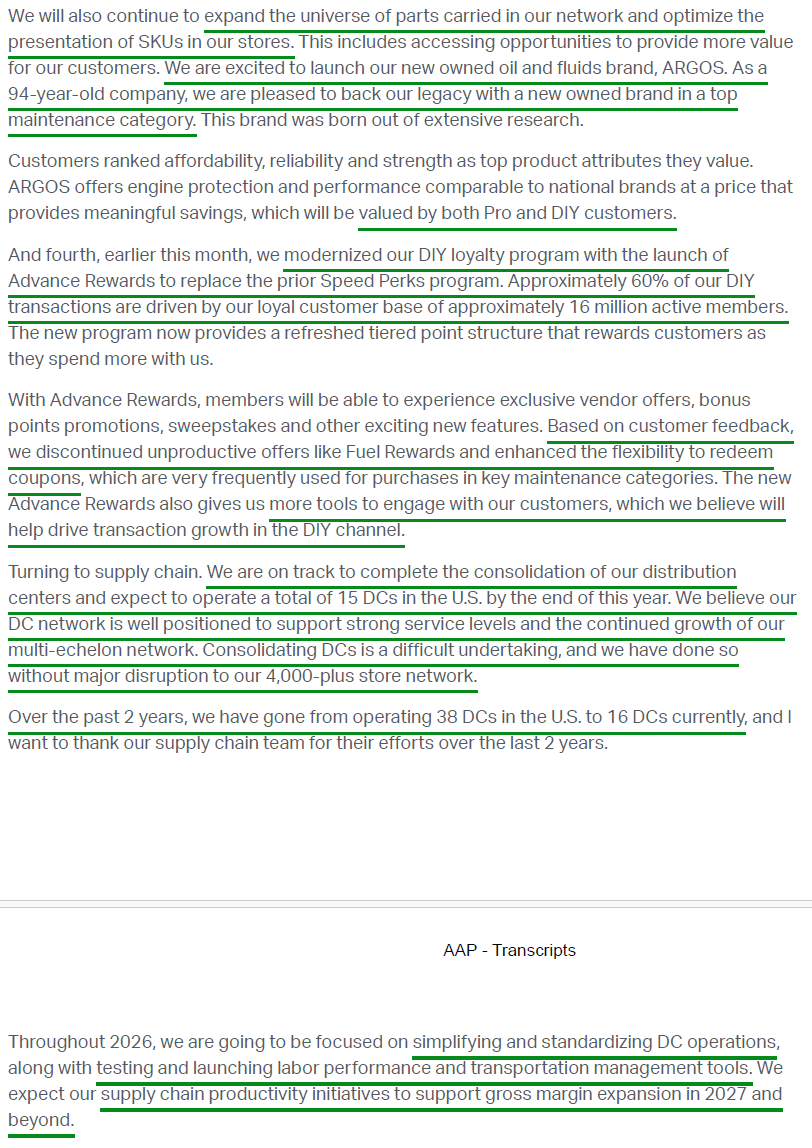
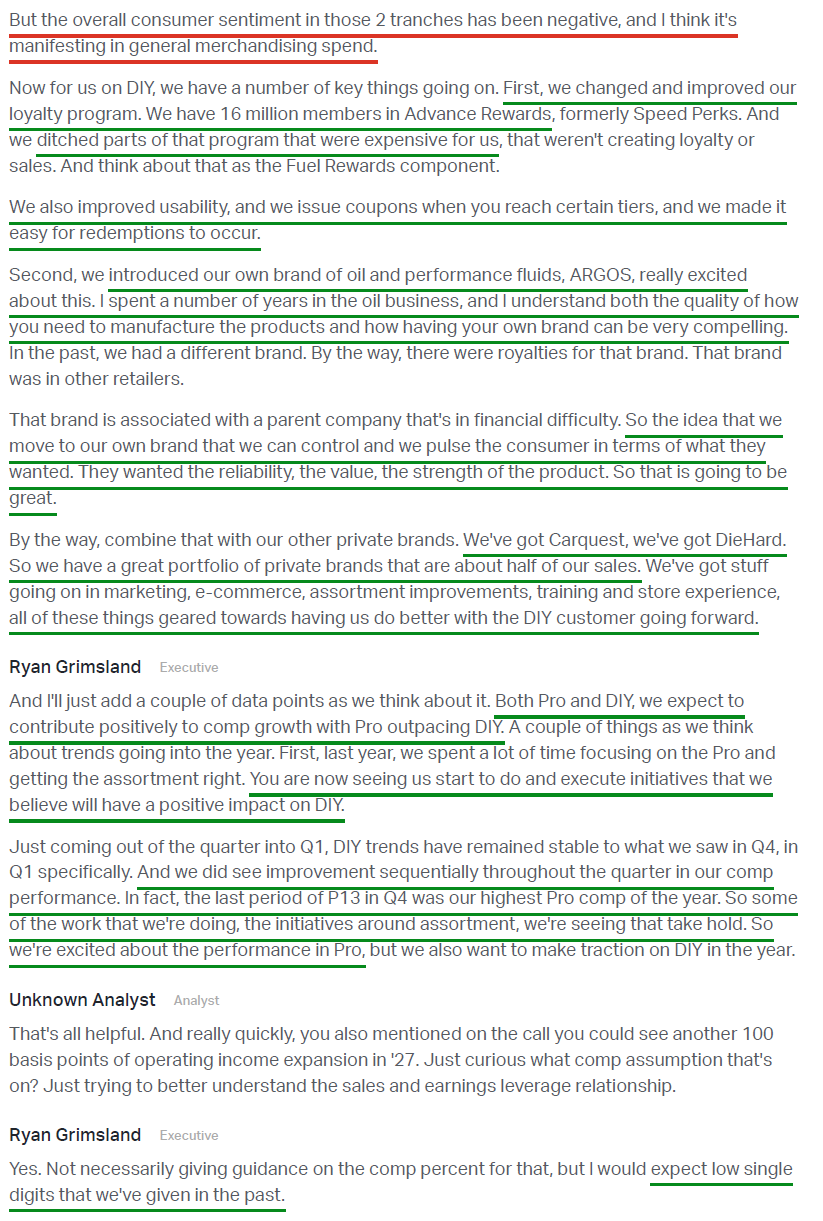
4) DIY trends have remained volatile against a softer consumer backdrop, resulting in a low single digit comp decline for the full year. Management is rolling out several initiatives to drive transaction growth in the channel, including expanding total assortment by 100K SKUs, modernizing the DIY loyalty program, where ~60% of transactions come from a base of ~16M active members, and launching AAP’s new owned brand of oil and performance fluids, ARGOS, which they view as a strong brand capable of driving meaningful penetration in the category.
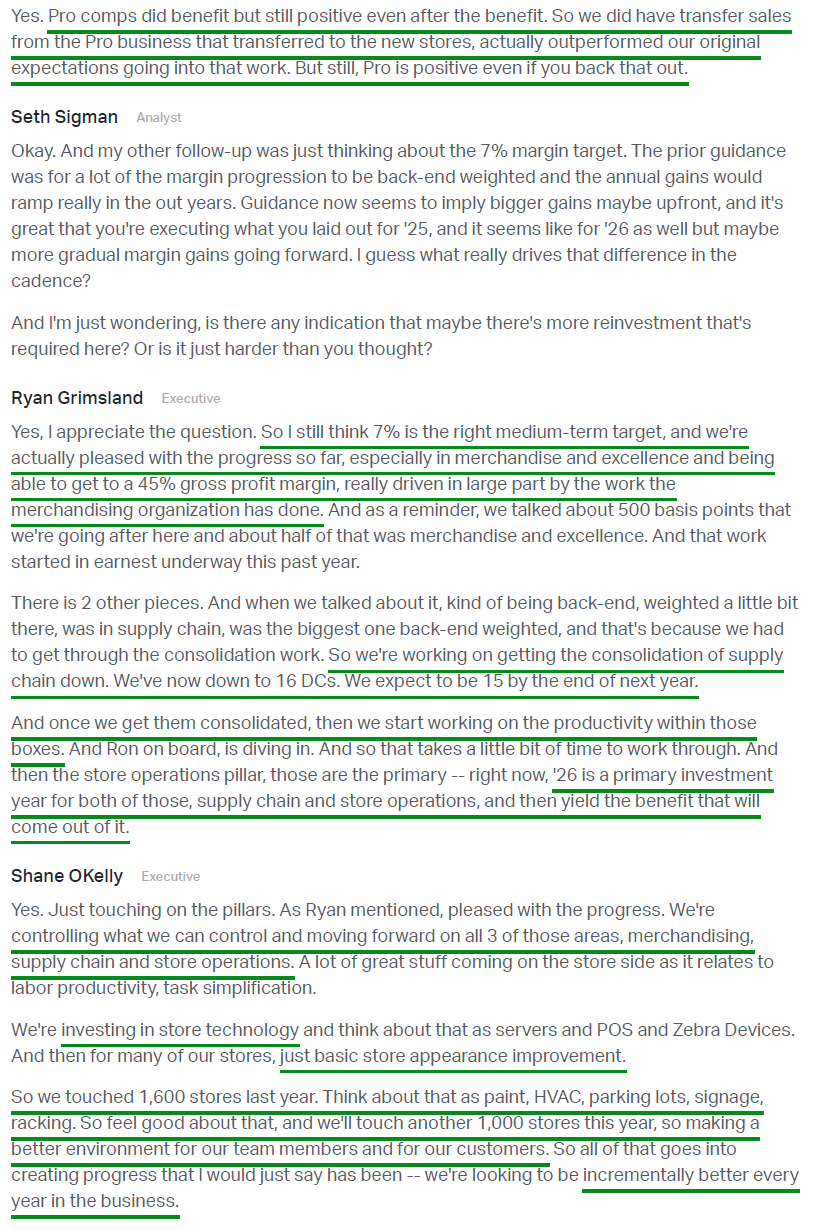
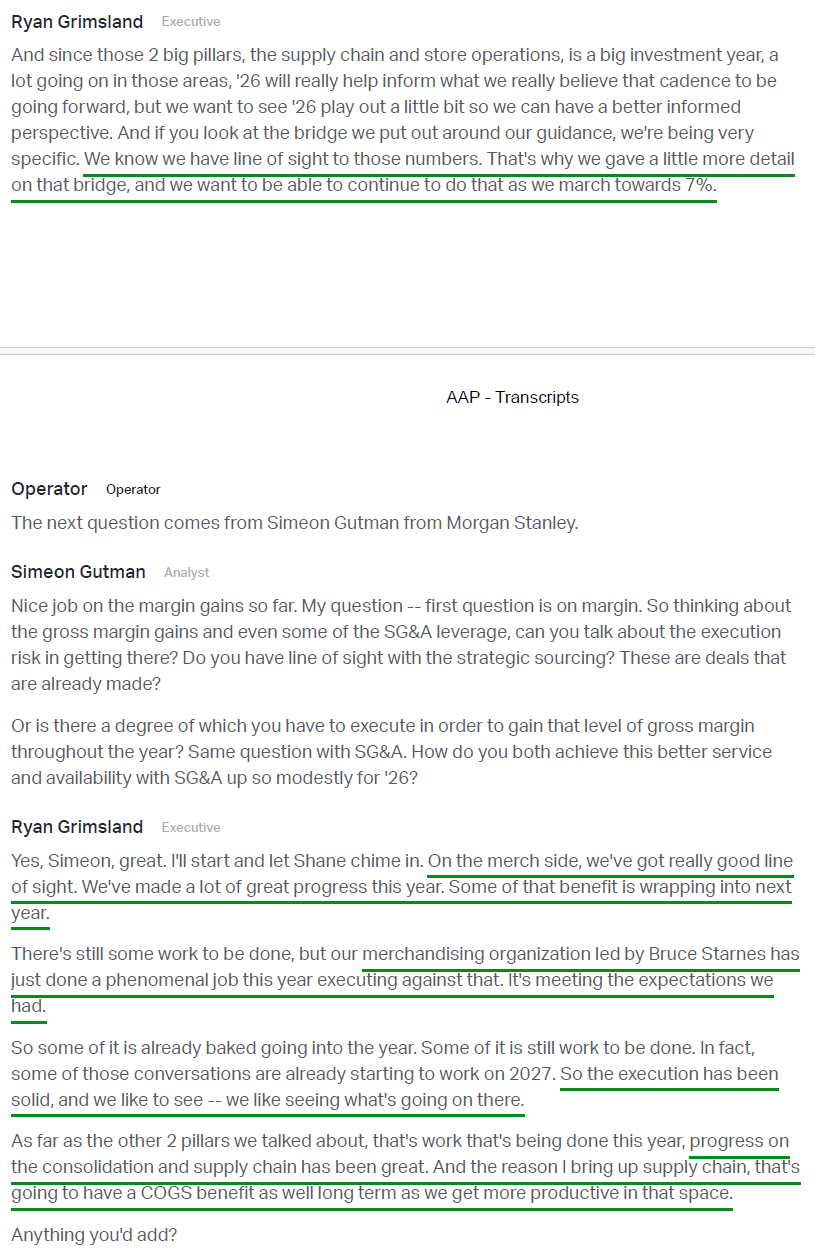
5) The most important metric in the AAP turnaround, adjusted operating margin, came in at 3.7% in Q4 (+866 bps Y/Y), ahead of the 3.2% consensus estimate. That brought FY25 margins to 2.5% (+213 bps), in line with prior guidance and marking ~500 bps of expansion since new leadership stepped in during 2H FY23. Management is guiding to FY26 operating margins of 3.8% to 4.5% (4.15% midpoint), implying another 165 bps of expansion and ahead of the 3.6% consensus estimate, as the company marches toward its medium term margin target of ~7%.
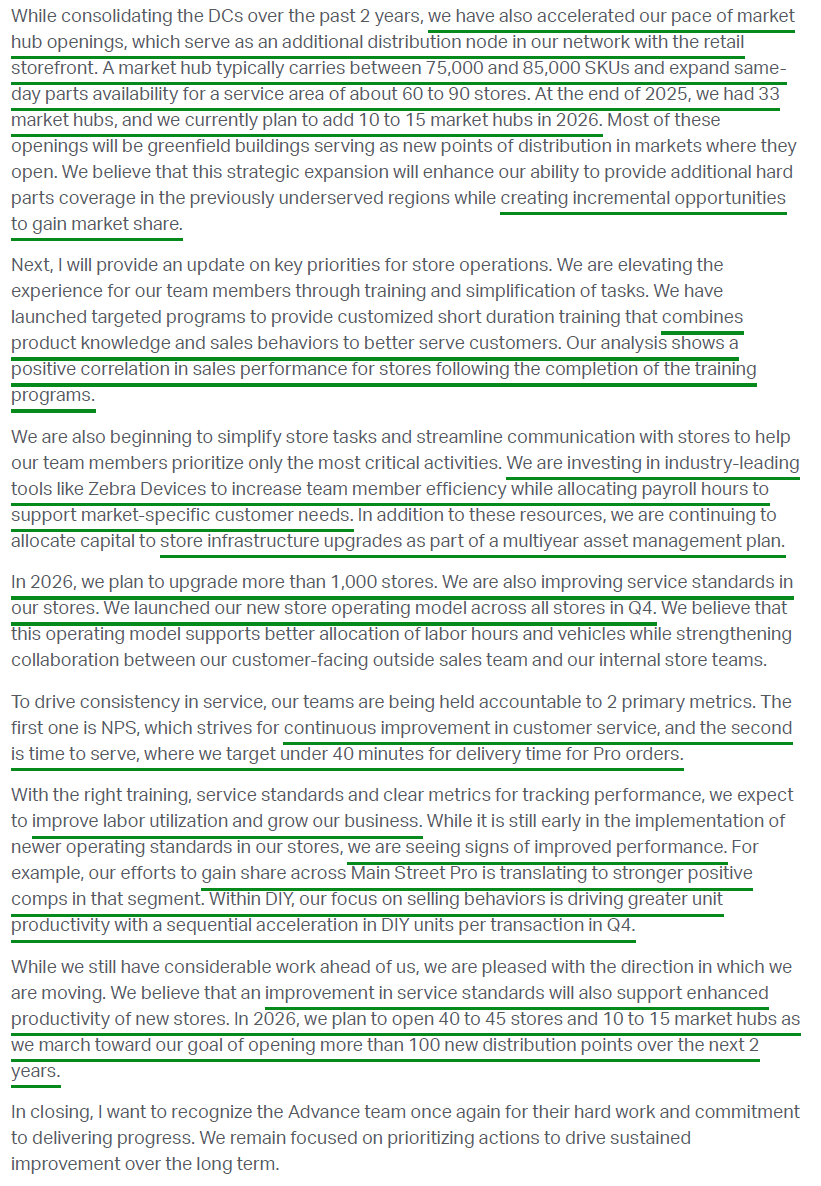
6) The supply chain consolidation initiative continues to make steady progress, with distribution centers reduced to 16 from 38 at the end of 2023. Management expects to complete the move to 15 DCs by the end of 2026, after which the focus will shift to simplifying and standardizing operations to help drive gross margin expansion. AAP also opened 14 new market hubs in 2025 (75K to 80K SKUs, same day delivery to 60 to 90 stores, ~100 bps comp lift), bringing the total to 33, with another 10 to 15 planned for 2026. This keeps AAP on pace to reach its 60 hub target by 2027 and unlock further market share gains.
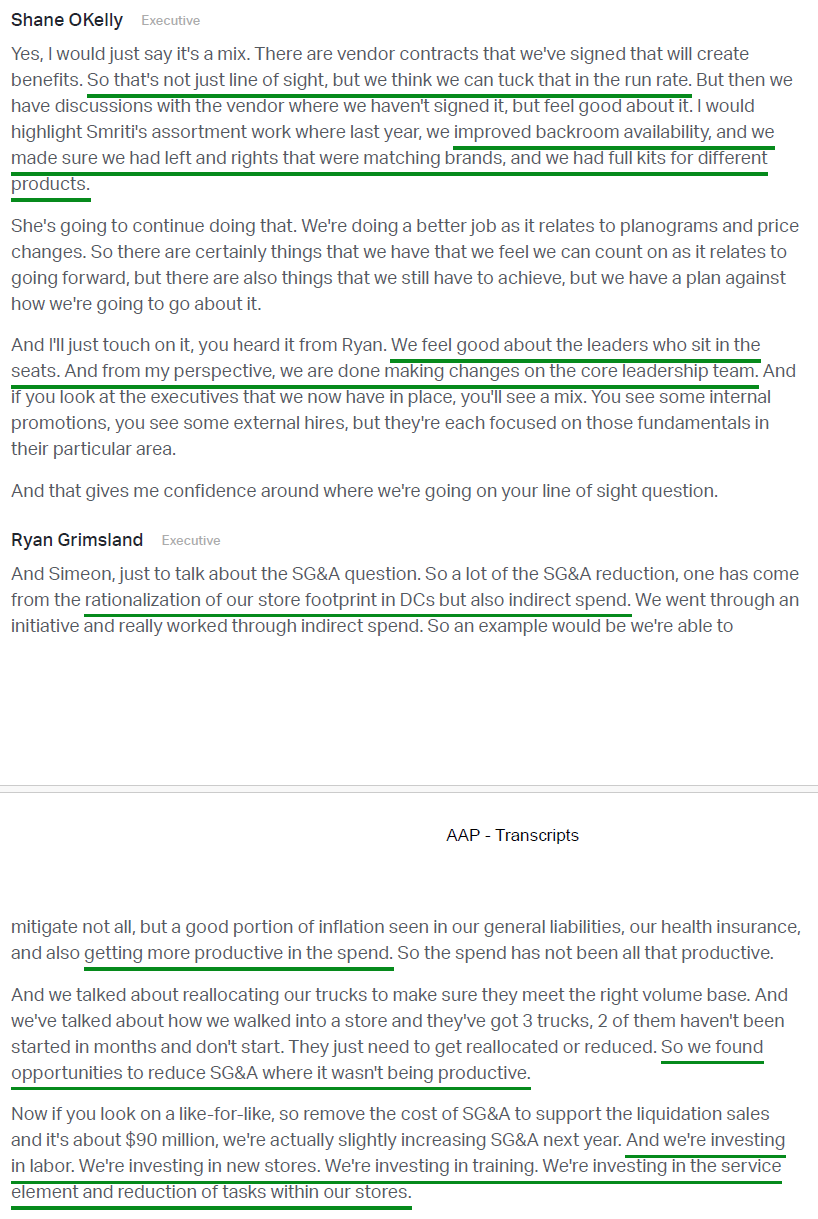
7) AAP completed its store footprint rationalization in 2025, exiting more than 500 corporate and 200 independent stores, all underperforming locations. Total store count ended the year at 4,305. These closures unlocked ~$70M in operating costs and strengthened market positioning, with AAP now ranking #1 or #2 in over 75% of its markets. With the closures complete, management is now accelerating growth, targeting 40 to 45 new stores in 2026 versus 35 in 2025, as AAP moves toward adding more than 100 new distribution points over the next two years.
8) Management invested nearly $90M in long overdue store infrastructure upgrades in 2025, refreshing paint, HVAC systems, parking lots, signage, and racking across more than 1,600 locations. Another 1,000+ stores are slated for improvements in 2026, with the goal of creating a better environment for both team members and customers.
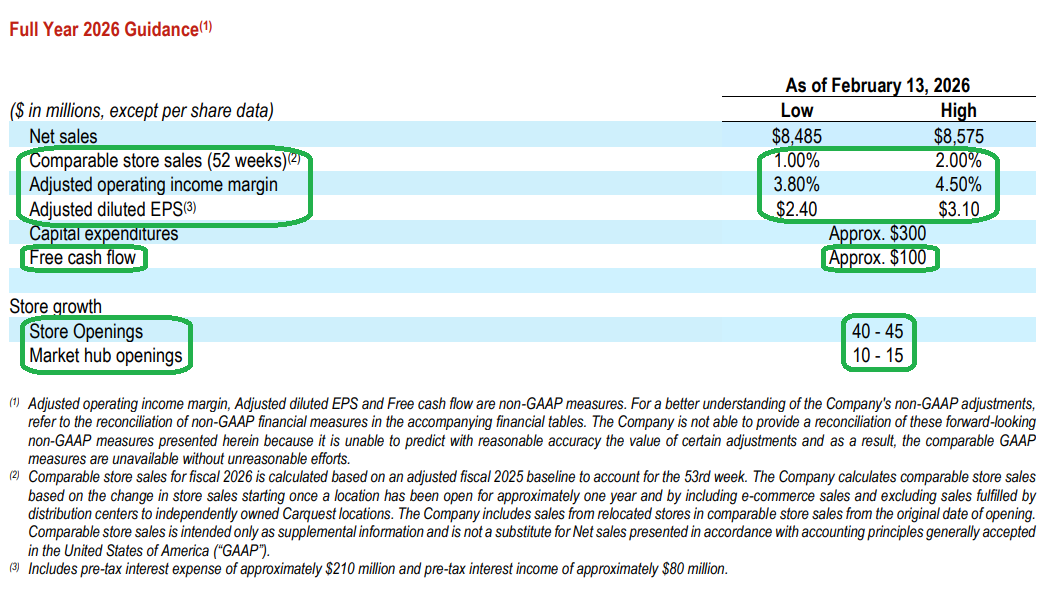
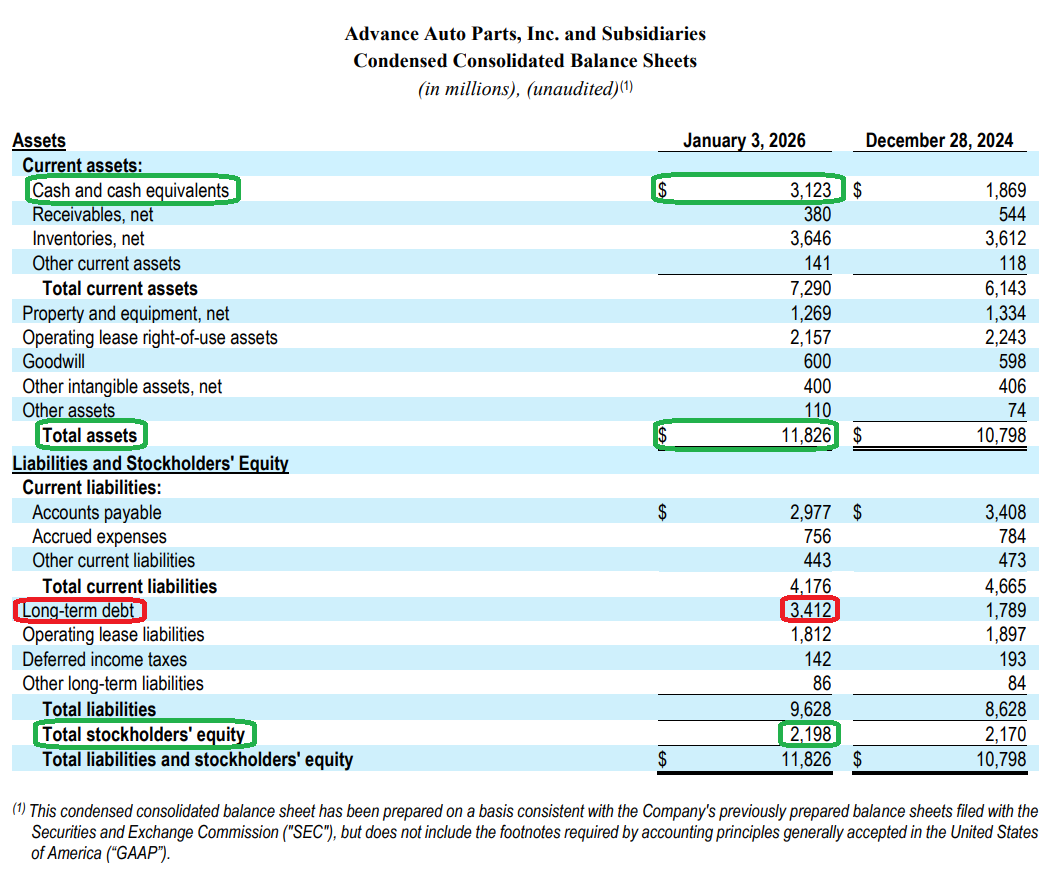
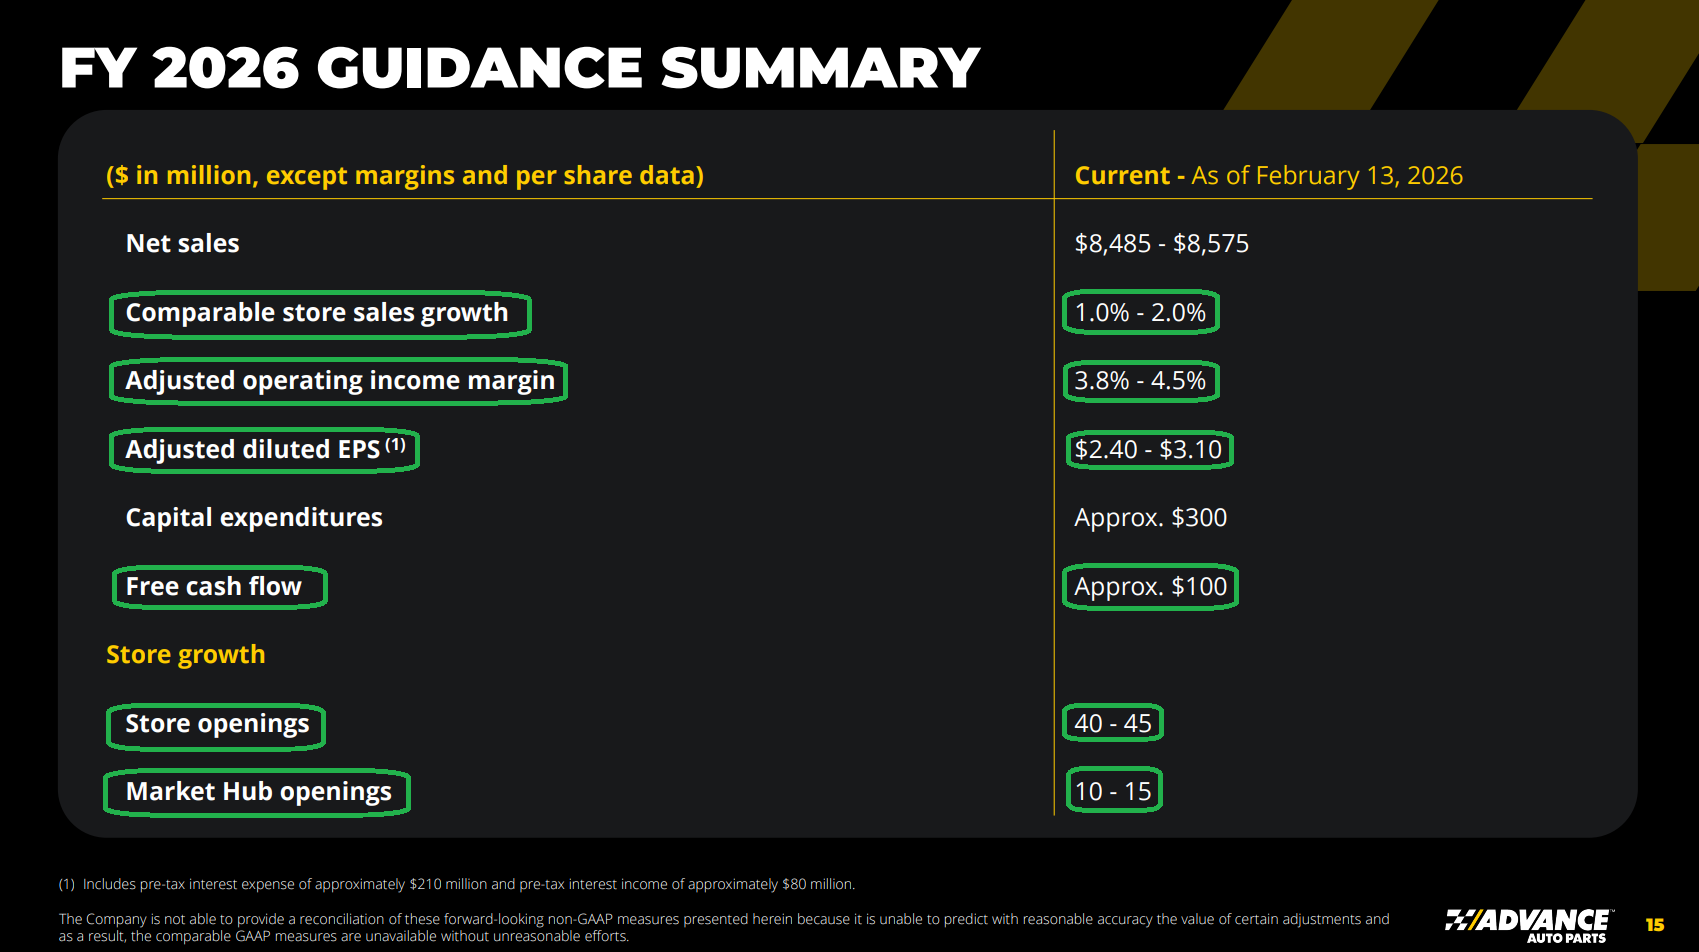
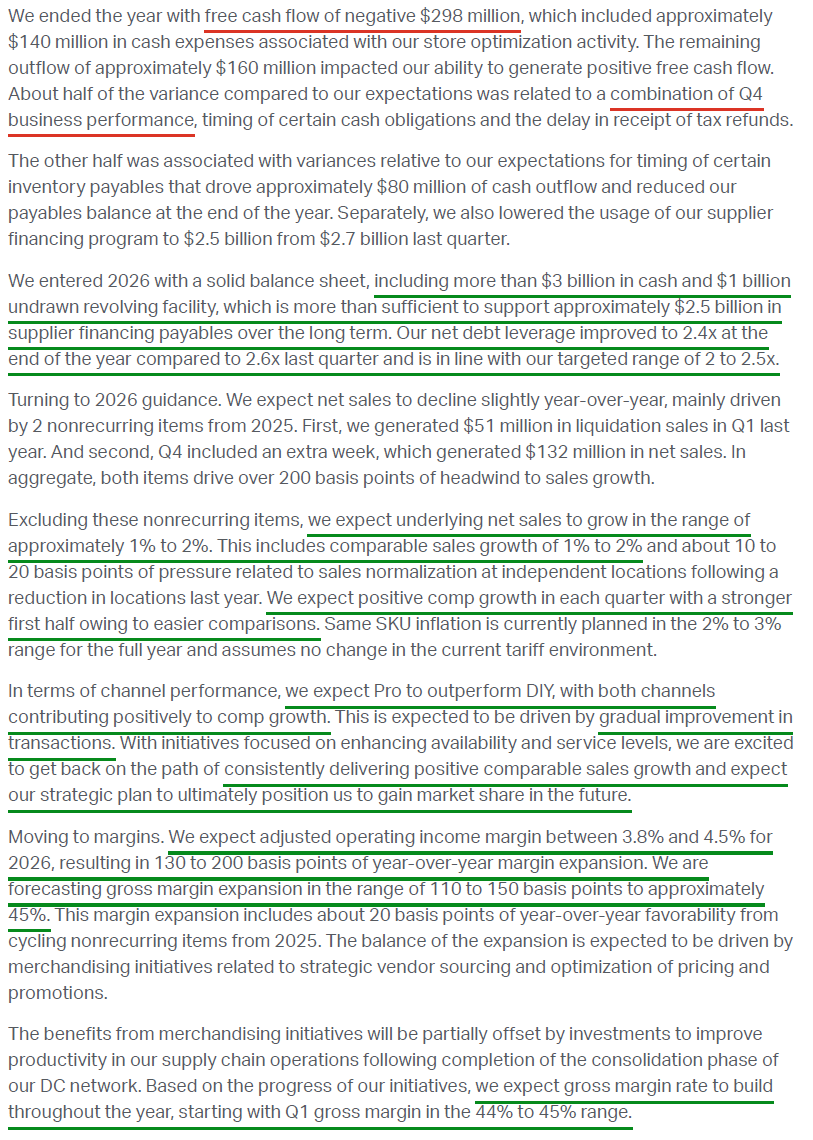
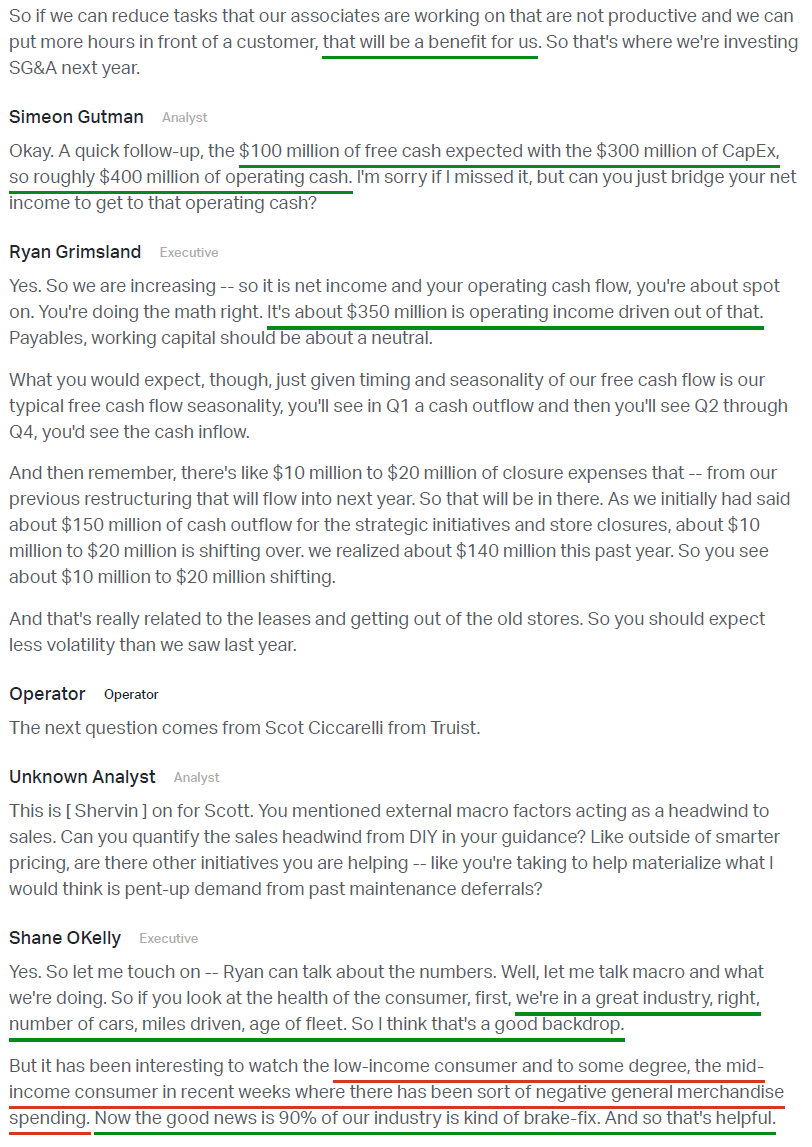
9) Net cash used in operating activities was $46M in 2025, compared to $141M provided by operating activities in 2024. Free cash flow was an outflow of $298M versus an outflow of $40M in 2024, primarily driven by $140M of cash restructuring charges in Q4. Management expects to return to positive free cash flow of ~$100M in 2026, even with higher capex of ~$300M compared to $252M in 2025.
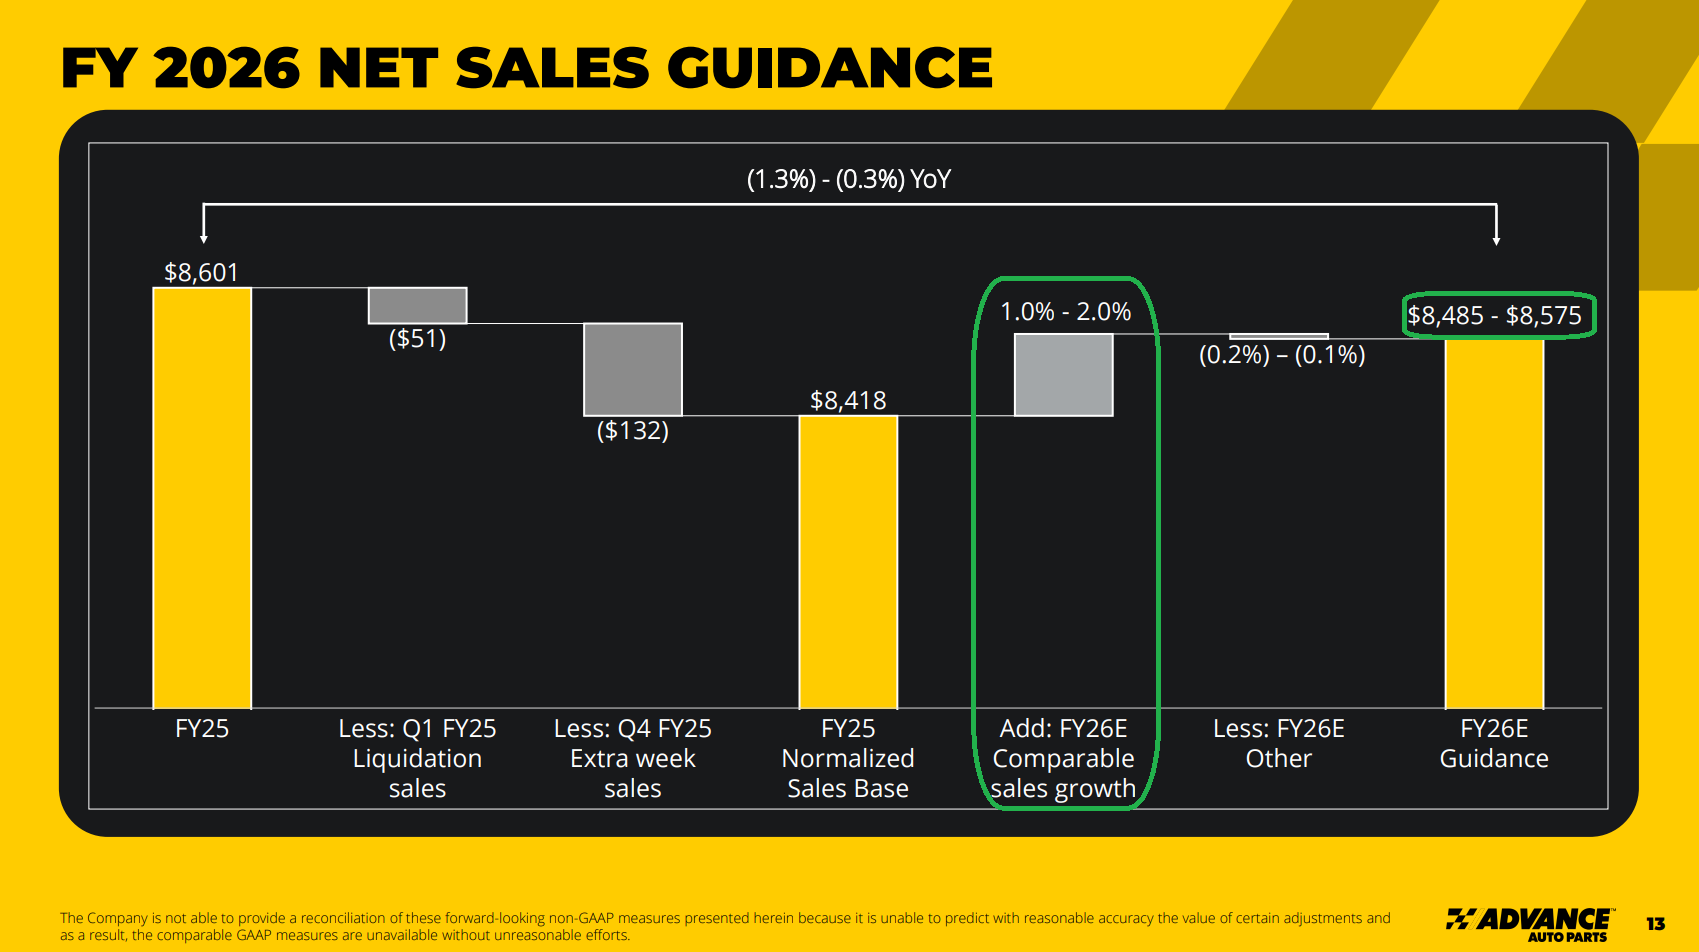
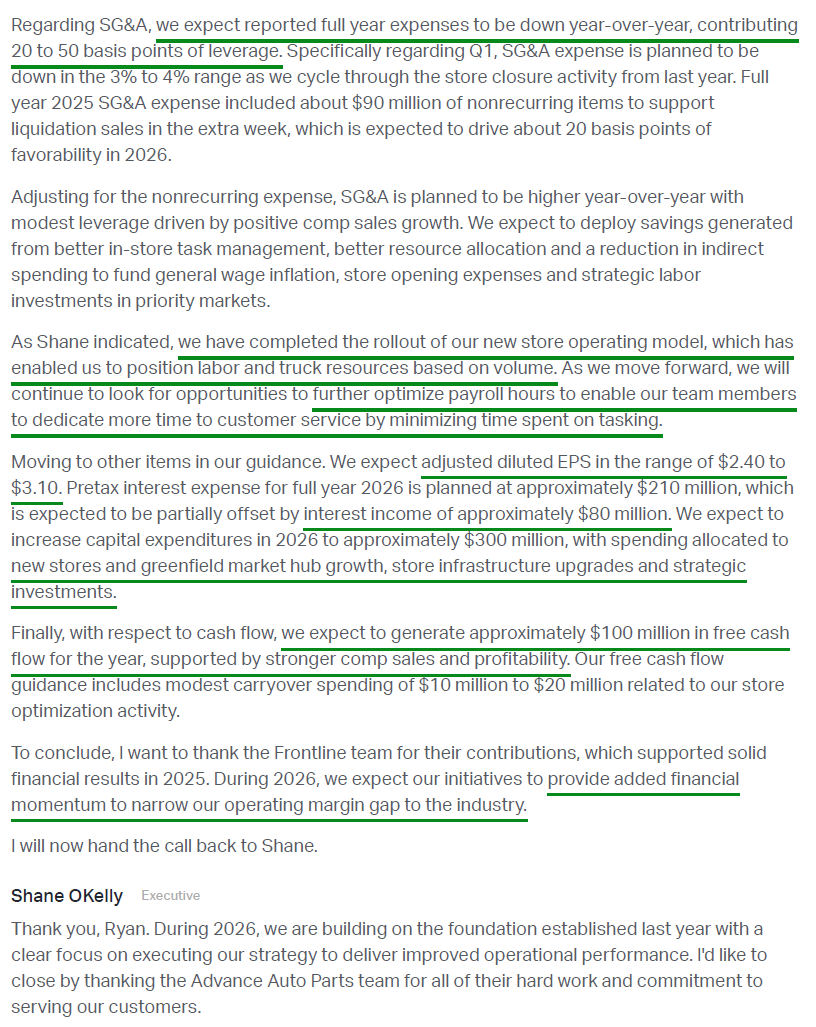
10) Management is guiding to 2026 net sales of $8.49B to $8.58B, with comp sales growth accelerating to 1.0% to 2.0%. The Pro channel is expected to outperform DIY once again, though both channels are projected to post positive growth Y/Y and in each quarter. Adjusted operating margin is expected to reach 3.8% to 4.5%, with at least another 100 bps of expansion anticipated in 2027, marking a third consecutive year of 100+ bps improvement. That implies operating margins of ~5.15% in 2027, below the original 7% target, though management continues to view 7% as the appropriate medium term goal and attributes the timing difference to pacing rather than any change in strategic execution. Adjusted diluted EPS is expected to come in at $2.40 to $3.10 ($2.75 midpoint), ahead of the $2.67 consensus estimate.
Earnings Call Highlights
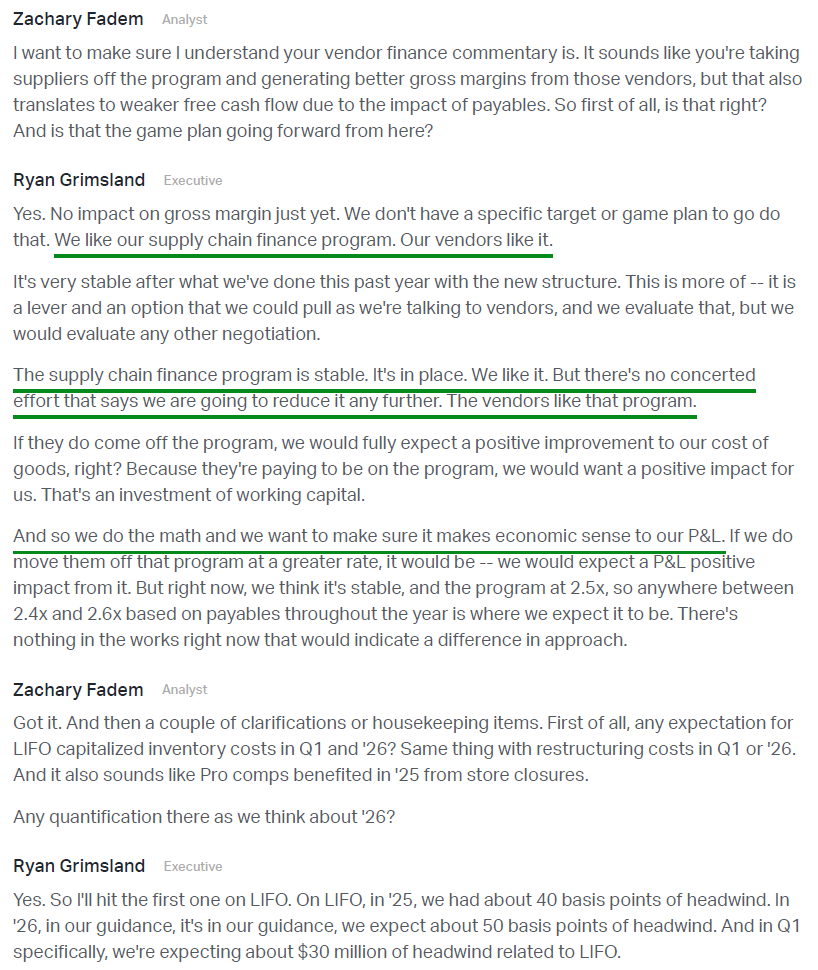
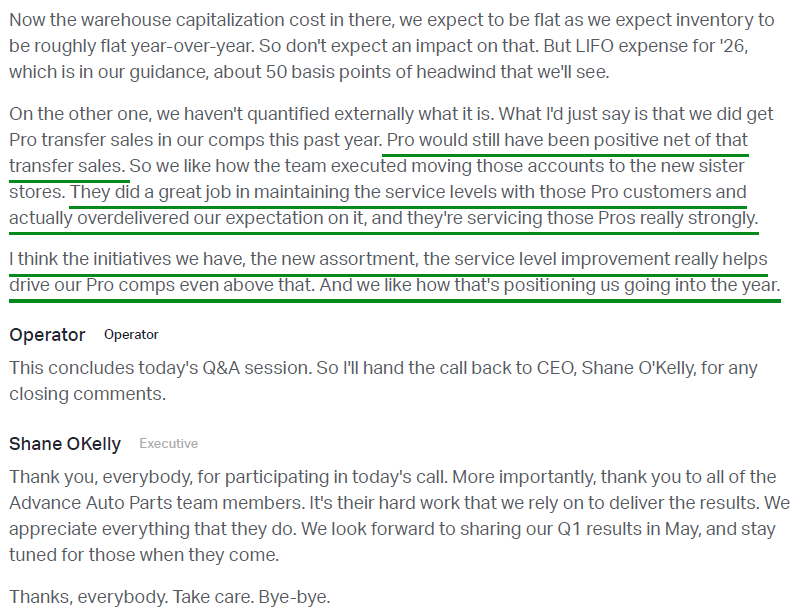
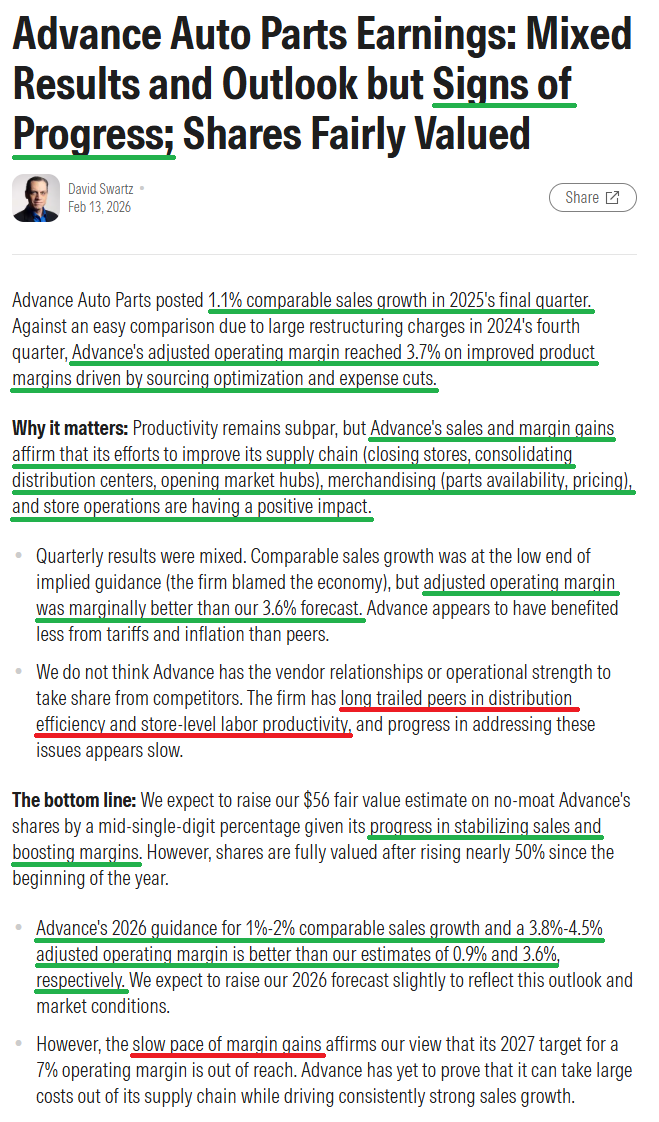
Morningstar Analyst Note
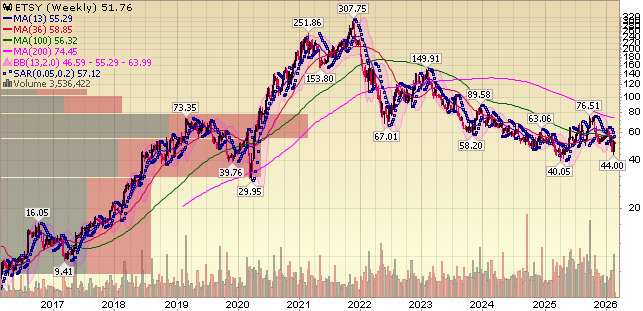
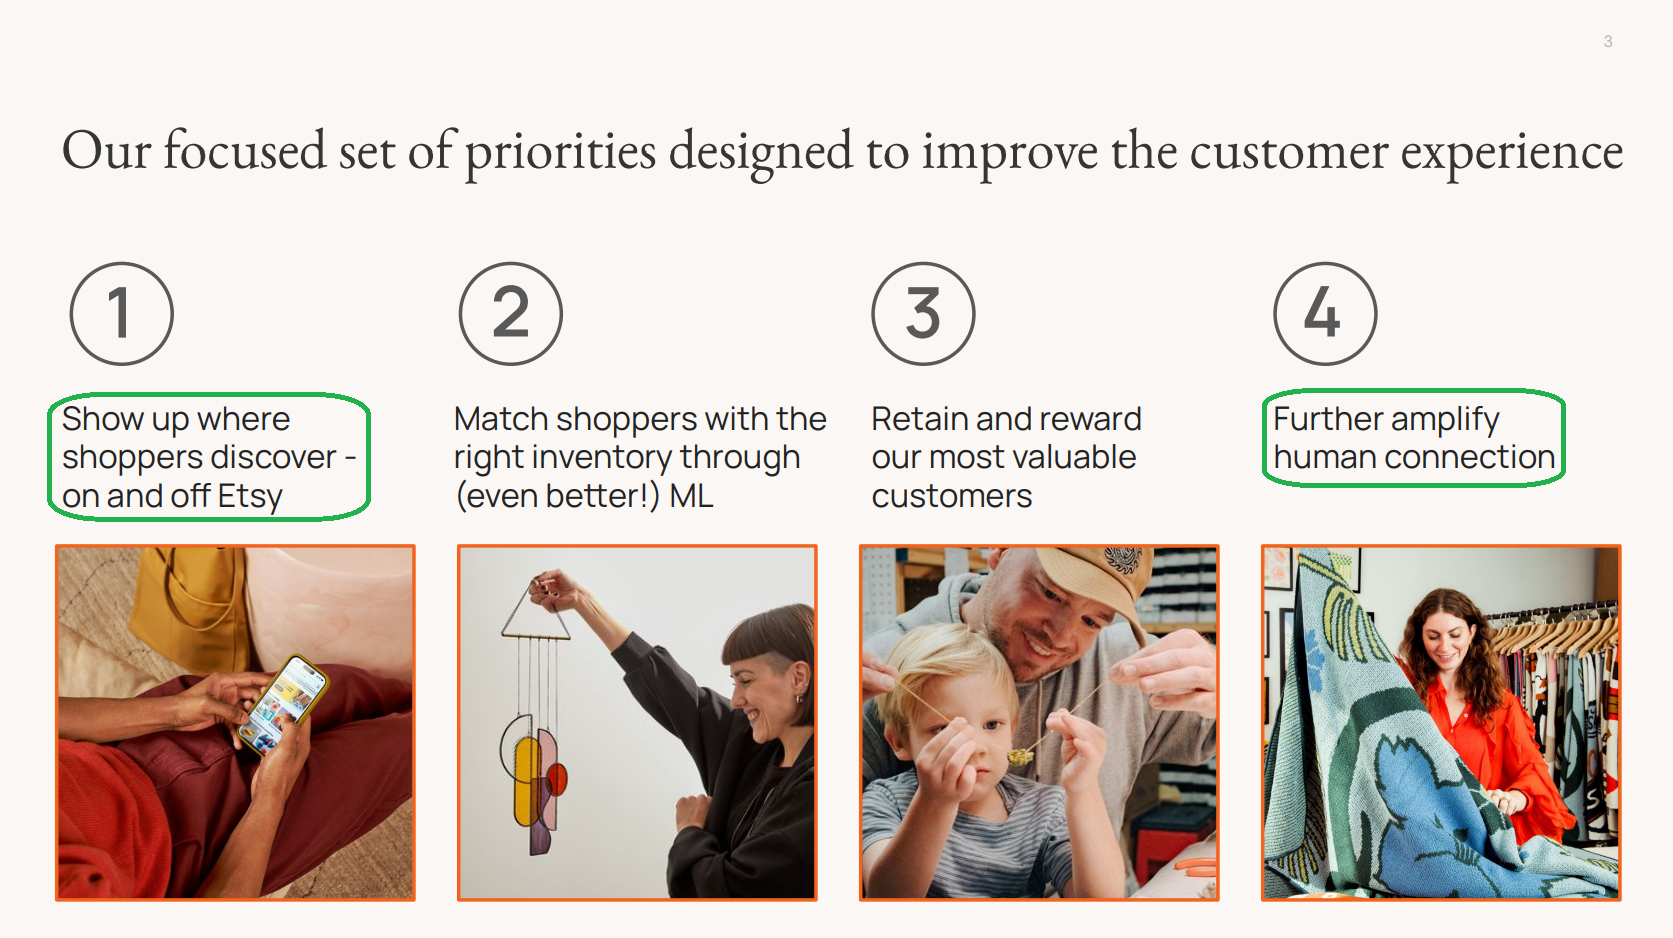
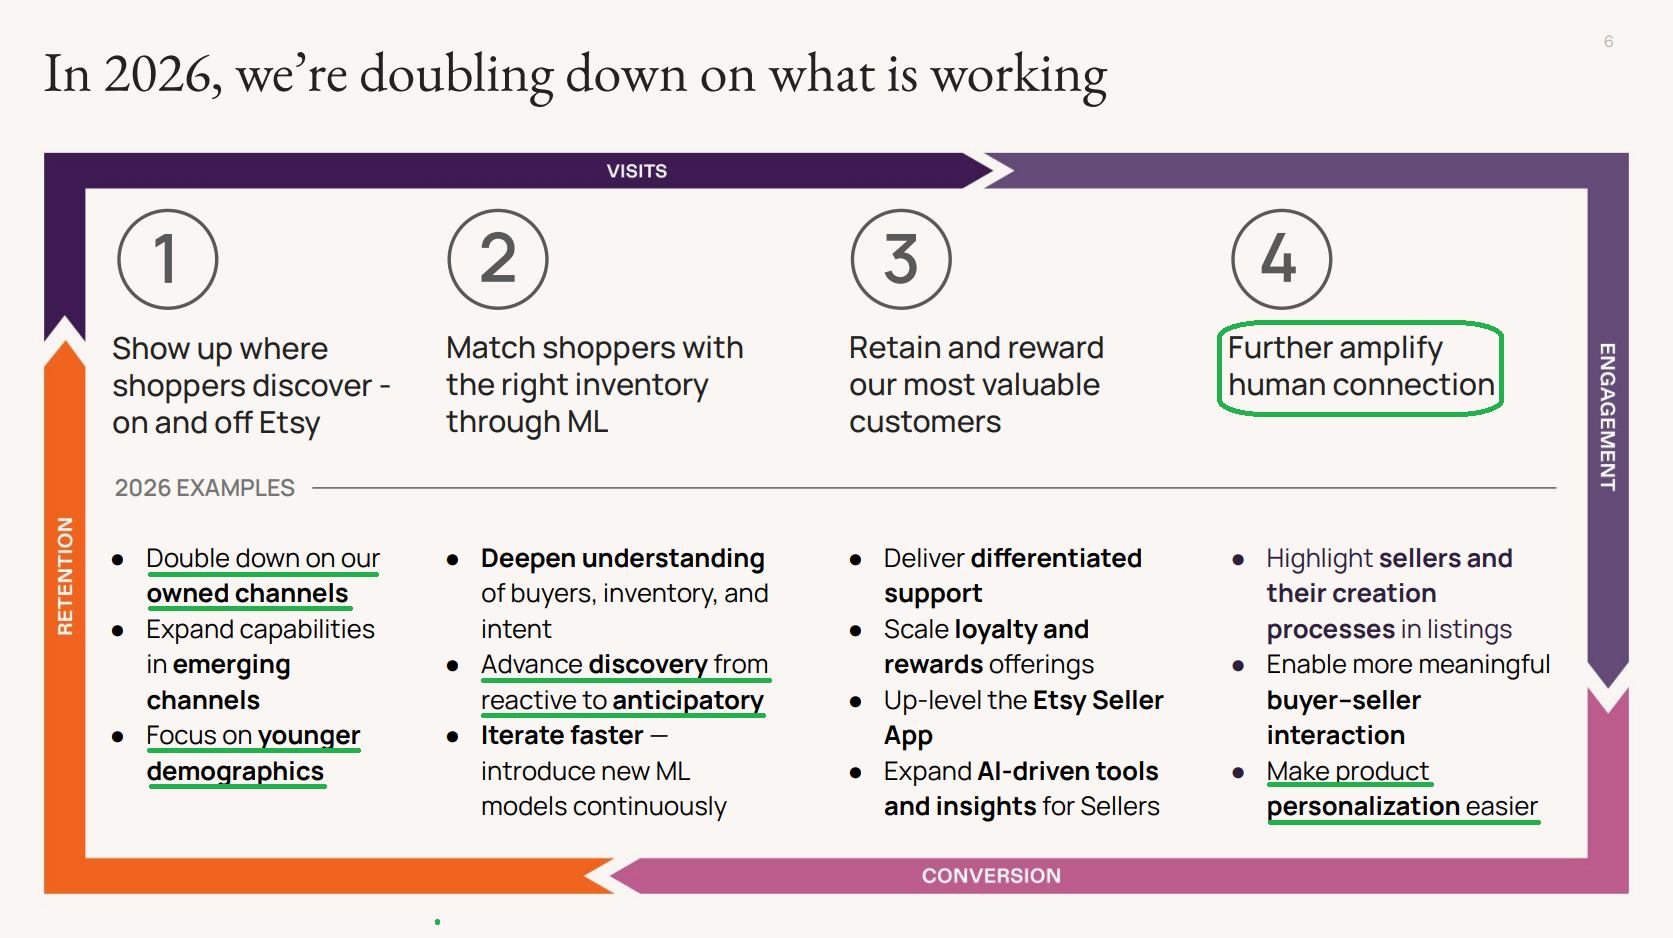
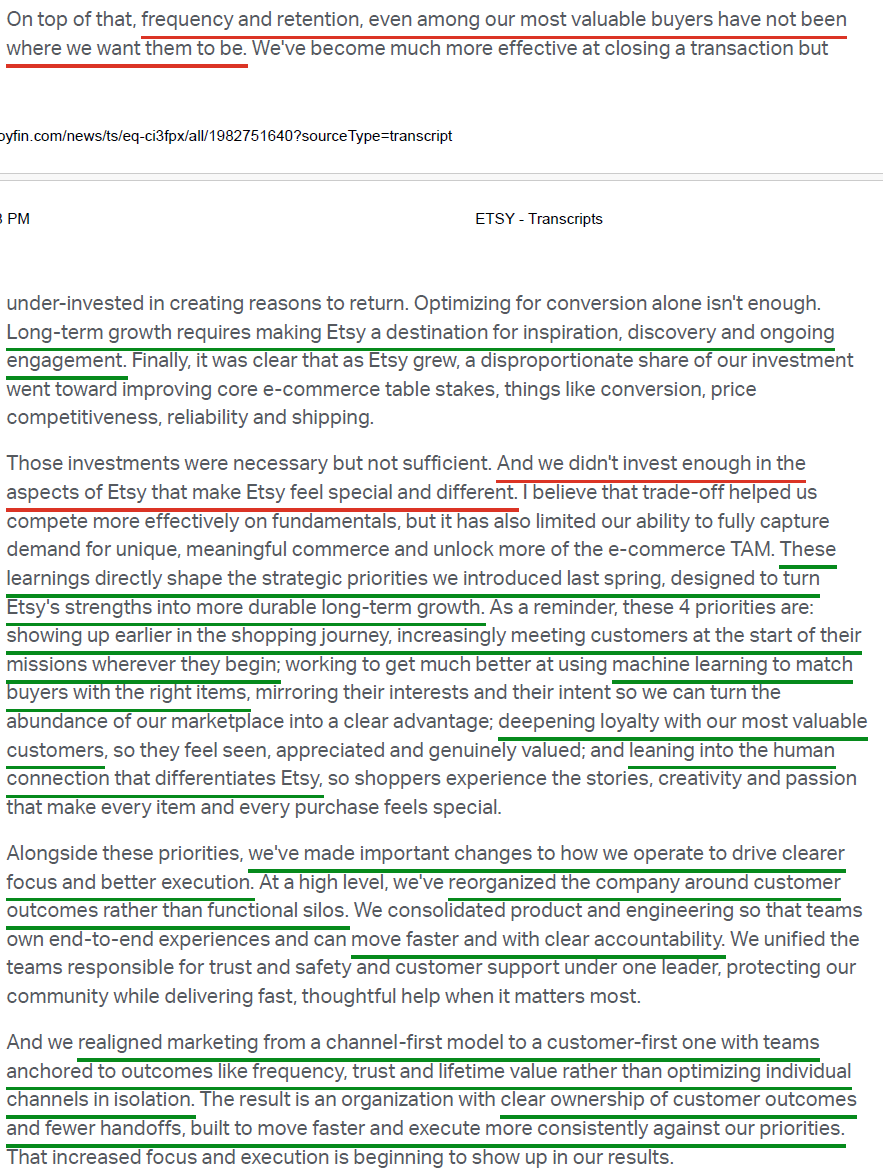
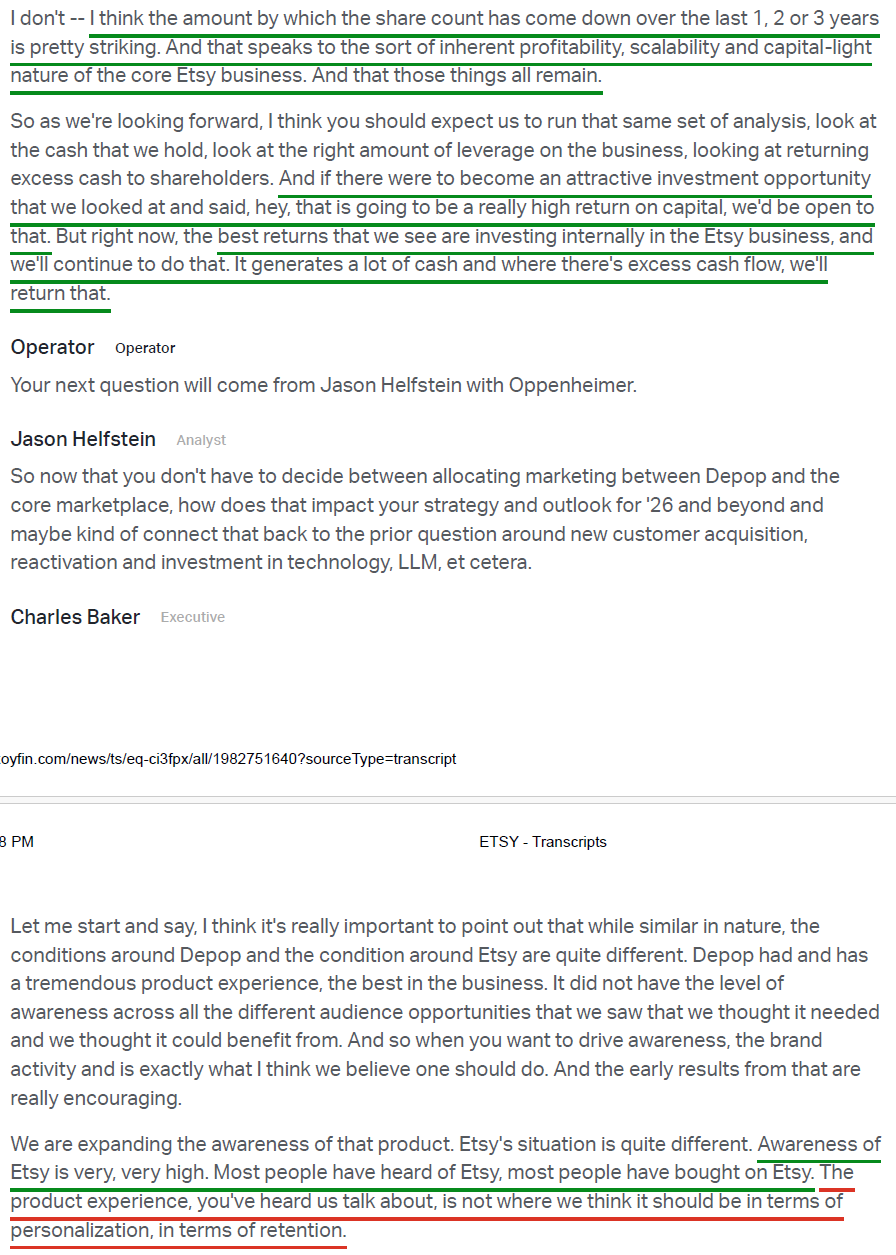
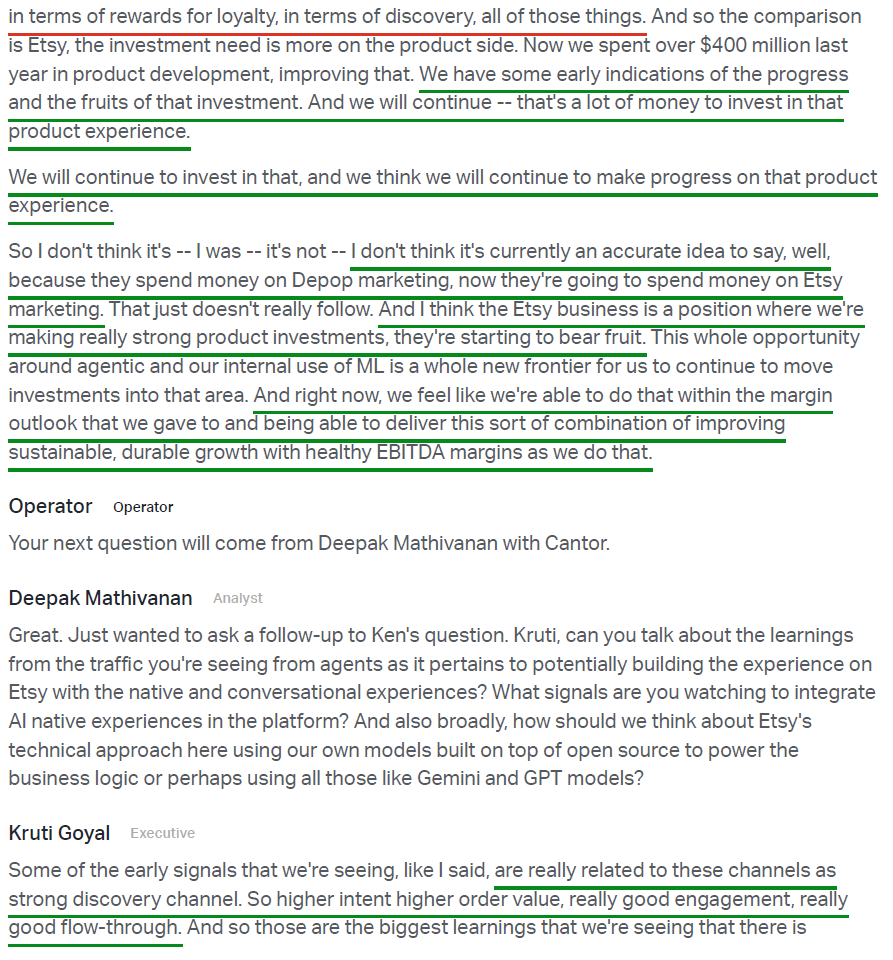
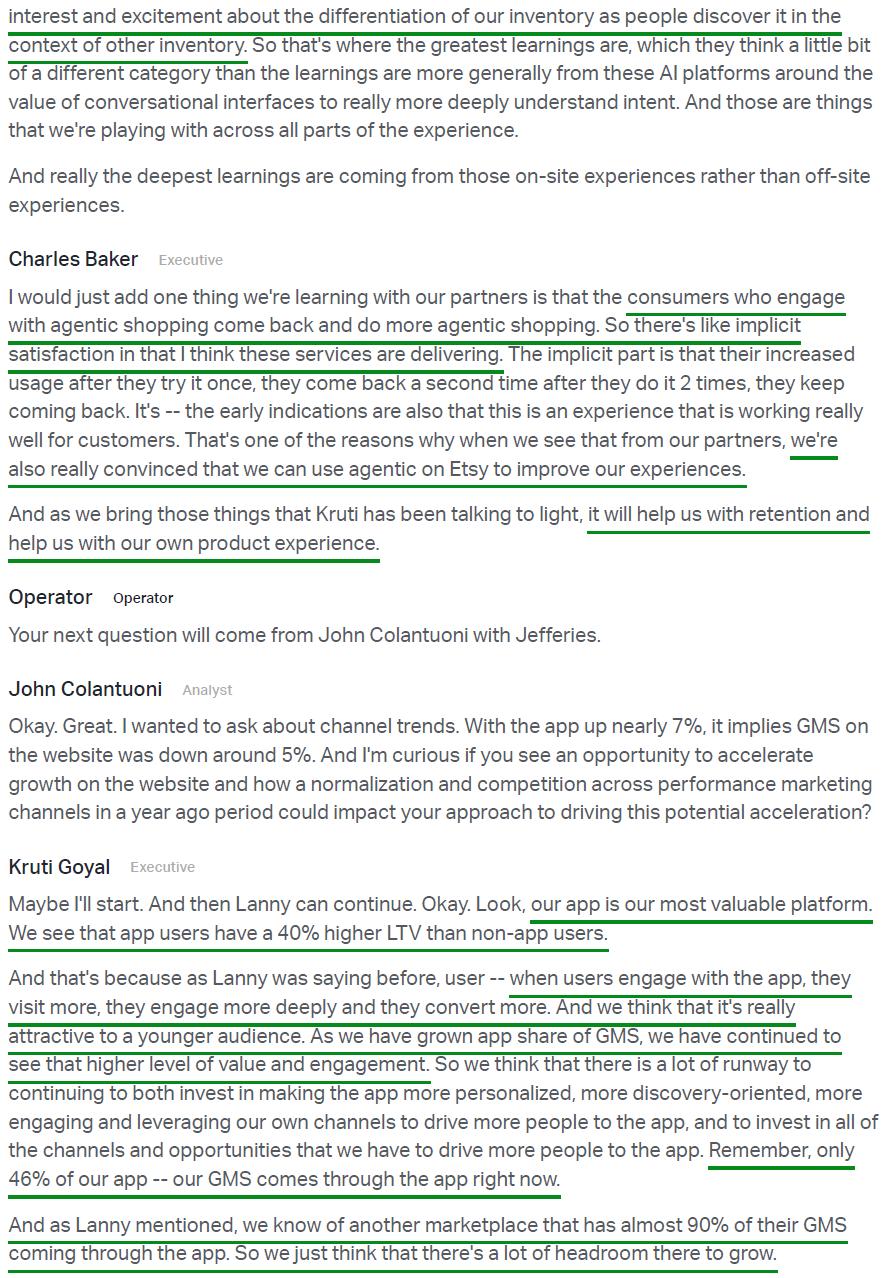
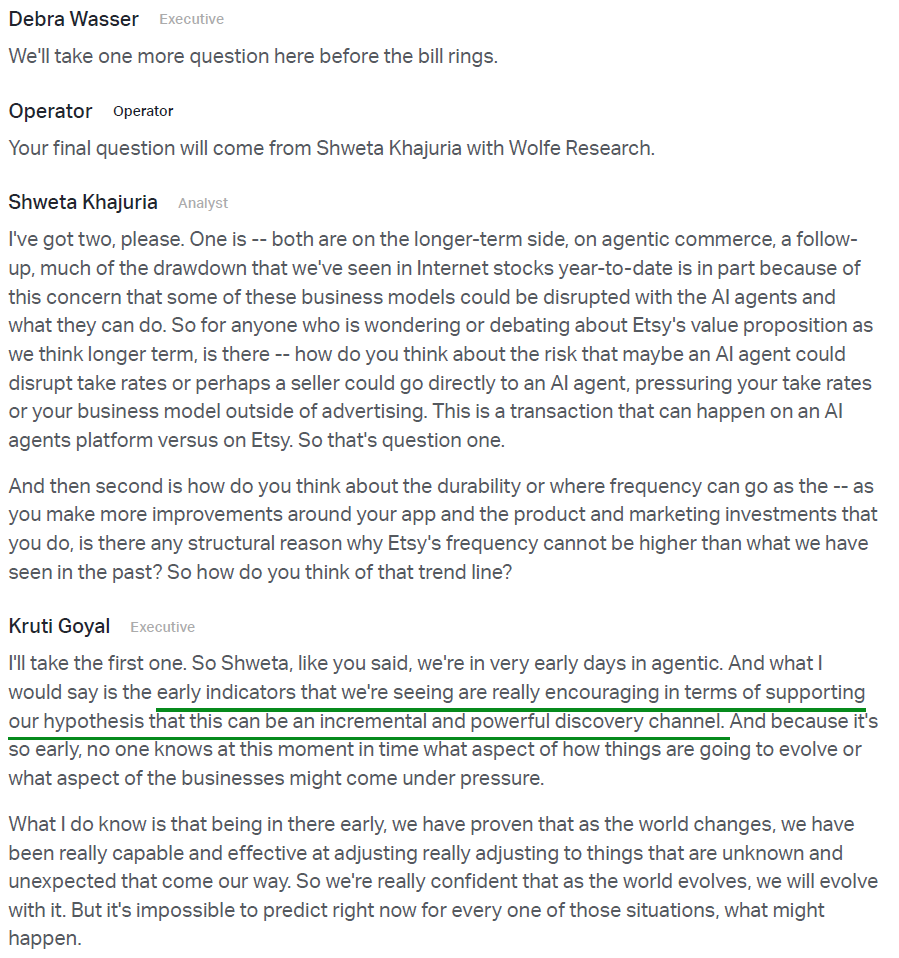
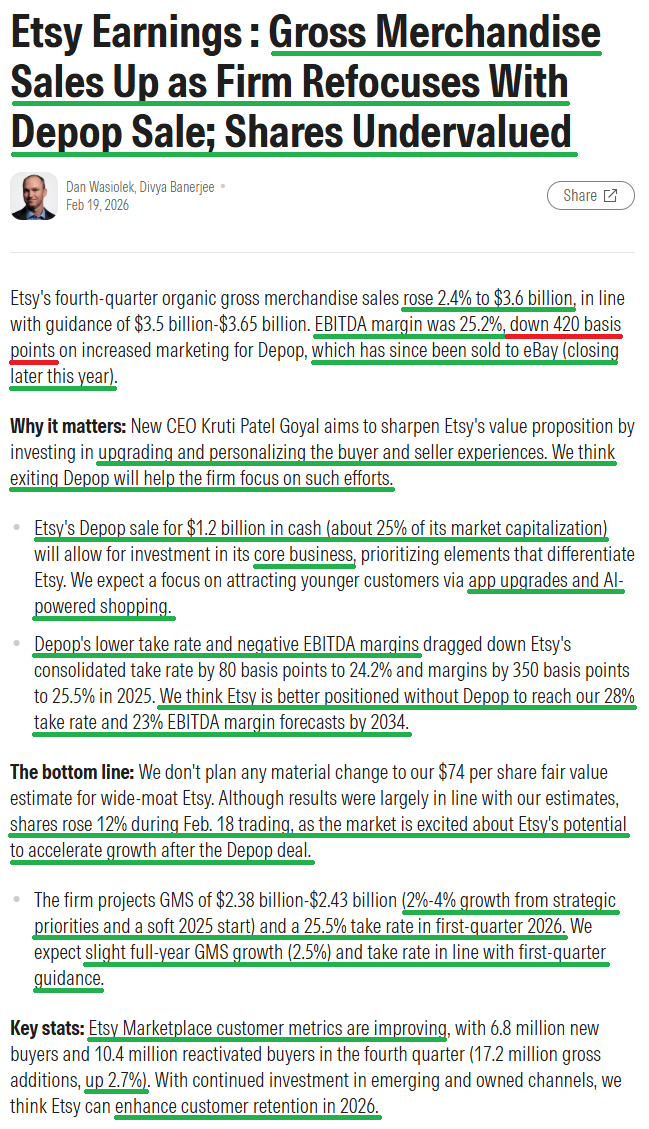
Etsy Update
Q4 Earnings Breakdown


10 Key Points
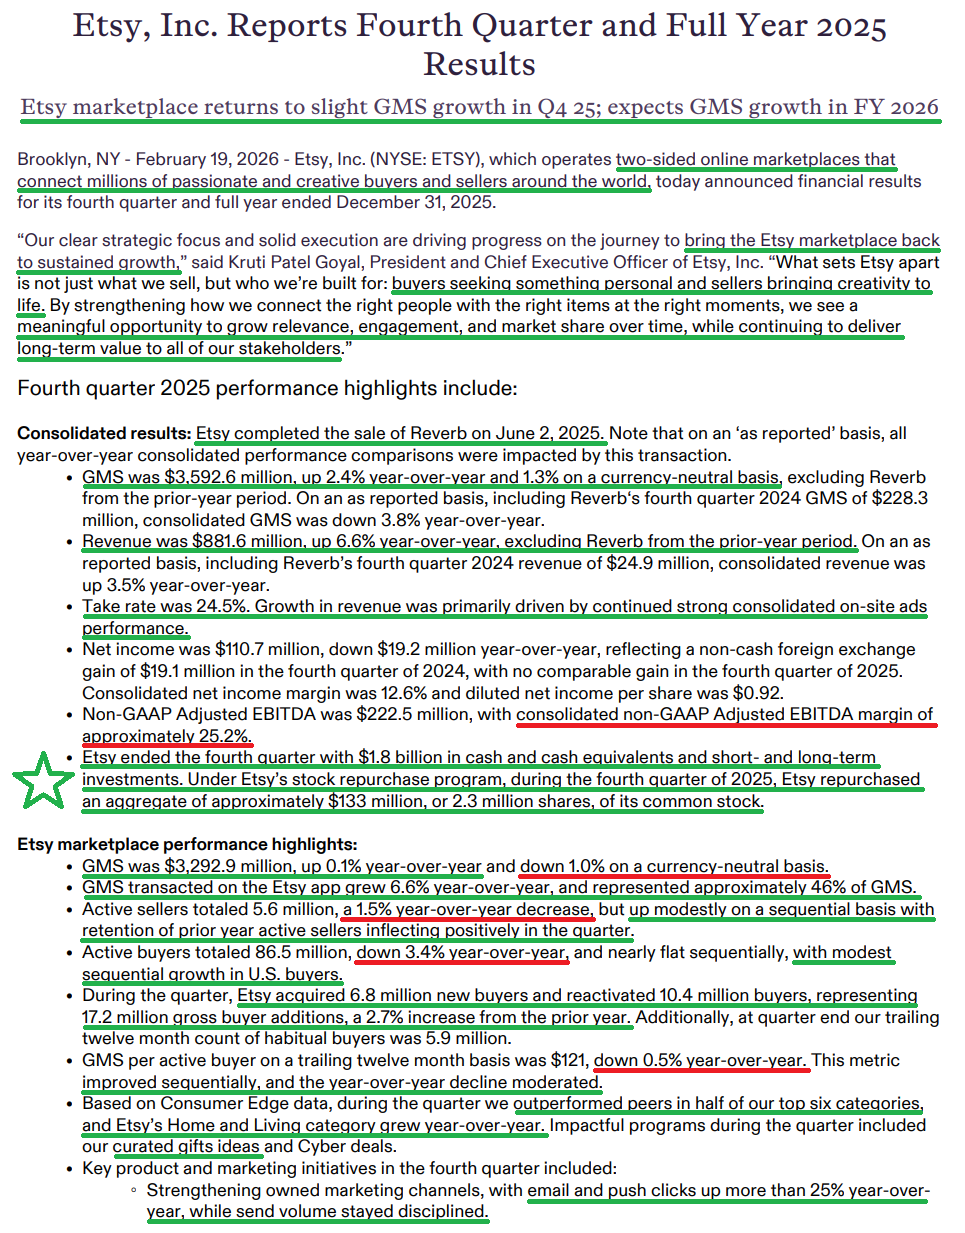
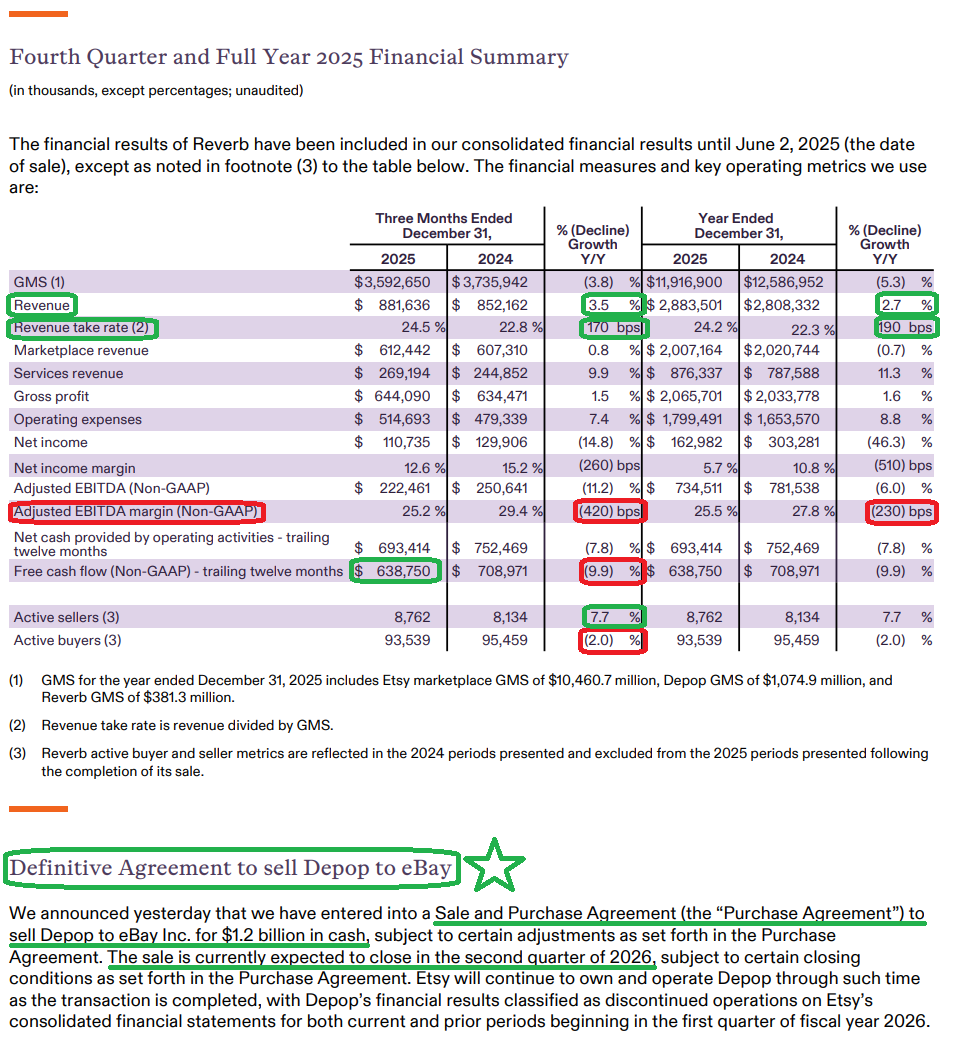
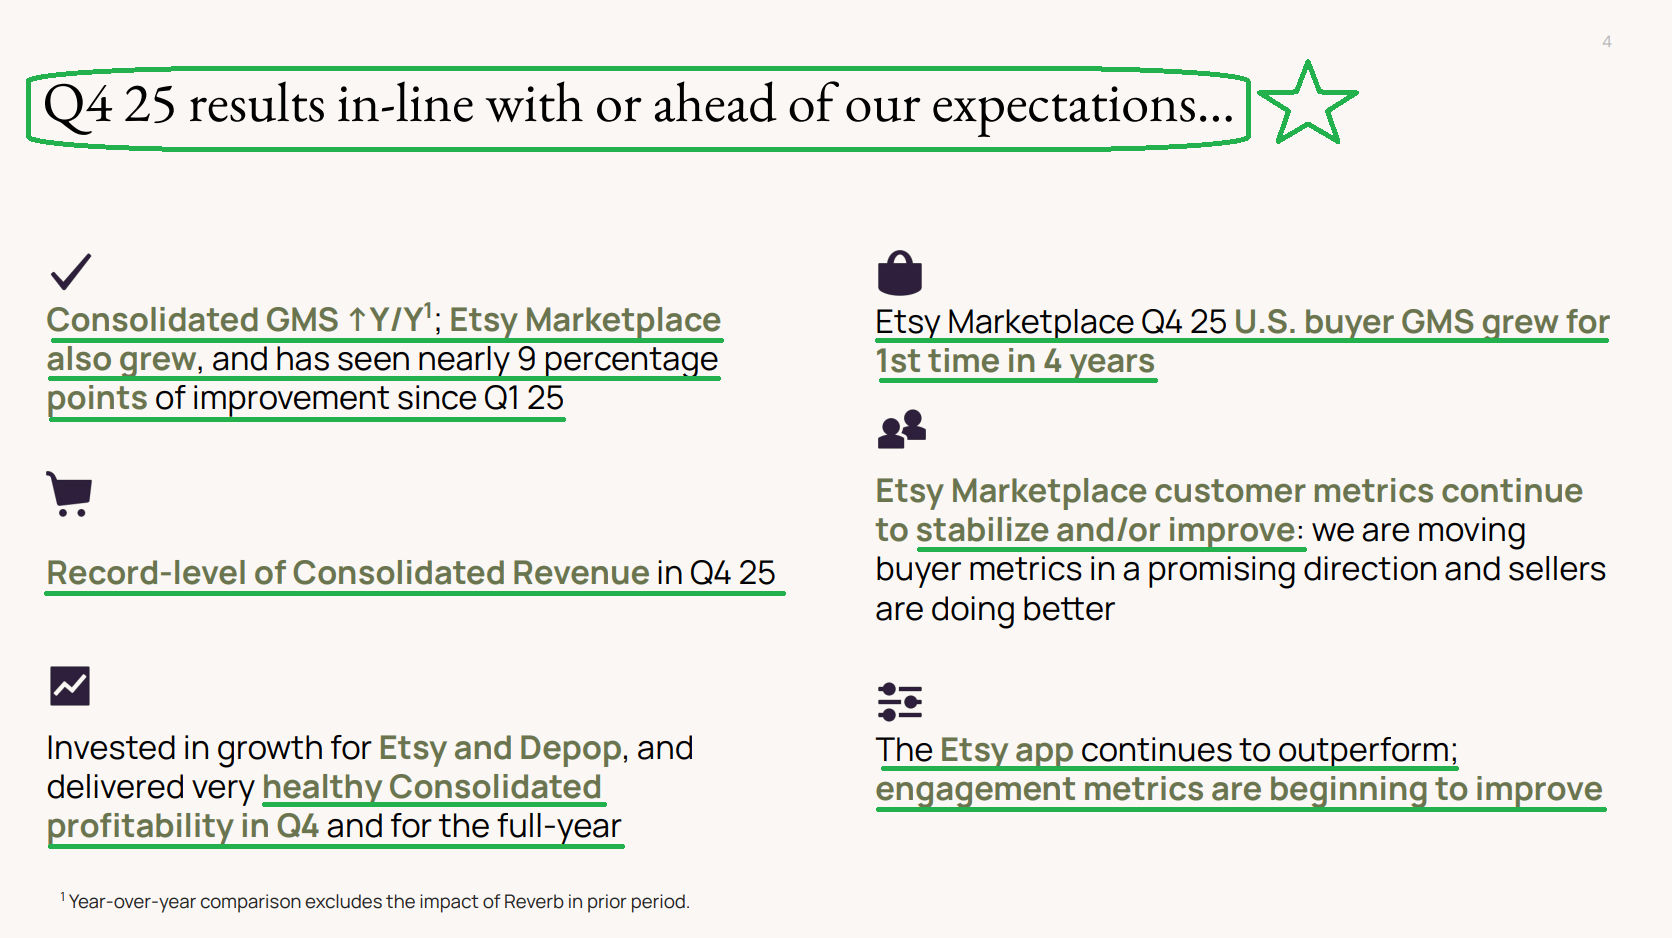
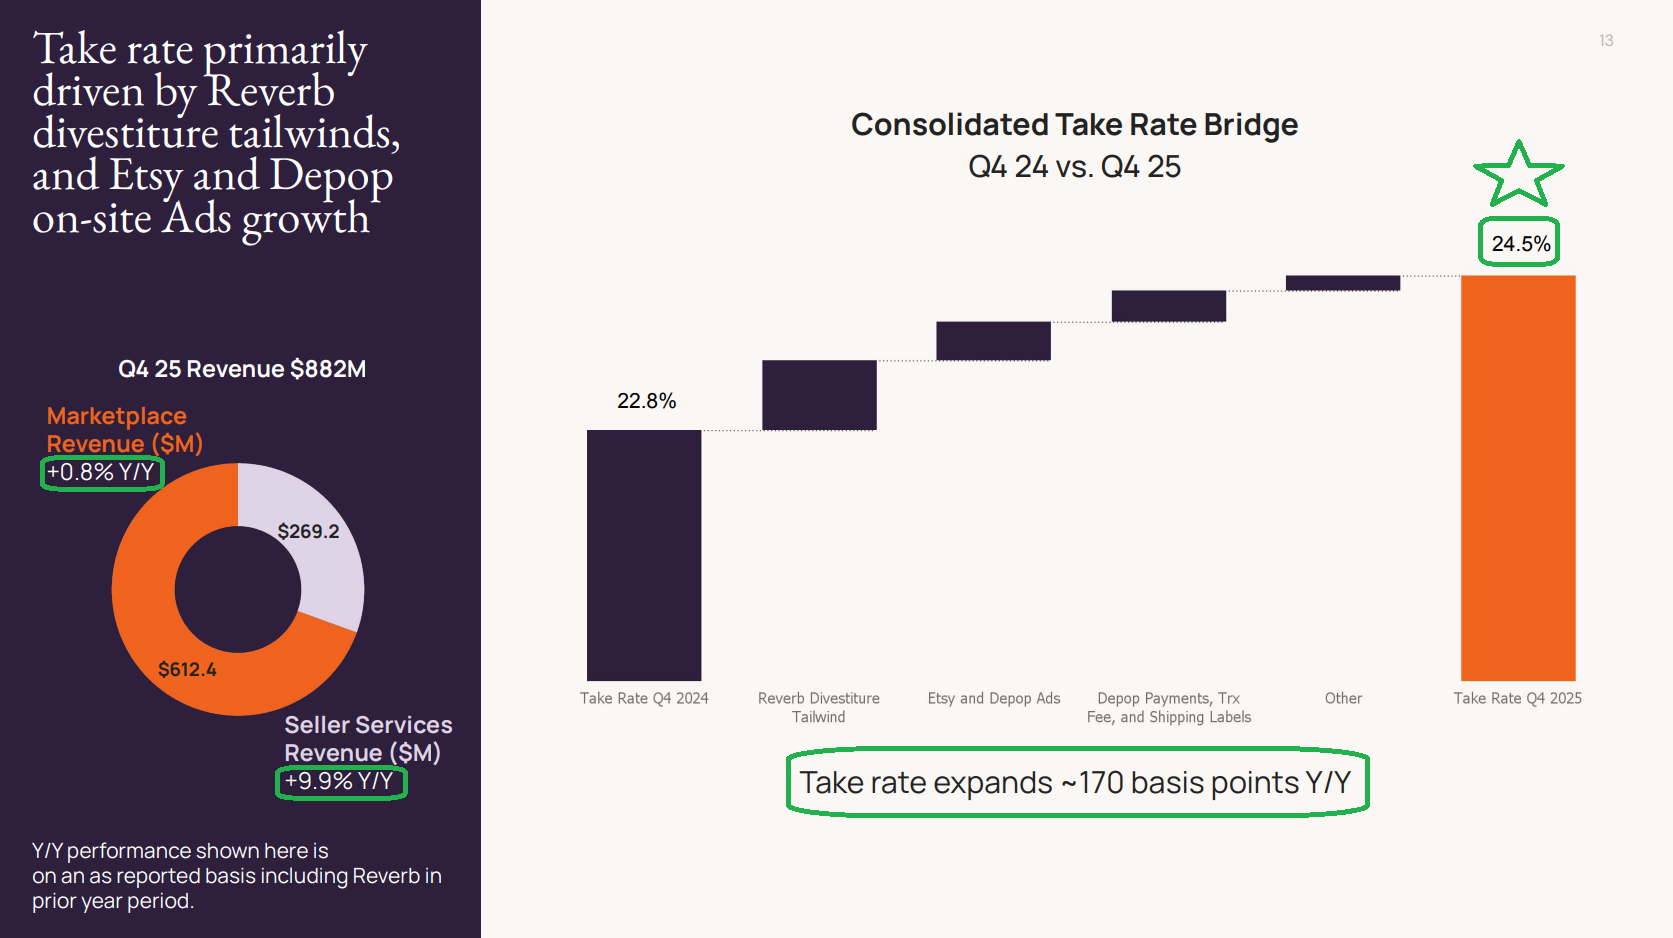
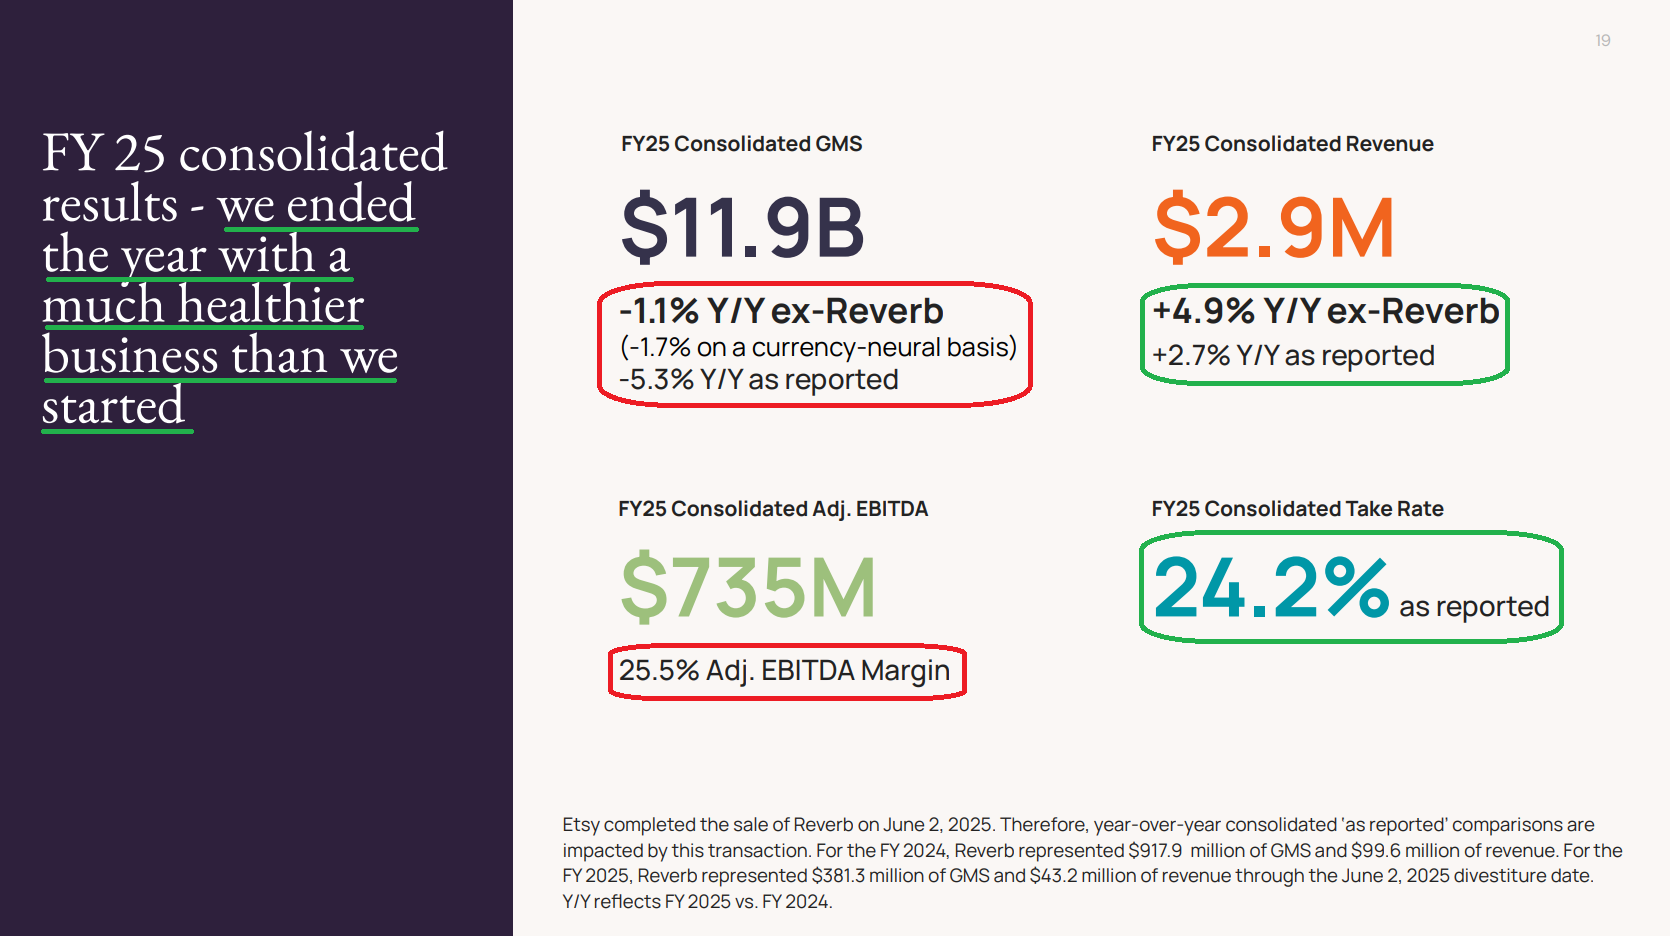
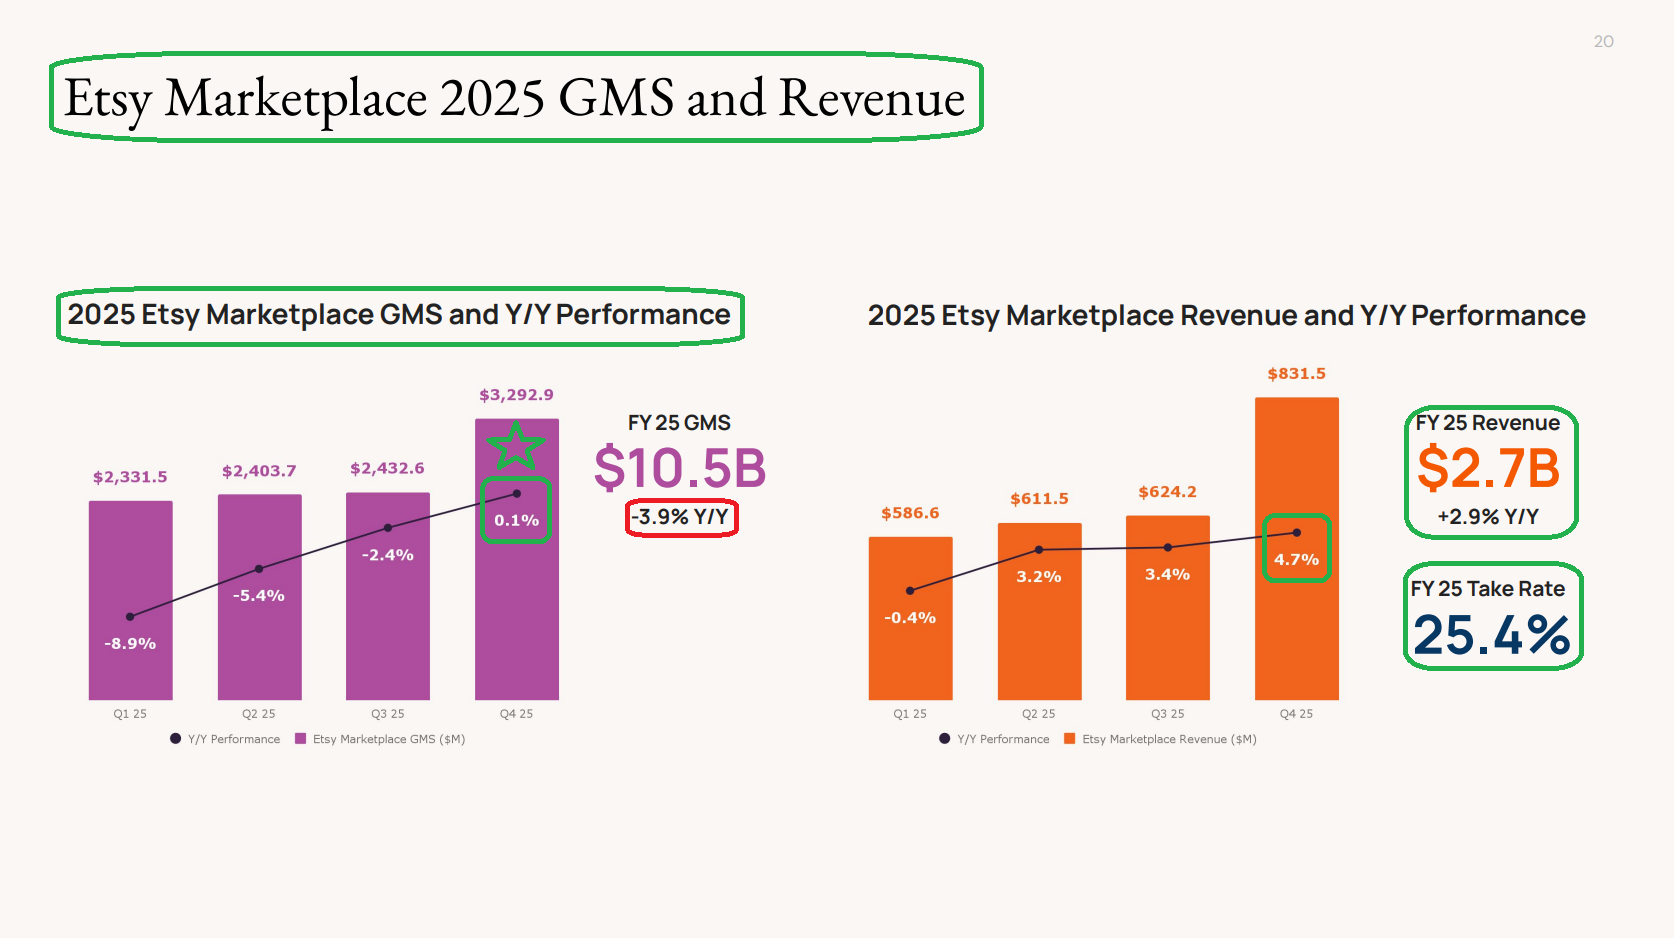
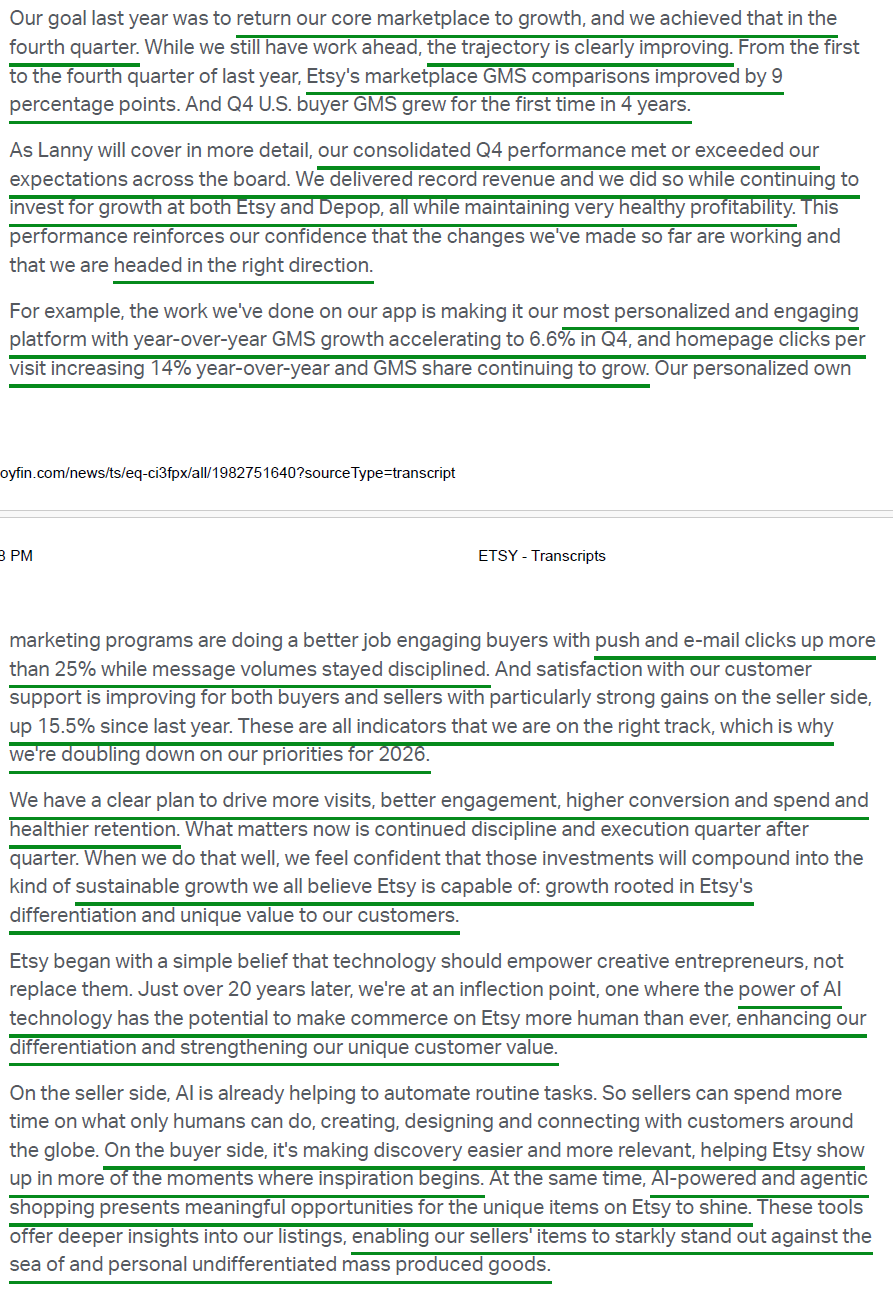
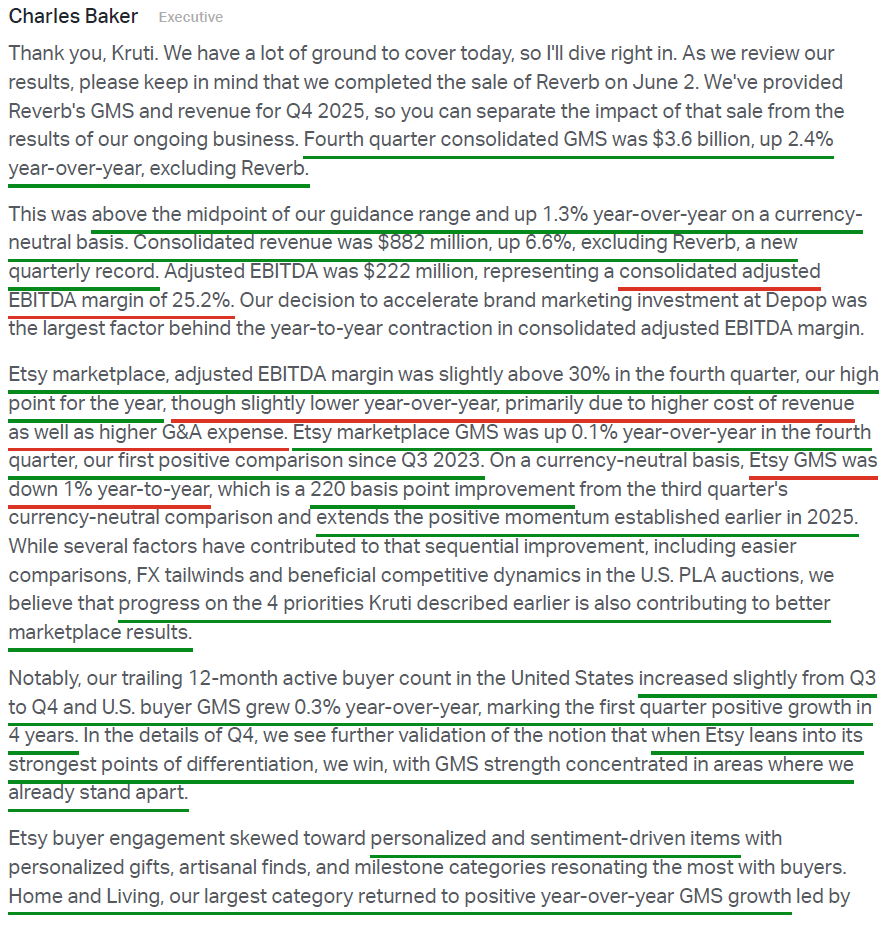
1) Etsy delivered Q4 revenue of $881.6M, +6.6% Y/Y excluding Reverb and marking a new quarterly record. Marketplace revenue increased +0.8% to $612.4M, while higher margin seller services grew +9.9% to $269.2M. For the full year, revenue reached $2.88B, +4.9% Y/Y excluding Reverb.
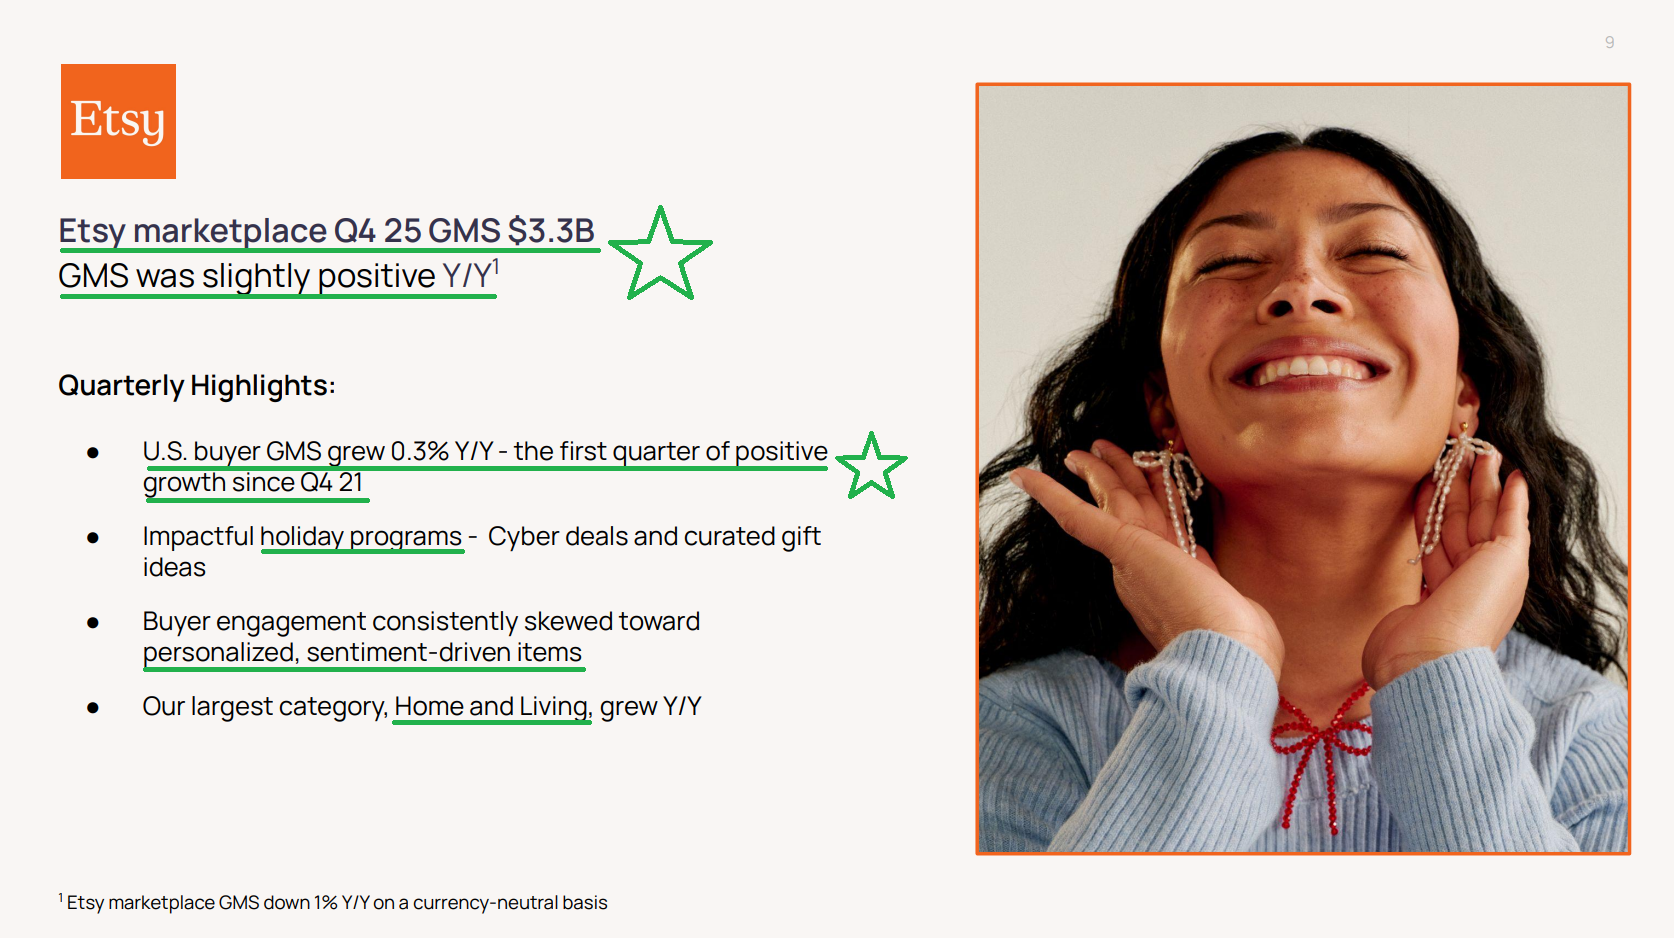
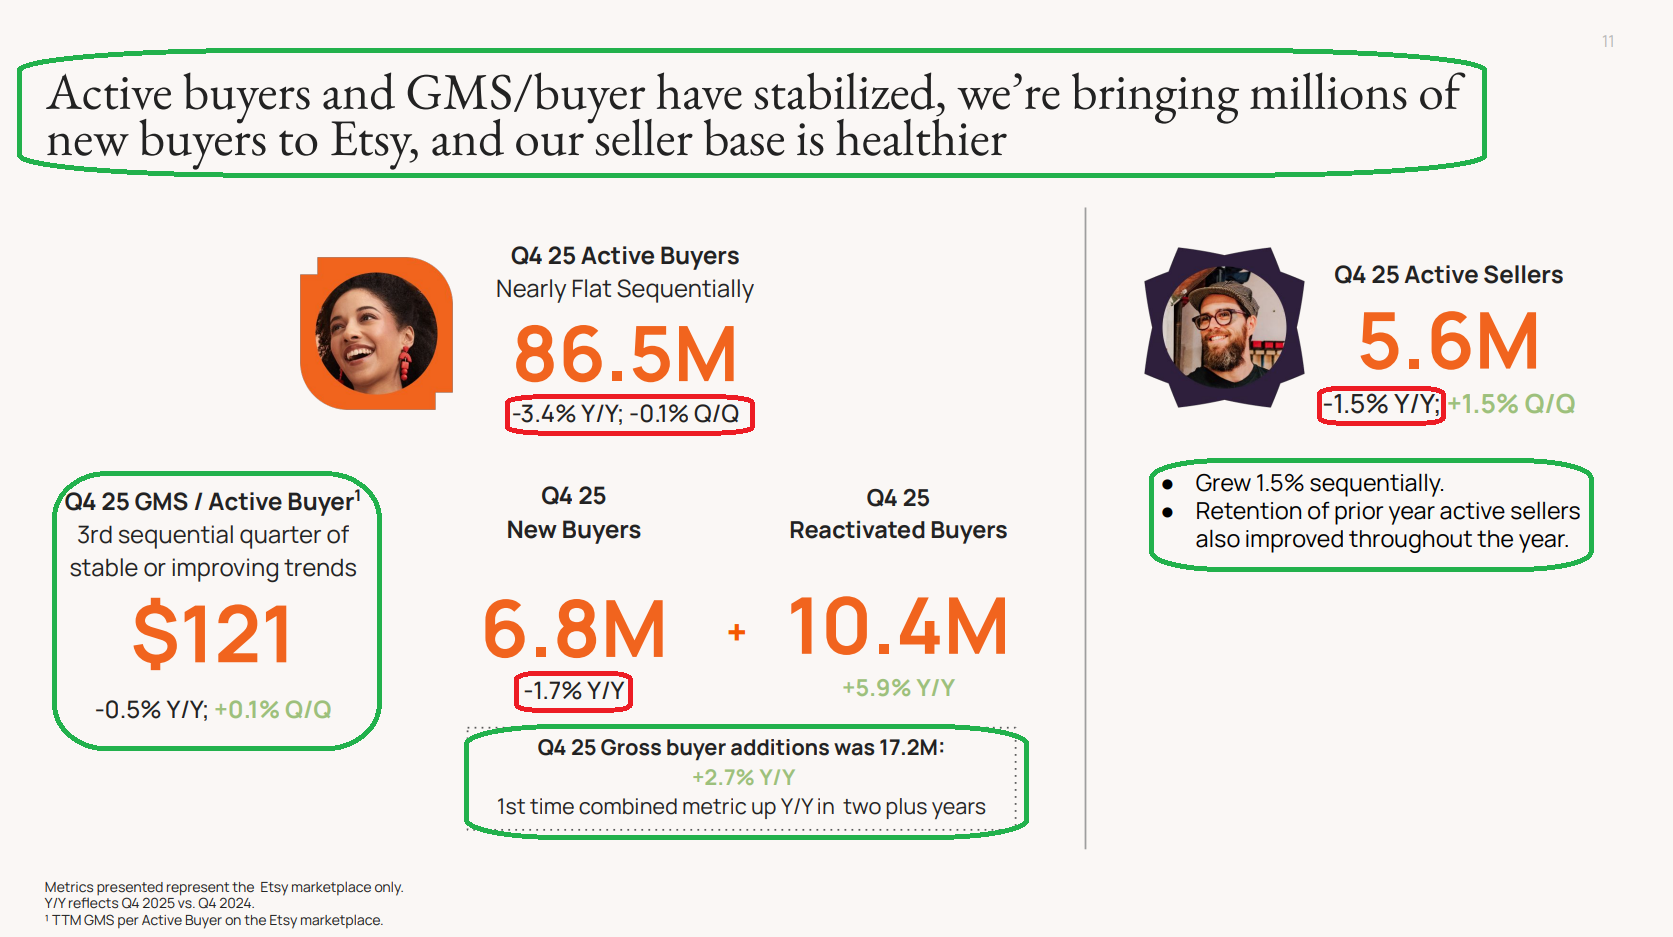
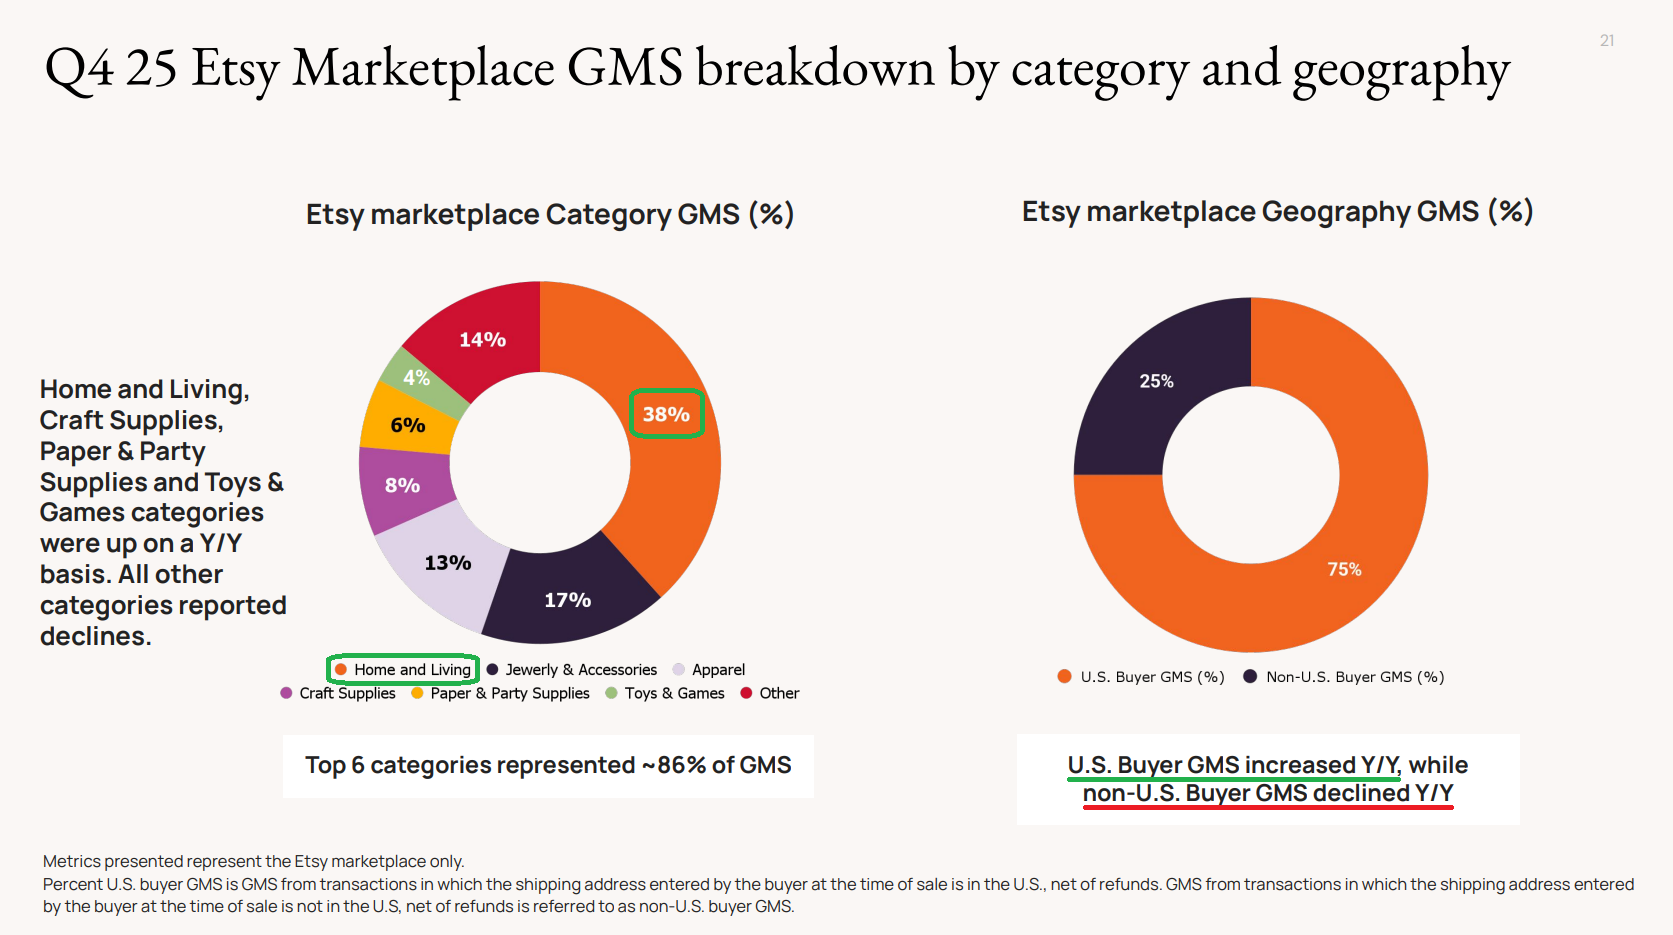
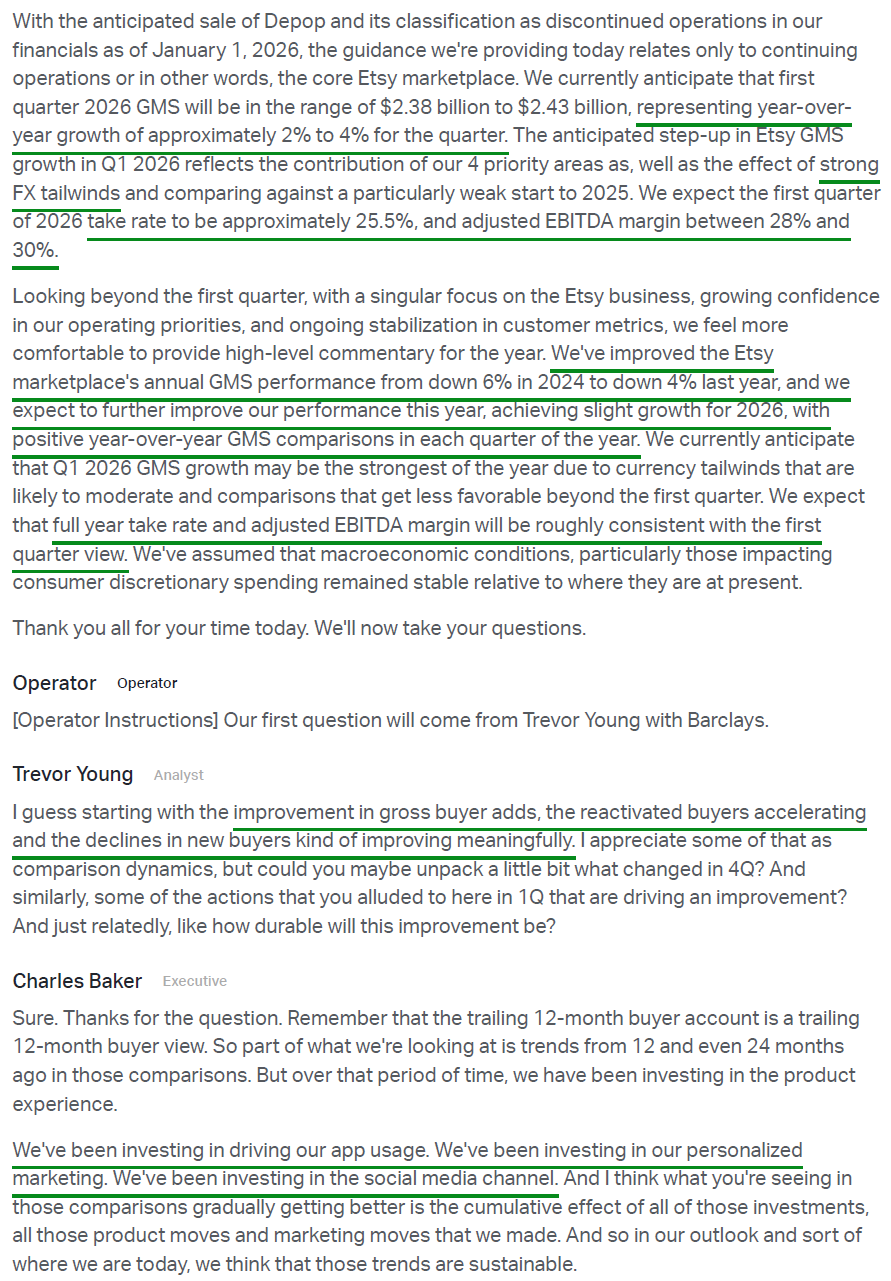
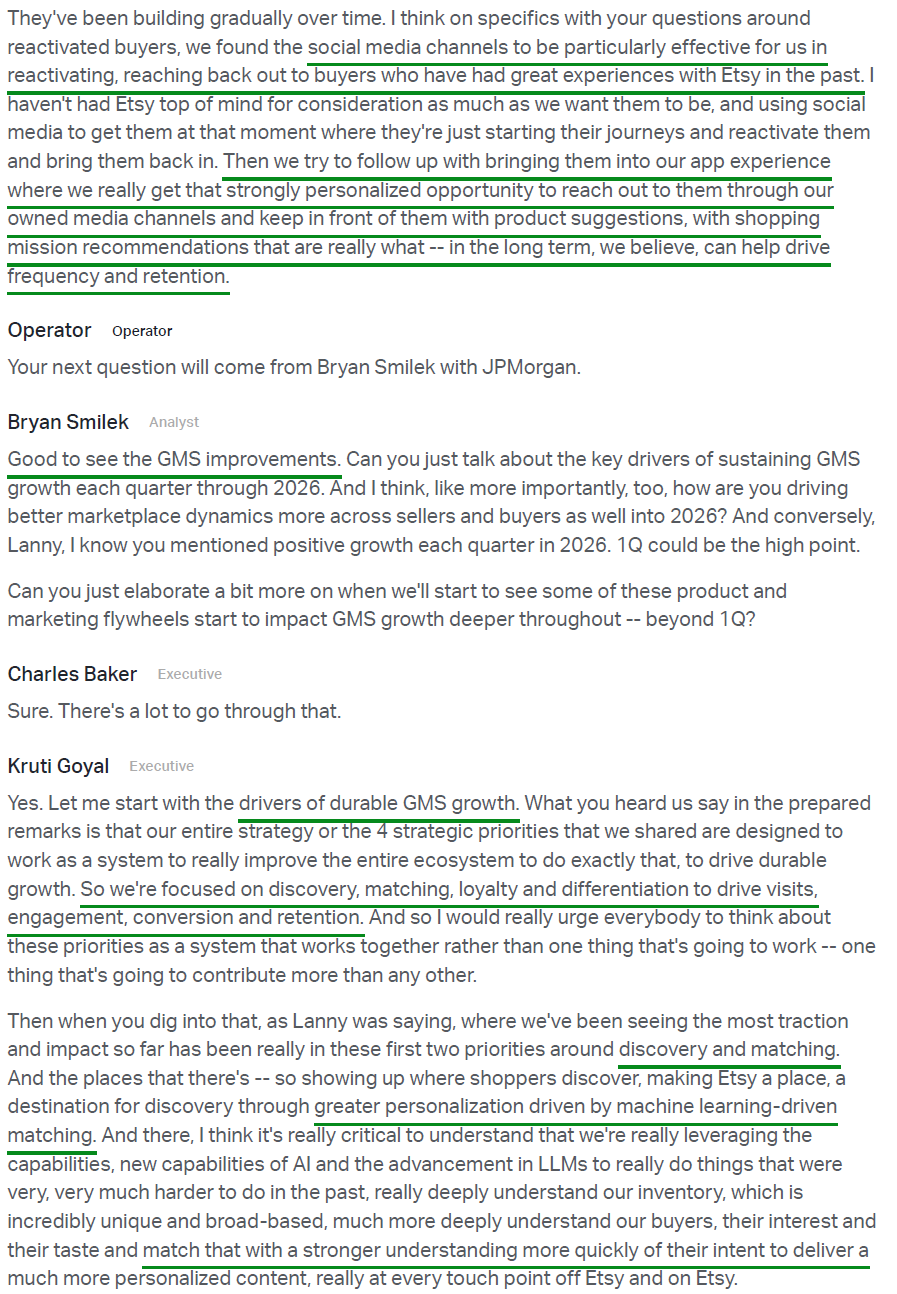
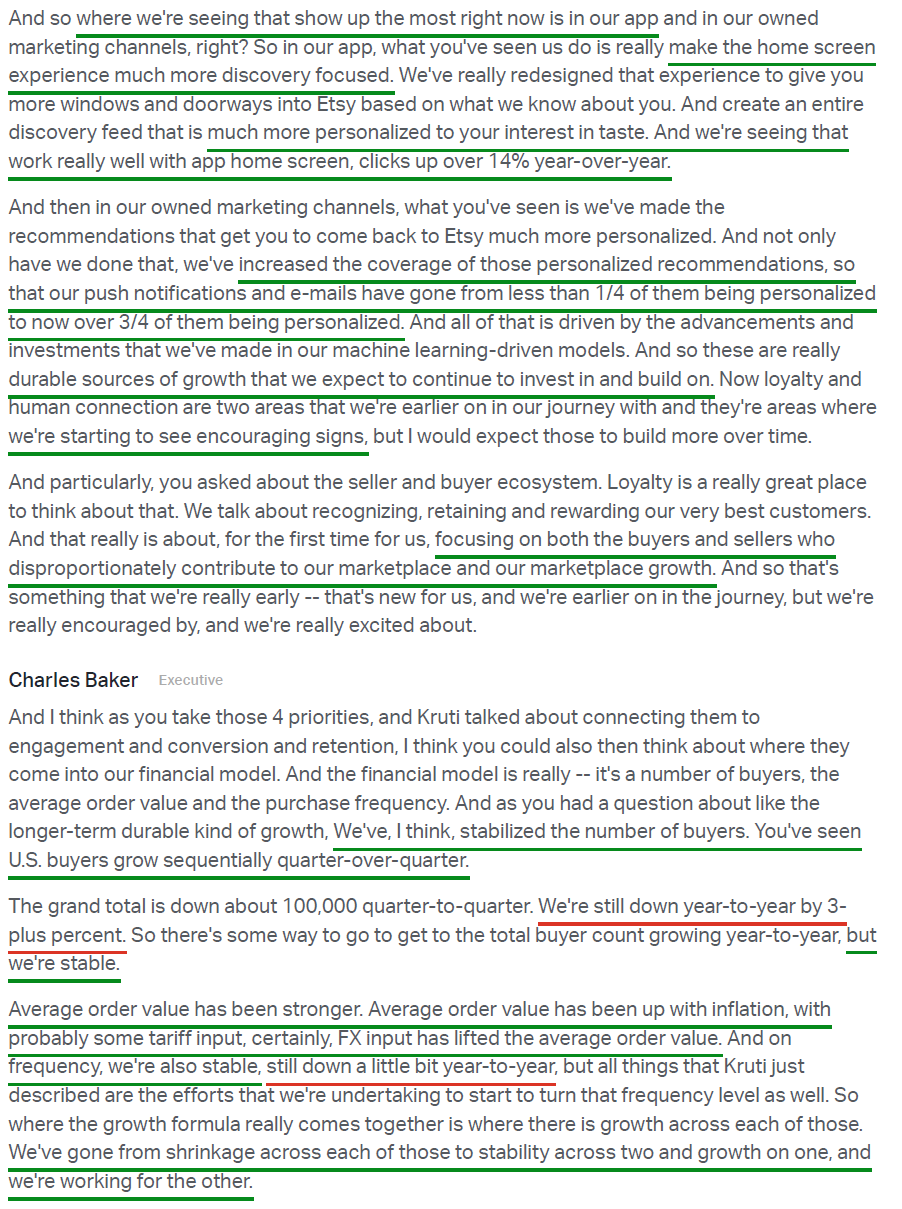
2) Consolidated GMS increased +2.4% to $3.59B (in line with consensus and prior guidance of $3.5B to $3.65B), driven by core Etsy GMS rising +0.1% to $3.29B (first positive comp since Q3 2023 and nearly 900 bps of improvement since Q1 2025). U.S. buyer GMS on the Etsy marketplace also grew for the first time in four years (+0.3%). For FY25, total GMS reached $11.92B (-1.1% Y/Y ex Reverb), with core Etsy GMS of $10.46B (-3.9% Y/Y vs -6% in FY24). Key customer metrics continued to stabilize, including TTM GMS per active buyer of $121 (-0.5% Y/Y, third straight quarter of stable or improving trends), 17.2M gross buyer additions (first growth in 2+ years), and 5.6M active sellers (-1.5% Y/Y, with sequential growth and improved retention).
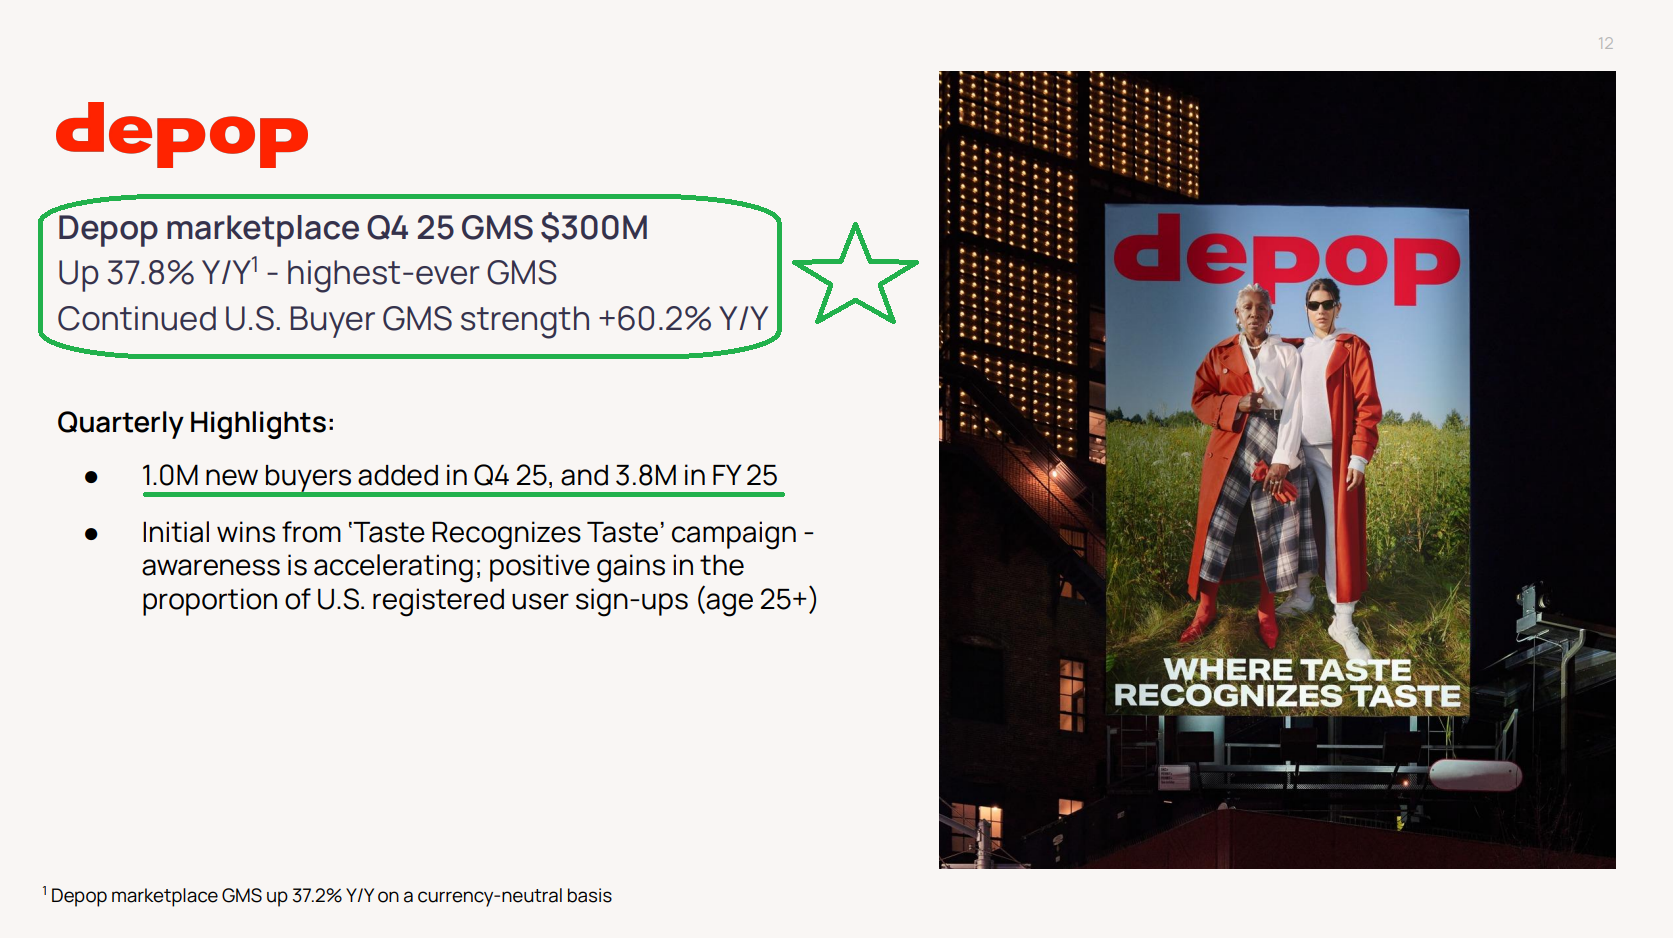
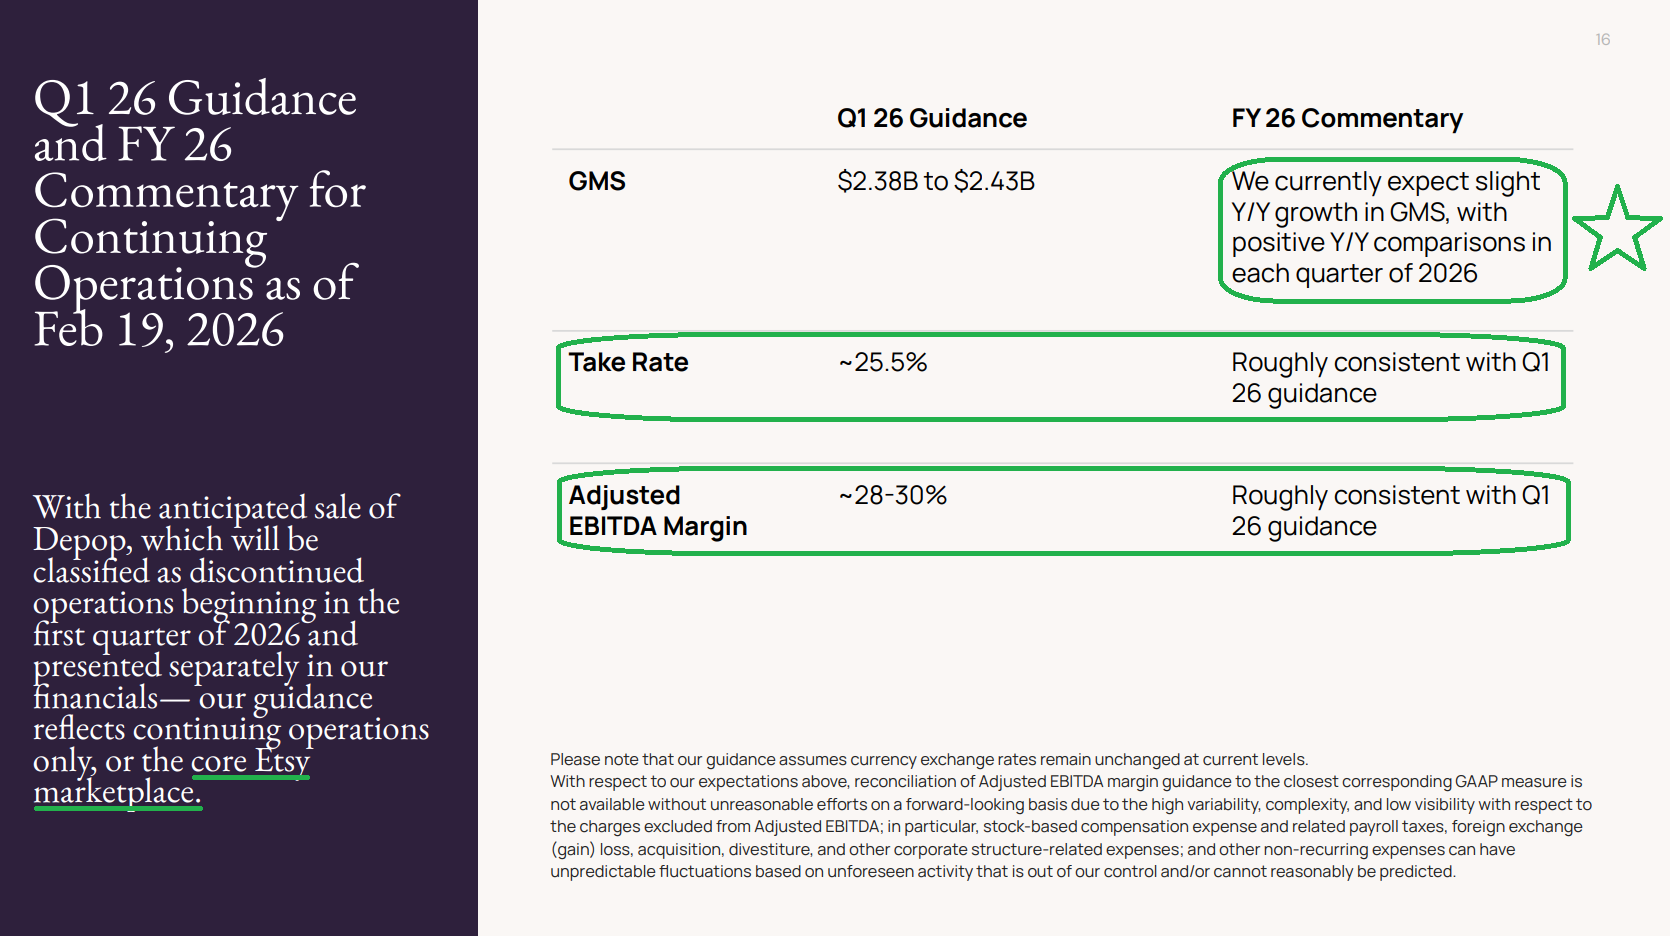
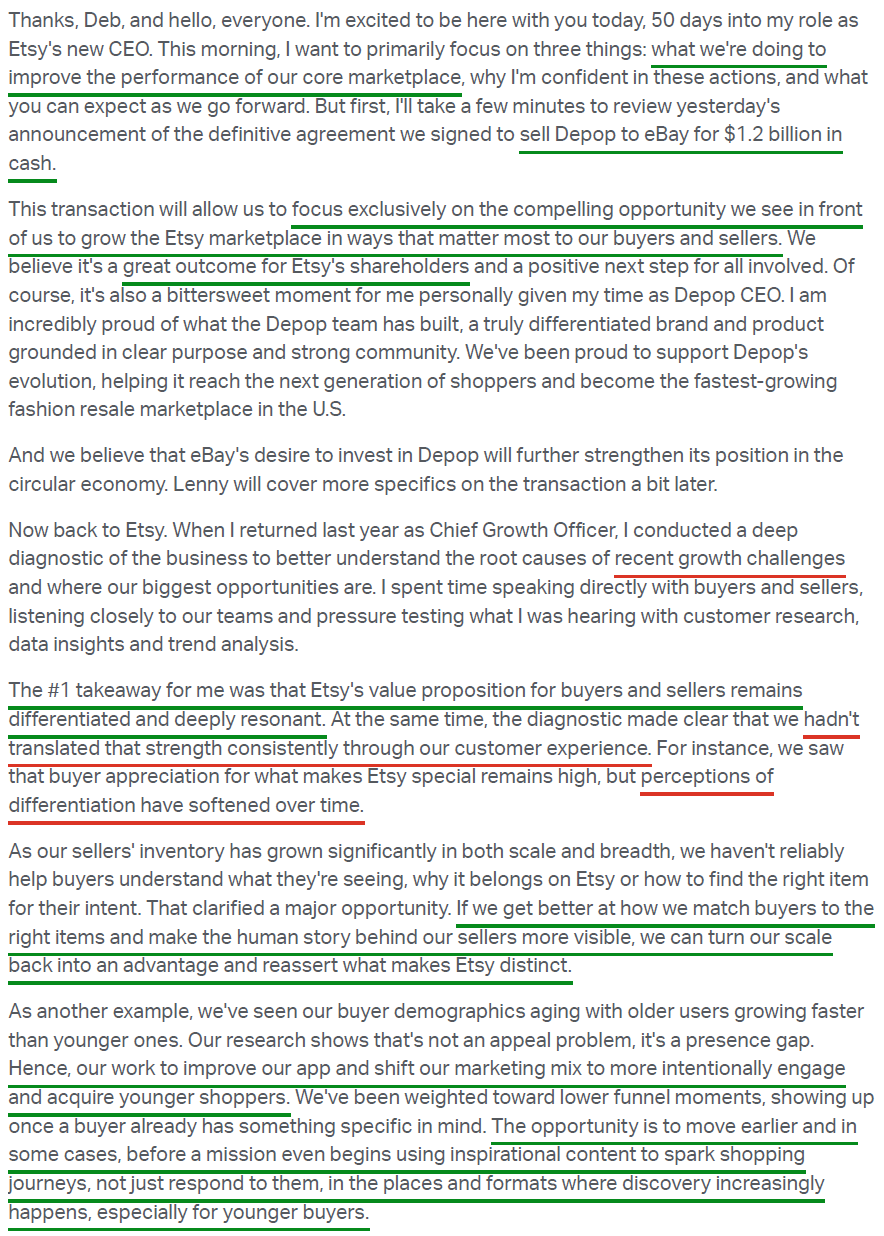
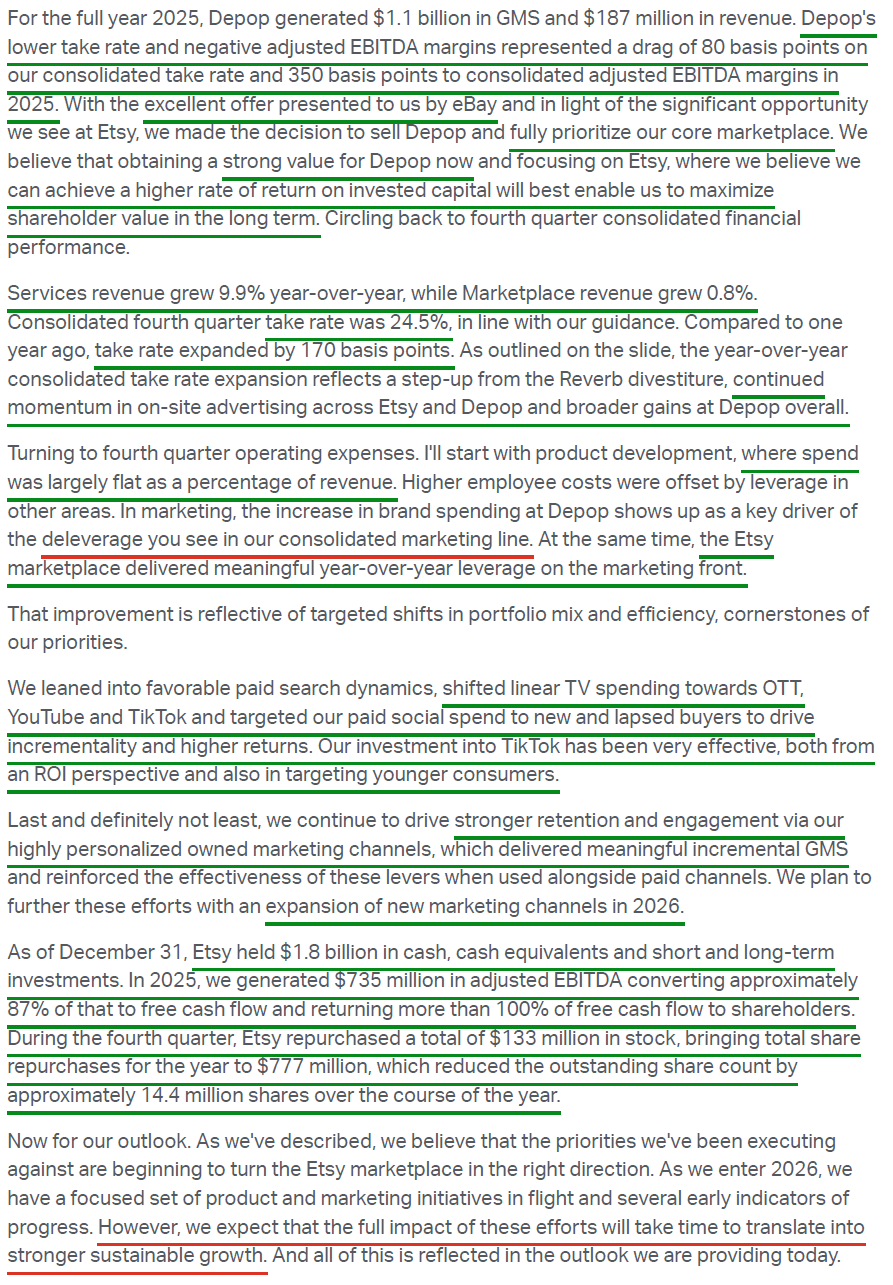
3) Prior to earnings, Etsy announced the sale of Depop to eBay for ~$1.2B in cash, with the transaction expected to close in Q2 2026. Depop grew rapidly in FY25, generating ~$1.1B of GMS (+36.3% Y/Y), but it was a significant headwind to profitability, representing a 350 bps drag on adjusted EBITDA margins, while its structurally lower take rate reduced consolidated take rate by 80 bps in 2025. Etsy acquired Depop in 2021 for $1.62B (~23x sales), and the ~$1.05B impairment taken in 2022 confirmed the overpayment. The ~$1.2B sale price represents a ~$420M haircut to the original purchase price, yet still equates to ~6.4x sales and more than 25% of Etsy’s current market cap for a business that accounted for just 9% of 2025 GMS, with proceeds targeted toward buybacks and reinvestment in the core marketplace.
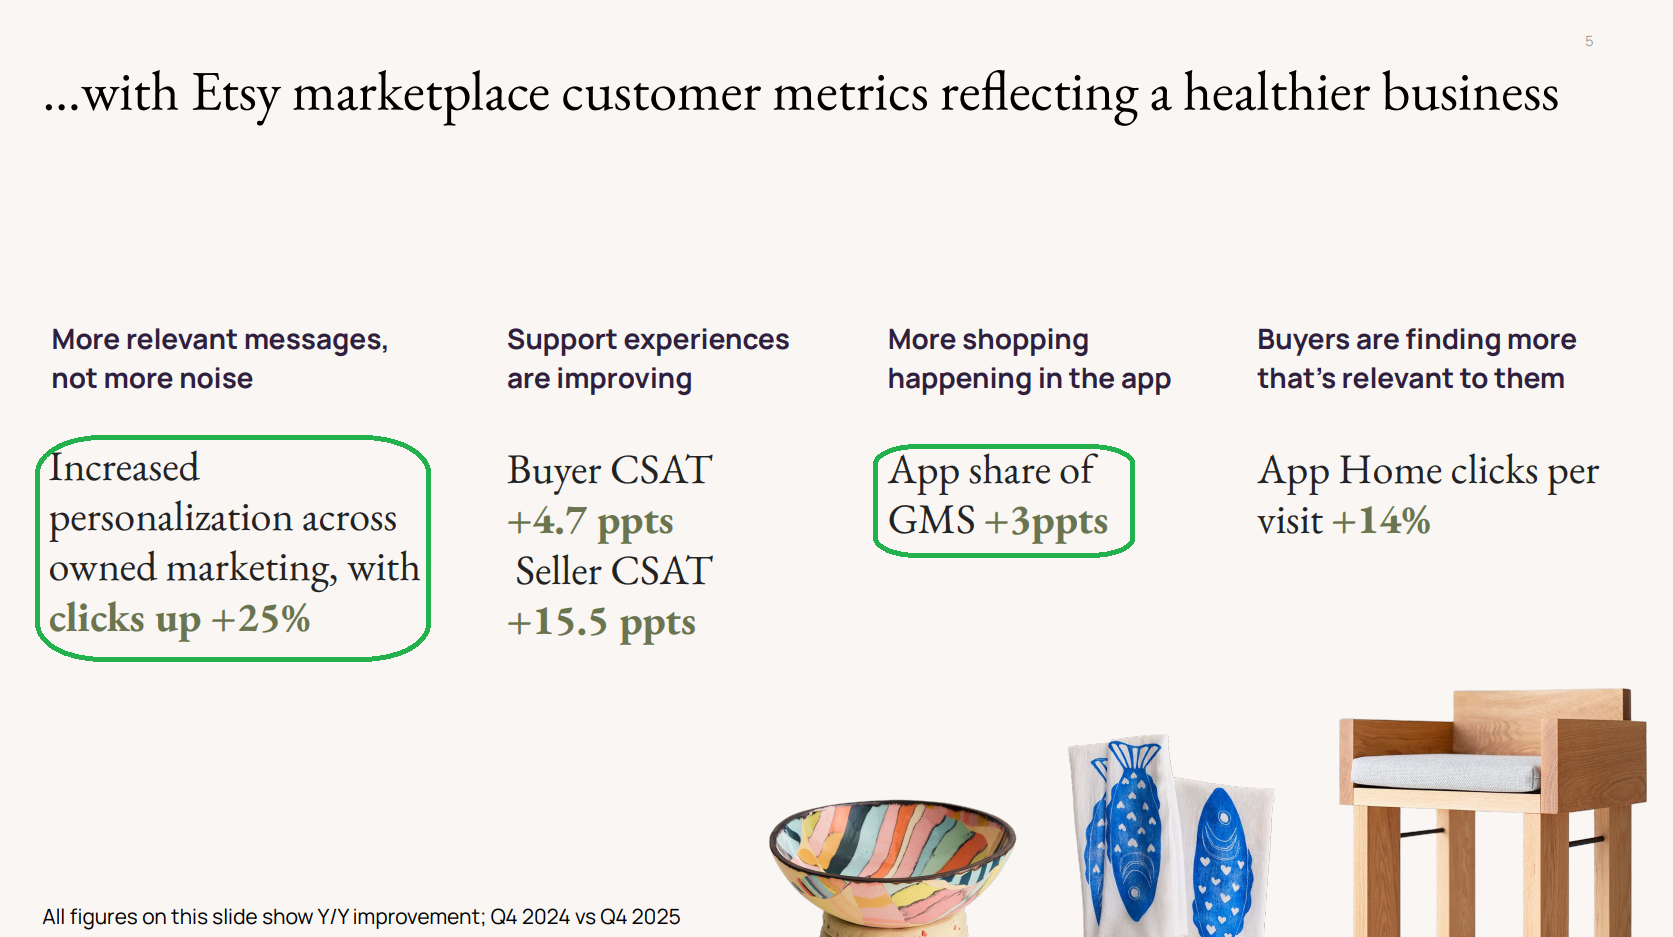
4) The Etsy mobile app continues to outperform, with app GMS accelerating to +6.6% (vs +5% in Q3). Downloads increased +4% Y/Y, and app GMS now represents ~46% of total GMS (stable sequentially and up ~500 bps over the past two years). App users generate ~40% higher lifetime value than non app users, driven by more frequent visits, deeper engagement, and higher conversion rates. App users also tend to skew much younger, making the app a key channel for engaging this important demographic.
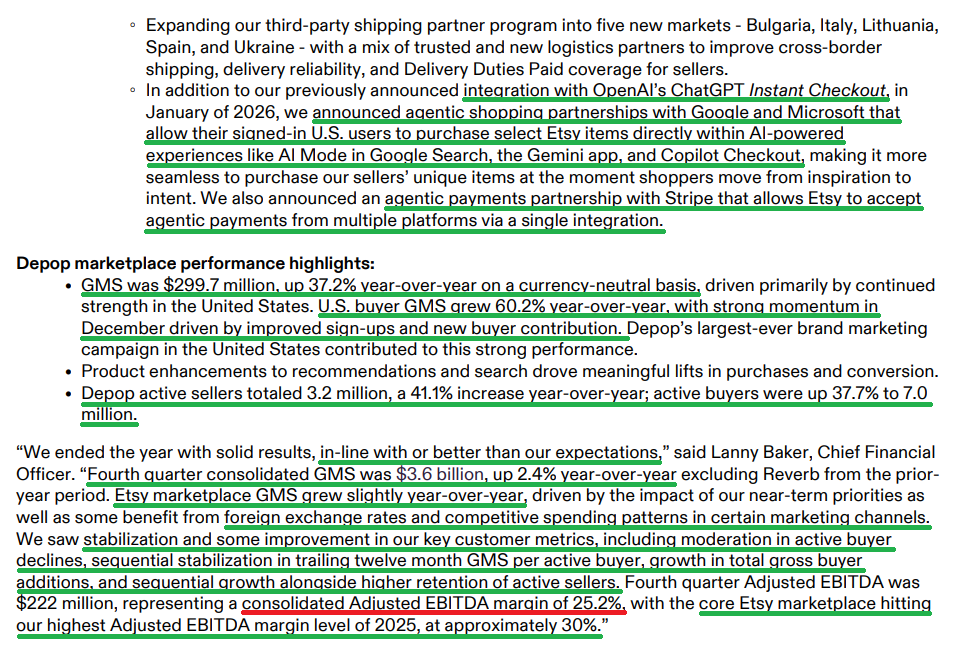
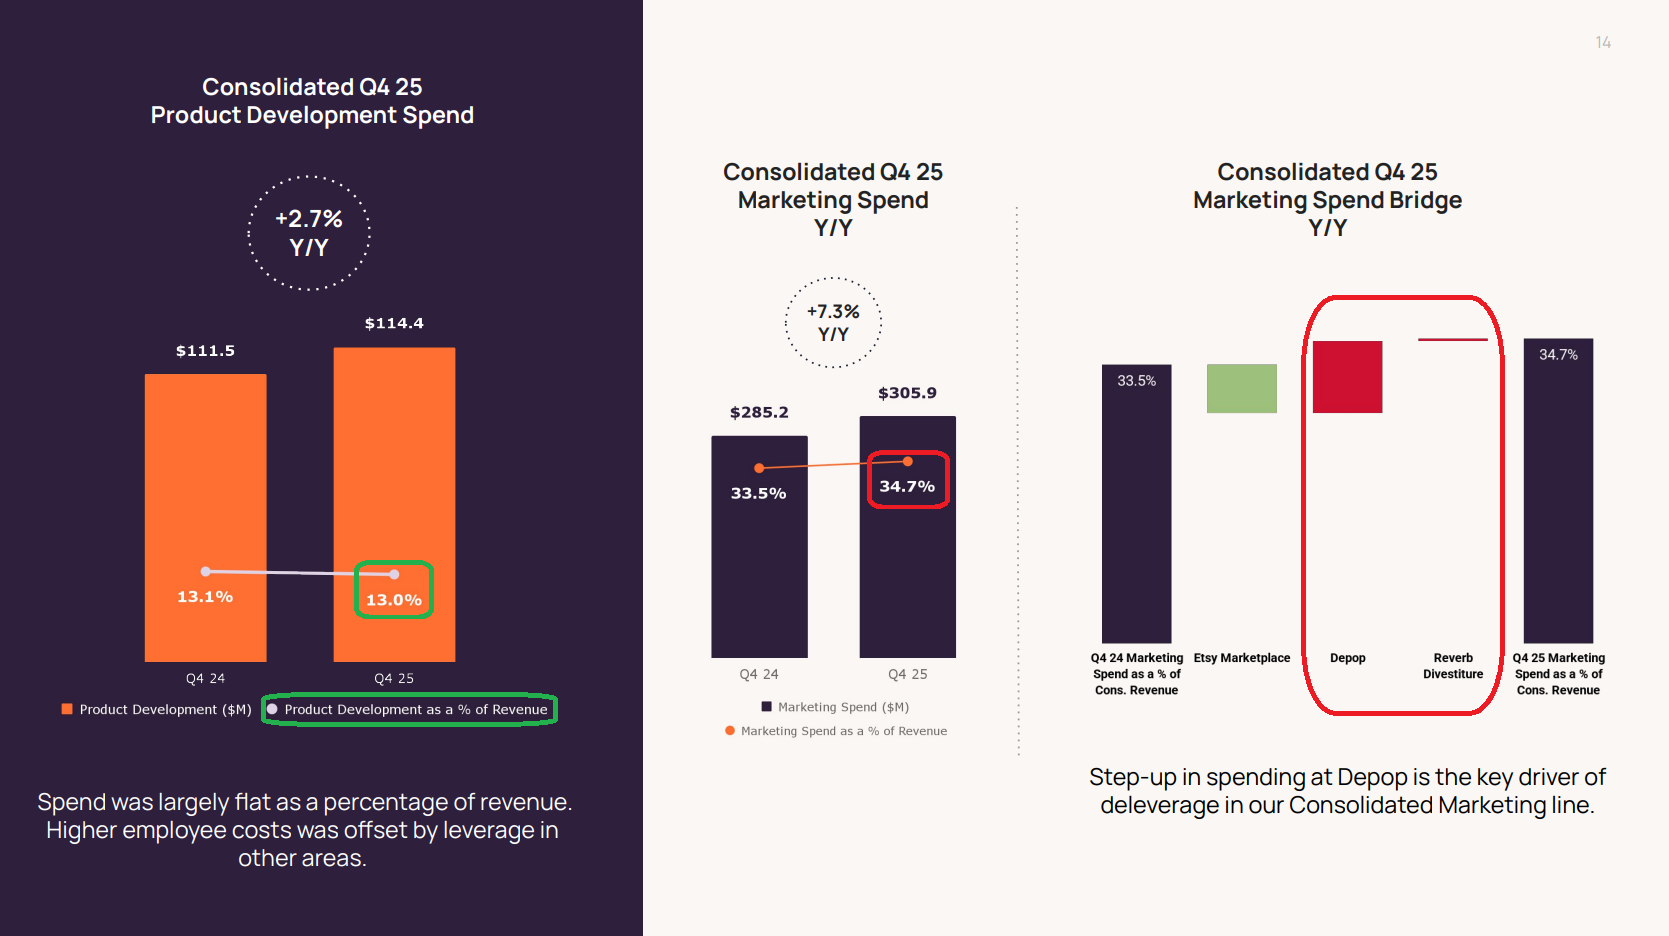
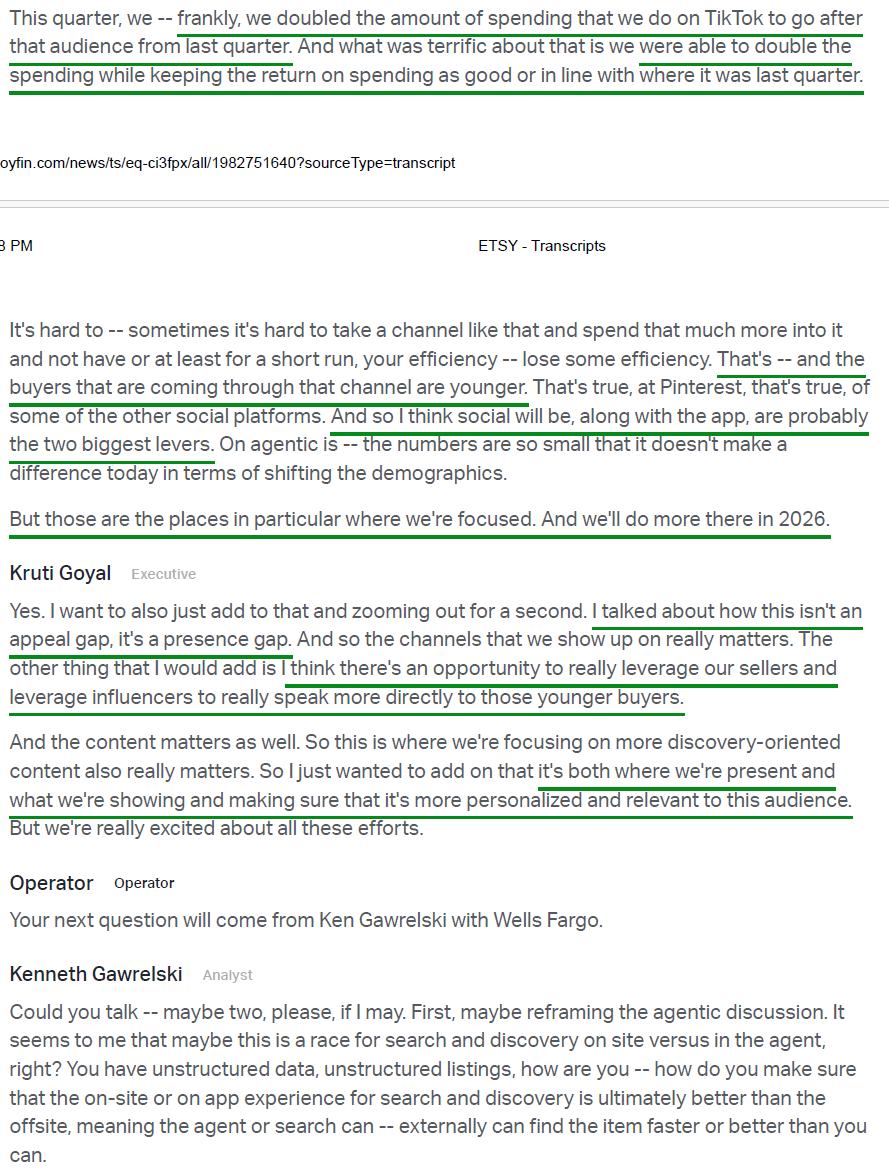
5) Etsy’s marketing spend in Q4 increased +7.3% Y/Y to 34.7% of revenue (+120 bps), with the step up largely driven by accelerated investment at Depop. Management continues to pivot away from linear TV toward digital channels such as YouTube and TikTok, where returns have been strong and targeting younger consumers has proven more effective. Etsy doubled its TikTok spend during the quarter while maintaining ROI in line with prior levels. The company is also leaning further into personalization across owned channels, with personalized push notifications and emails rising from less than 25% to more than 75% of total sends, driving email and push clicks up more than +25% Y/Y.
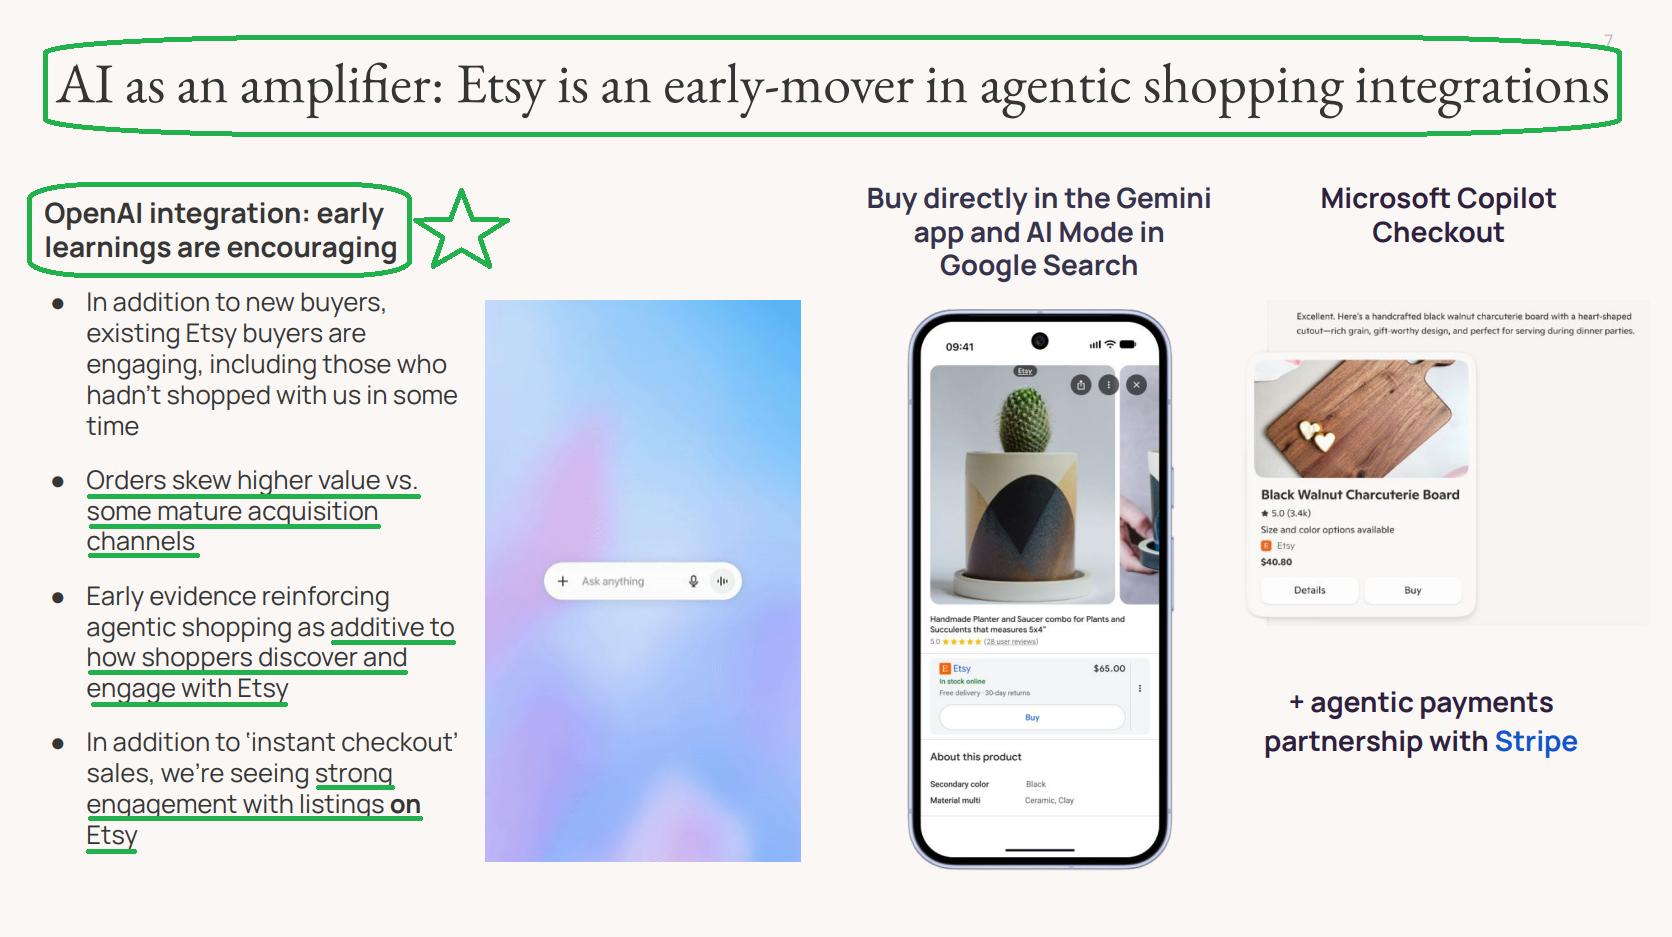
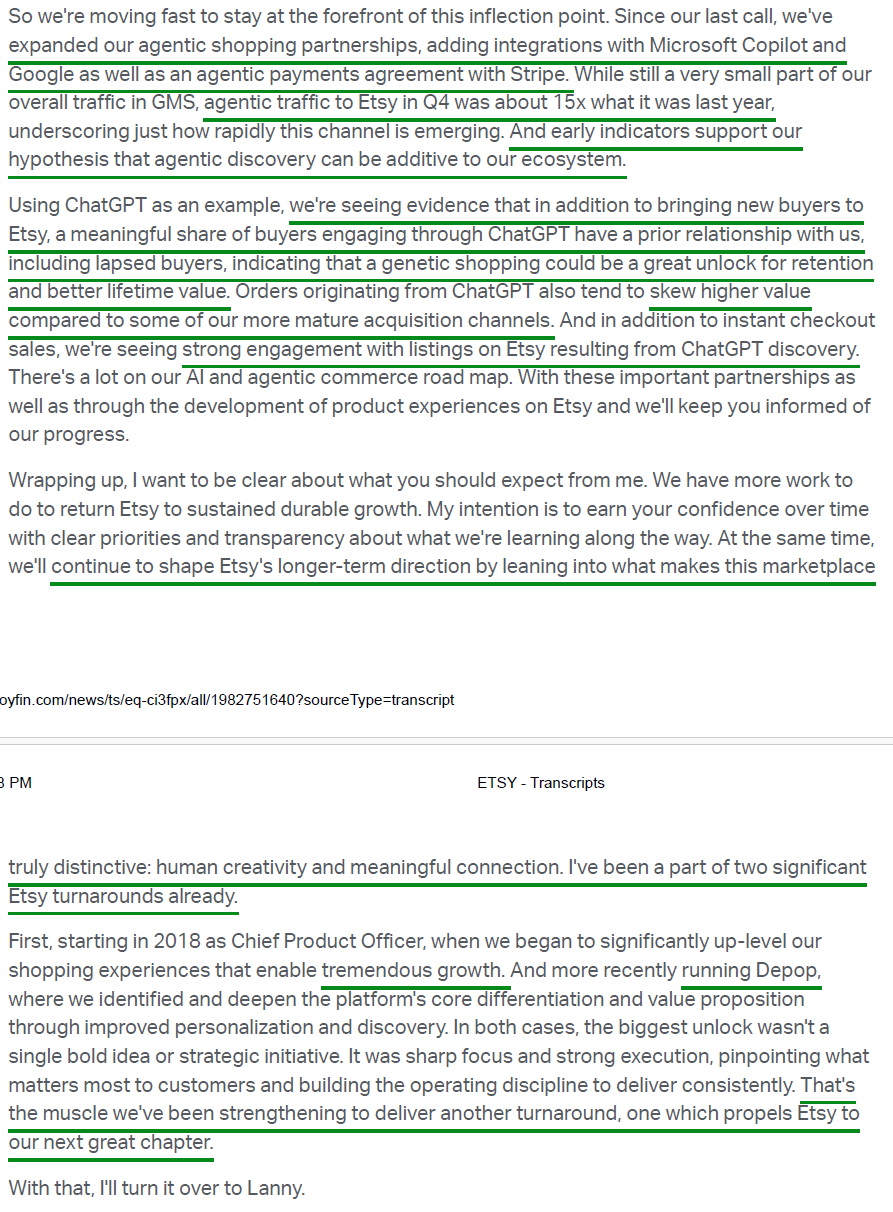
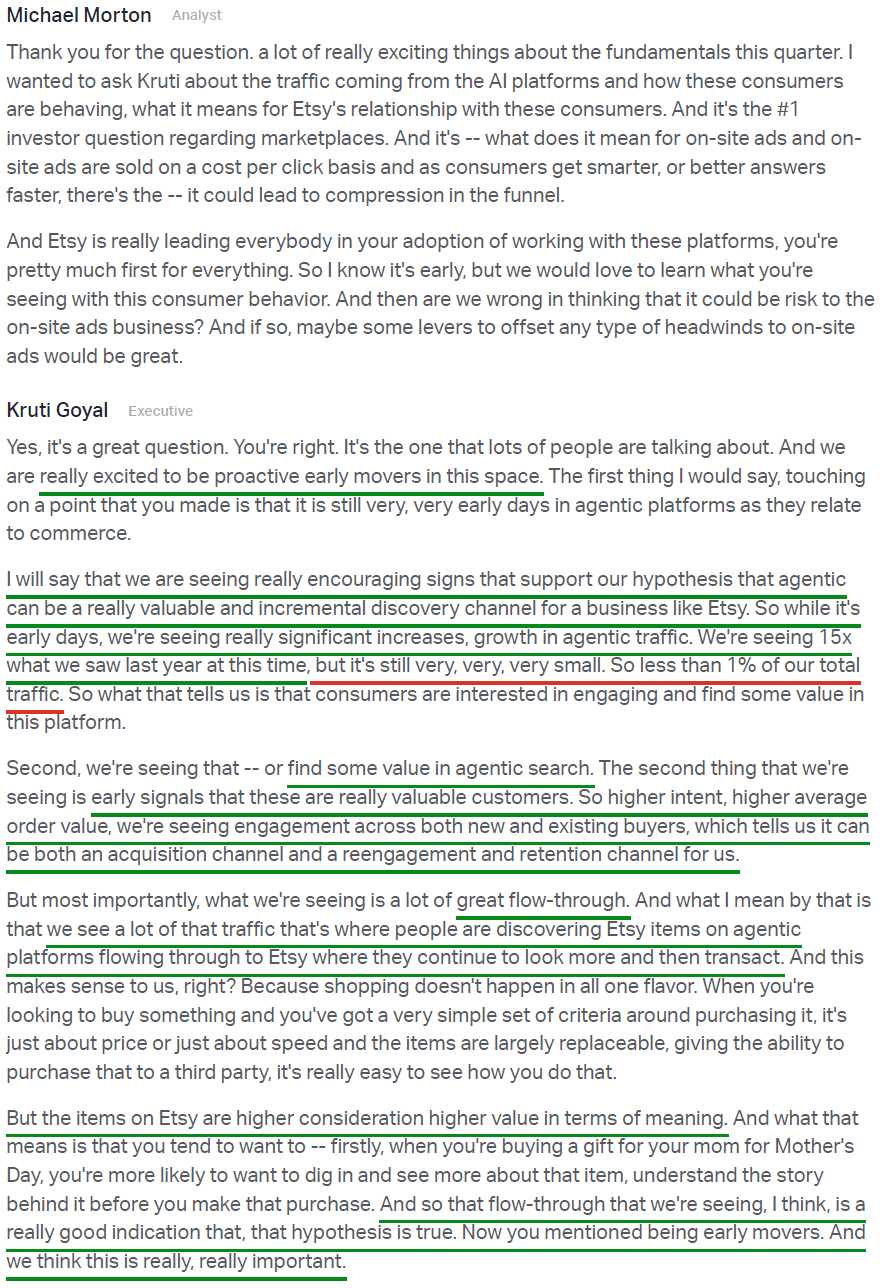
6) In addition to the previously announced integration with OpenAI’s ChatGPT Instant Checkout, Etsy has launched agentic shopping partnerships with Google and Microsoft, enabling signed in U.S. users to purchase select Etsy items directly within AI powered experiences, including Gemini and Copilot. Agentic remains a very small portion of total traffic and GMS (<1%), but traffic grew 15x Y/Y in Q4. Early signals are encouraging, with higher average order values, strong engagement with Etsy listings, and a meaningful share of purchases coming from lapsed buyers via ChatGPT, suggesting agentic could become a powerful lever for retention and reactivating Etsy’s pool of 100M+ lapsed buyers.
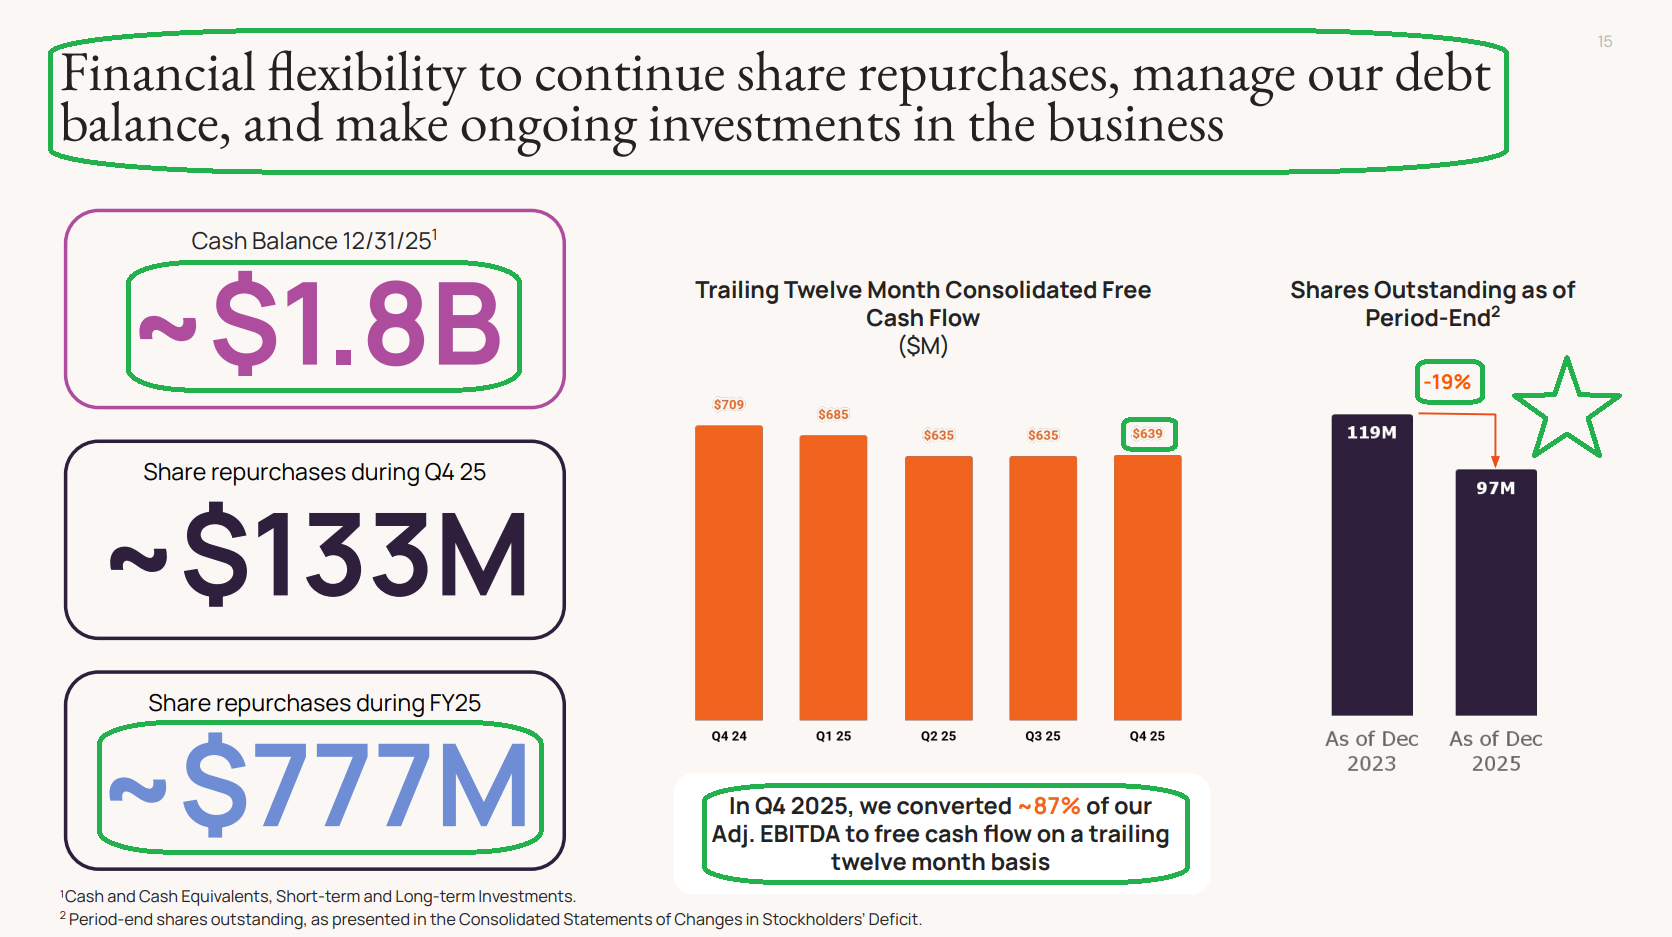
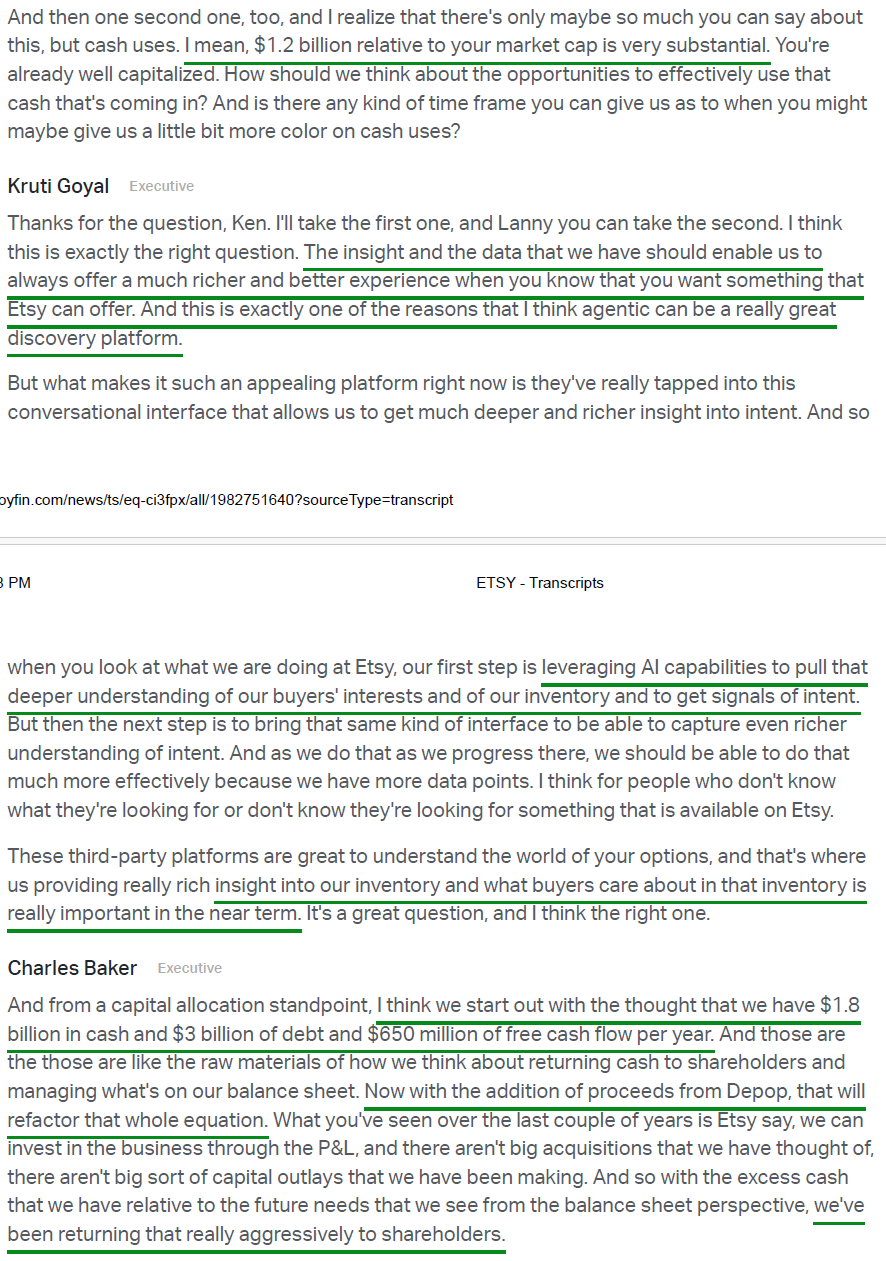
7) Etsy generated $308M of free cash flow in Q4, bringing FY25 FCF to $639M (~12% yield) with adjusted EBITDA to FCF conversion of 87%. Management returned well over 100% of FCF to shareholders, repurchasing $777M of stock during the year and reducing the share count by 14.4M shares, a 19% reduction over the past two years. Remaining repurchase authorization stands at $973.2M, enough to buy in nearly 20% of the company, supported by $1.4B of cash on the balance sheet before factoring in the ~$1.2B of expected Depop proceeds.
8) Adjusted EBITDA margins came in at 25.2% (-420 bps Y/Y), ahead of prior guidance of ~24%, bringing FY25 margins to 25.5% (-230 bps Y/Y). The contraction was largely driven by stepped up investment at Depop, which will now roll off following the sale. Ex Depop, the core Etsy marketplace delivered its highest adjusted EBITDA margin of 2025 at nearly 30%.
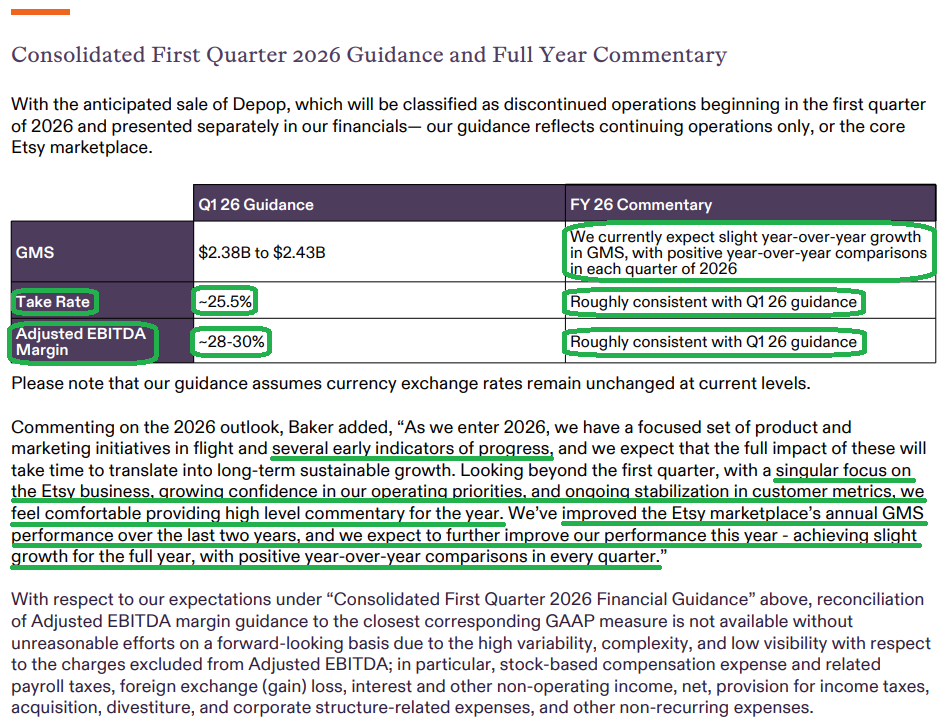
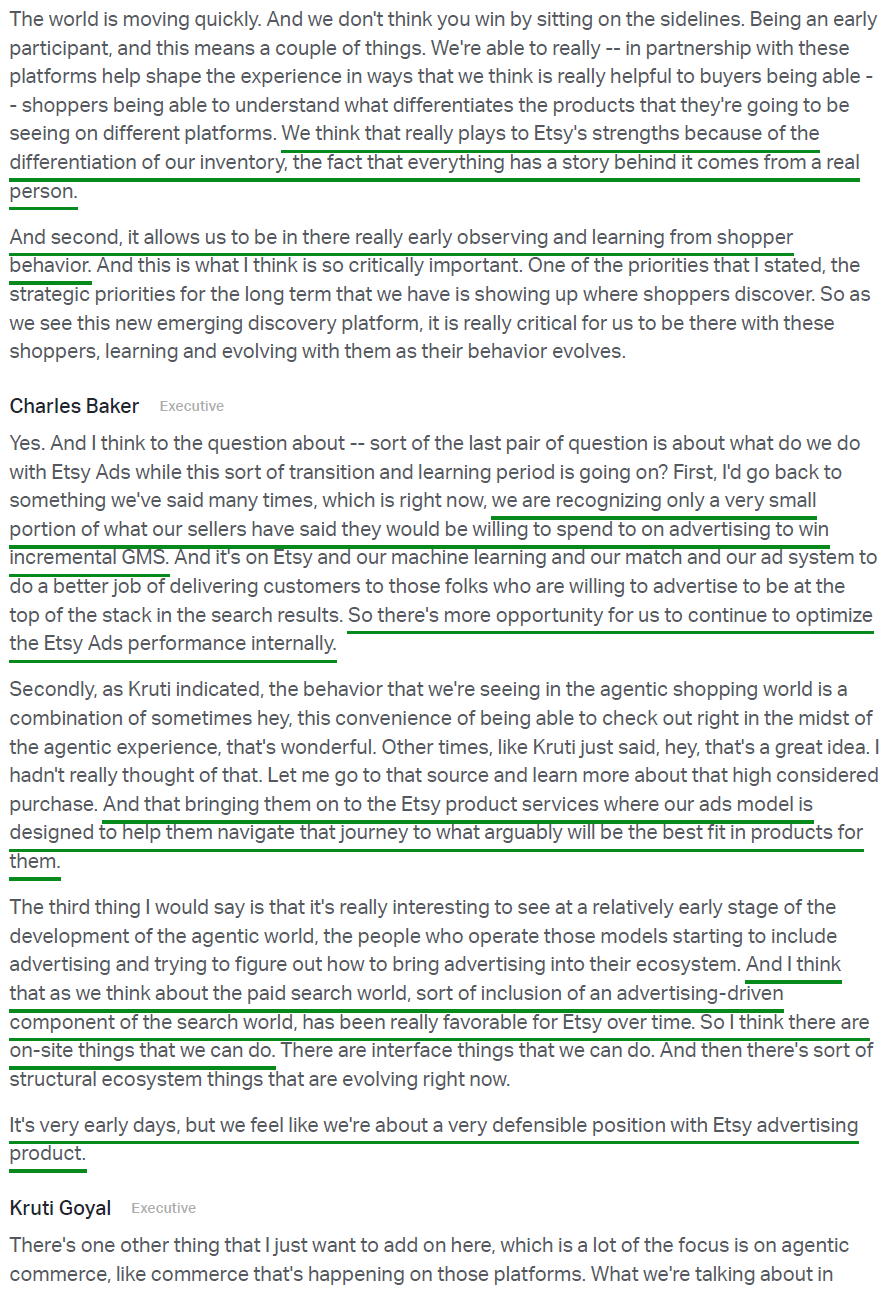
9) Consolidated take rate expanded +170 bps in Q4 to 24.5% (in line with prior guidance), bringing FY25 take rate to 24.2% (+190 bps). Expansion was primarily driven by continued strength in consolidated on site ads, with management expecting further take rate growth in 2026 to ~25.5% (+130 bps).
10) Management guided Q1 2026 GMS to $2.38B to $2.43B (+2% to +4% Y/Y). For the full year, management expects a return to positive GMS growth, with positive comps in each quarter and Q1 likely the strongest. Adjusted EBITDA margins are guided to 28% to 30% in Q1 and for FY26, implying +350 bps of expansion at the midpoint.
Earnings Call Highlights


Morningstar Analyst Note
General Market
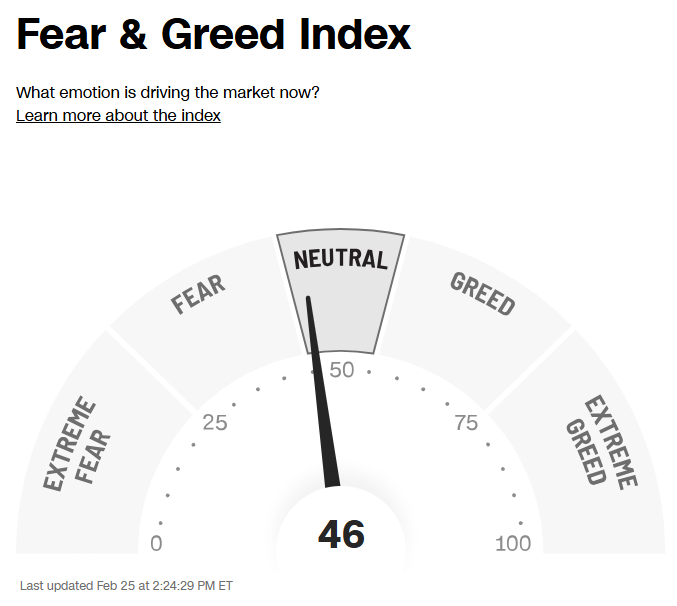
The CNN “Fear and Greed Index” ticked up to 46 this week from 36 last week. You can learn how this indicator is calculated and how it works here: (Video Explanation)
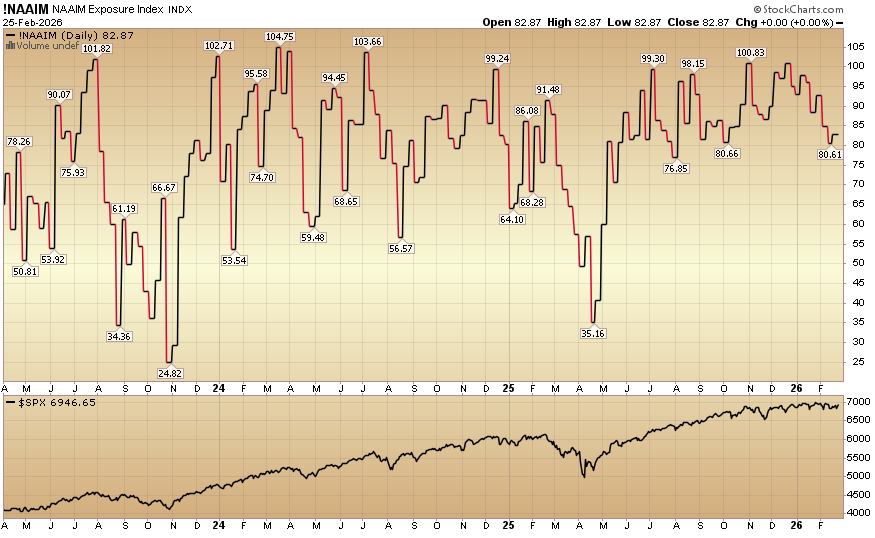
The NAAIM (National Association of Active Investment Managers Index) (Video Explanation) rose to 82.87% equity exposure this week from last week’s 80.61%.
Our podcast|videocast will be out sometime today. We have a lot of great data to cover this week. Each week, we have a segment called “Ask Me Anything (AMA)” where we answer questions sent in by our audience. If you have a question for this week’s episode, please send it in at the contact form here.
Larger accounts $5-10M+ can access bespoke service anytime here.
Not a solicitation.