

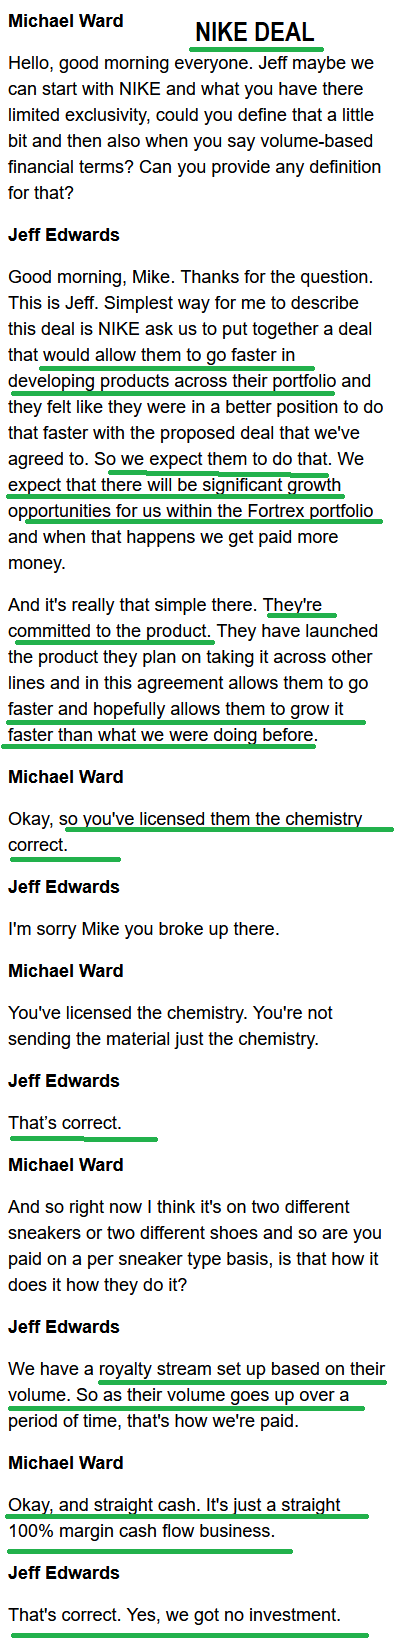
On Monday, I joined Charles Payne on Fox Business to discuss our short, intermediate, and long term outlook on the Market. Thanks to Charles, Nick Palazzo and Kayla Arestivo for having me on. We also discussed some new hedges we initiated last week – as well as how we determine when to buy and sell – along with a few picks. Check it out here:
On Tuesday I joined Aaron Bry on Benzinga for a detailed view on markets and explanation of how we hedge. We also had the time to get into more detail on three holdings:
Watch Directly On Benzinga HERE
Here were my notes ahead of the segments:
Cooper Standard (CPS): Past, Present and Future
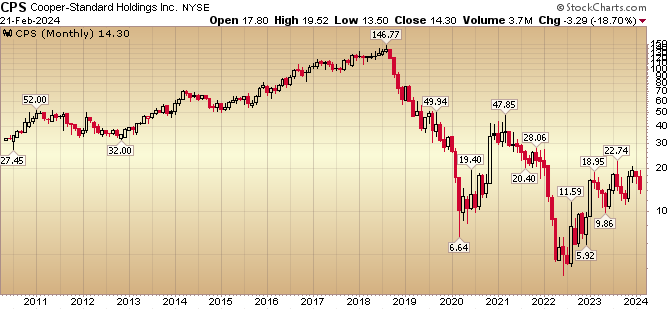
In May 2022, we built up a position in Cooper Standard at a basis of ~$5.50. We discussed it on our podcast|videocast to clients and public viewers alike. On June 7, 2022 we broke our Cooper Standard (CPS) thesis publicly on Fox Business for the first time (when it was trading ~$6/share):
We elaborated on the thesis – at a more granular level – on our VideoCast – Episode 138 on June 9, 2022:
I followed up on the thesis publicly on December 28, 2022 with Kelly O’Grady:
And again on July 18, 2023 on Yahoo! Finance. It’s very important to watch this clip as it relates to our expectations moving forward. It will also make the post below the video (from Nov. 5) make more sense:
New car volume expansion just beginning as OEM incentives now rolling. Hard to buy a used car at 9-11% financing when new car payment much lower despite higher sticker. Helps new car OEM auto suppliers like $CPS that are a leveraged play on volume recovery. Avg. car > 13yrs old. pic.twitter.com/CdshzqRr5F
— Thomas J. Hayes (@HedgeFundTips) November 5, 2023
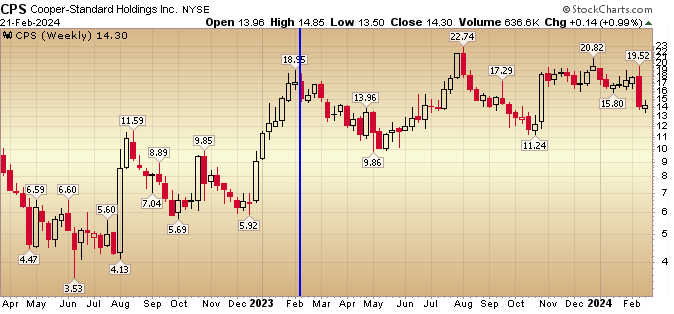
The stock is now up ~2.8x so far.
The idea emanated from Charlie Munger’s purchase of Tenneco during 2001-2003 recession:
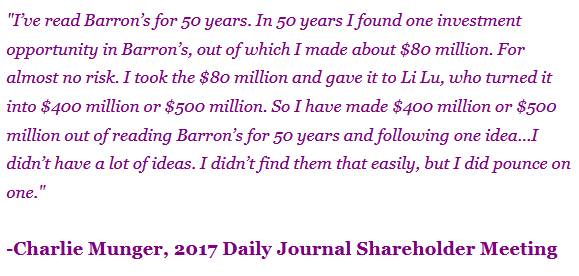
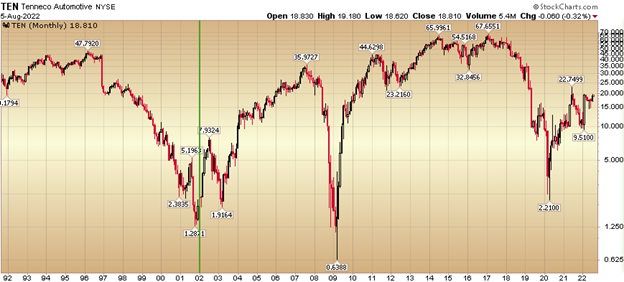
“Tenneco was a major supplier of aftermarket auto parts. Its well-known brands include Monroe shock absorbers, Walker mufflers, and DynoMax exhaust products.
At the time of Charlie Munger’s “cigar butt” investment, Tenneco — which had ~40m shares outstanding — had a market cap of ~$80m and enterprise value of ~$1.6 billion, as well as a total debt load of ~$1.52b.
He bought the stock (which was trading at ~$1.50-$2/share), as well as the bonds (11.375% notes yielding 35% to maturity).
Within a few years, the stock went up to $15, at which point he sold. The bonds went back up to par value and were called in by the company in conjunction with a refinancing.” (macro-ops)
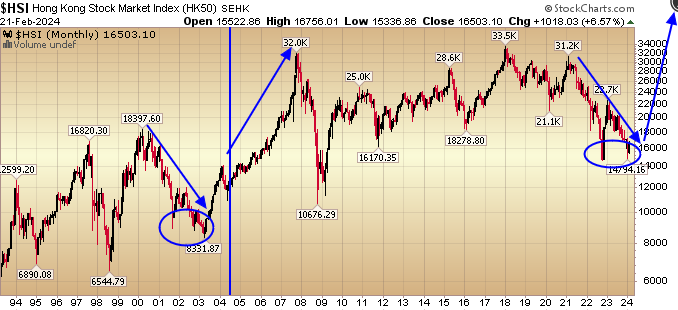
Munger turned $10M into $80M in Tenneco. He then gave the $80M to Li Lu to invest in China when no one wanted to invest in China late 2003, early 2004. What is uncanny is how similar Cooper Standard today resembles Tenneco 2003-2004 and the HSI Hang Seng index of 2023-2024 resembles the Hang Seng of 2003-2004 as well. Both were talking off after periods of “uninvestable” despondency.
 The moral of the story is that Munger was able to turn $10M into a half a billion dollars with just 2 chess moves.
Here is some information from our original thesis and updates:
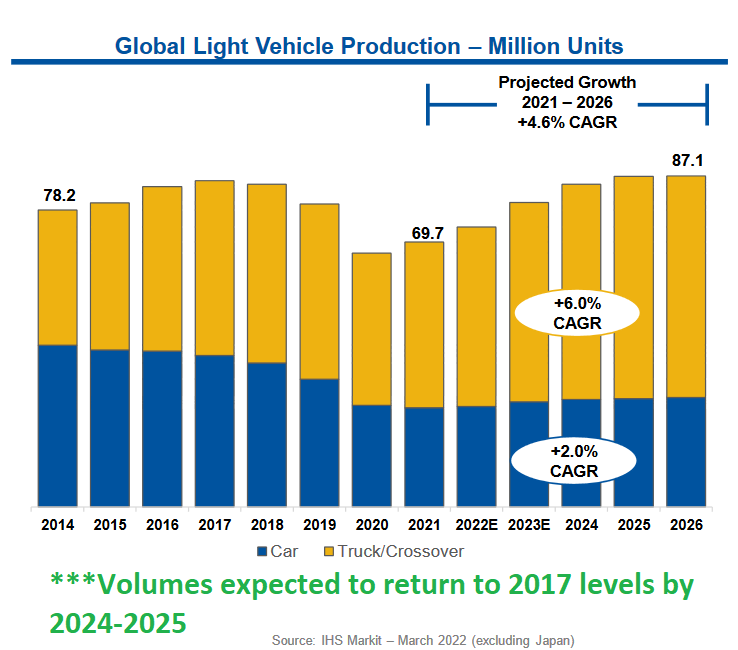
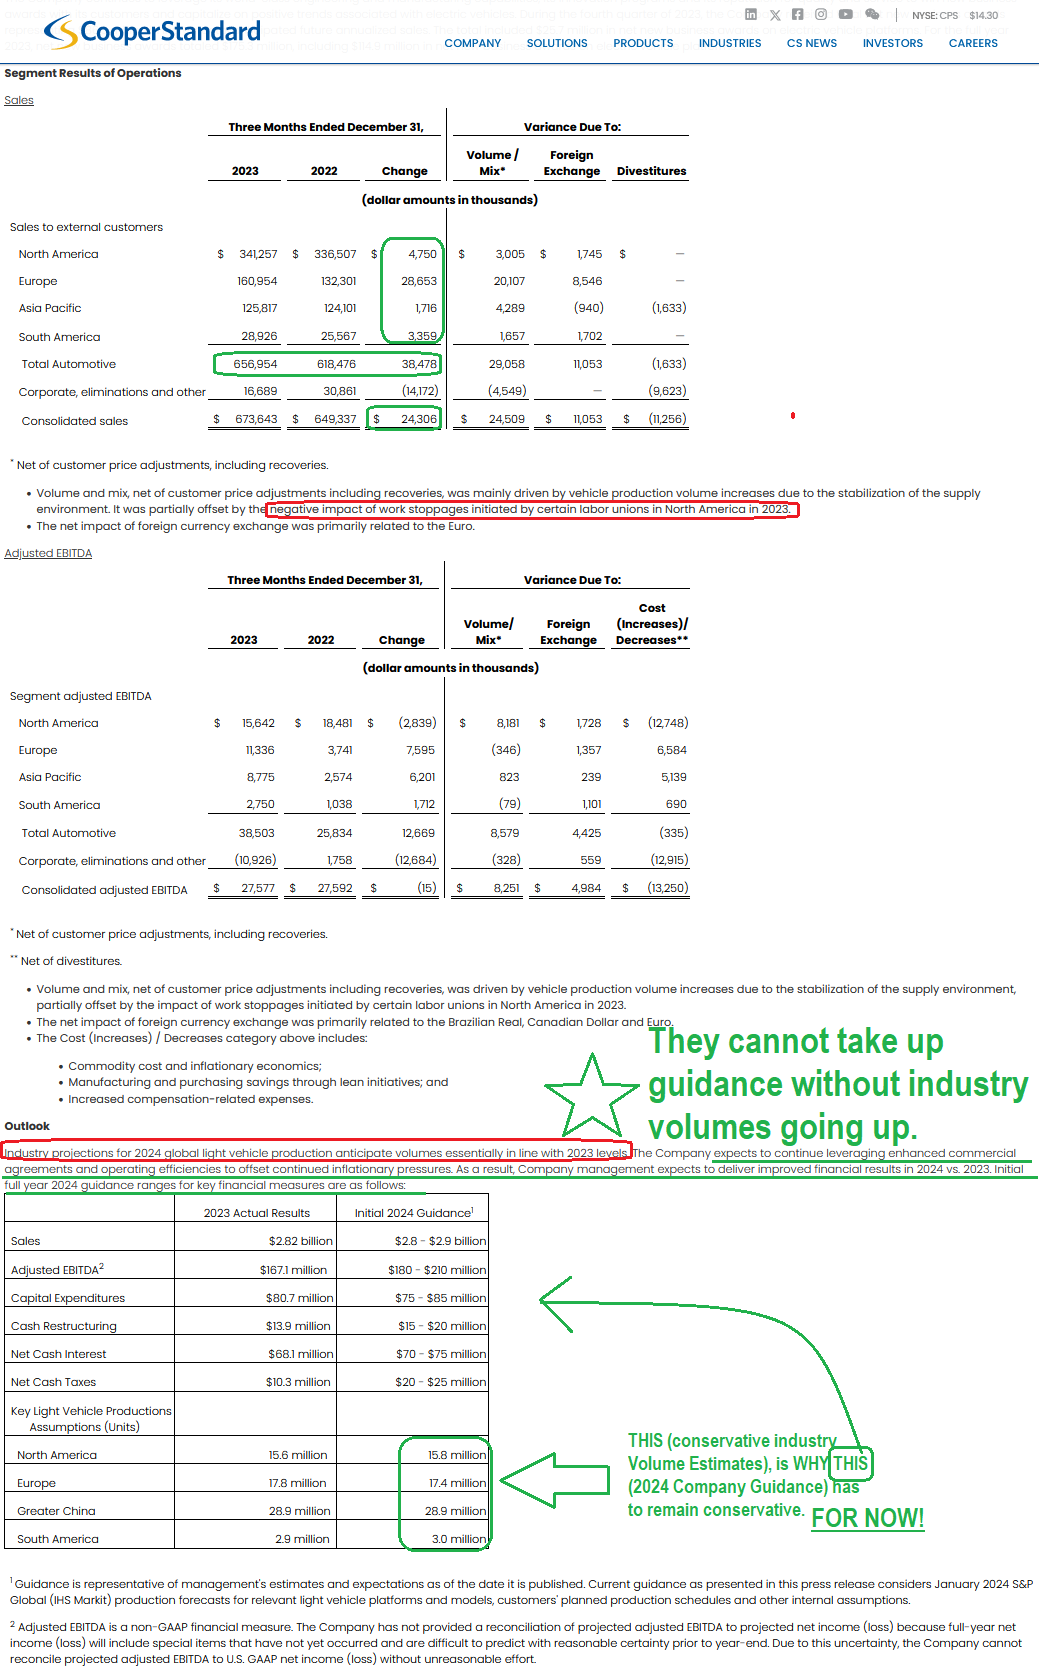
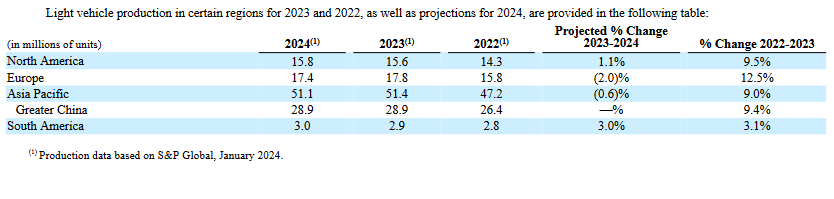
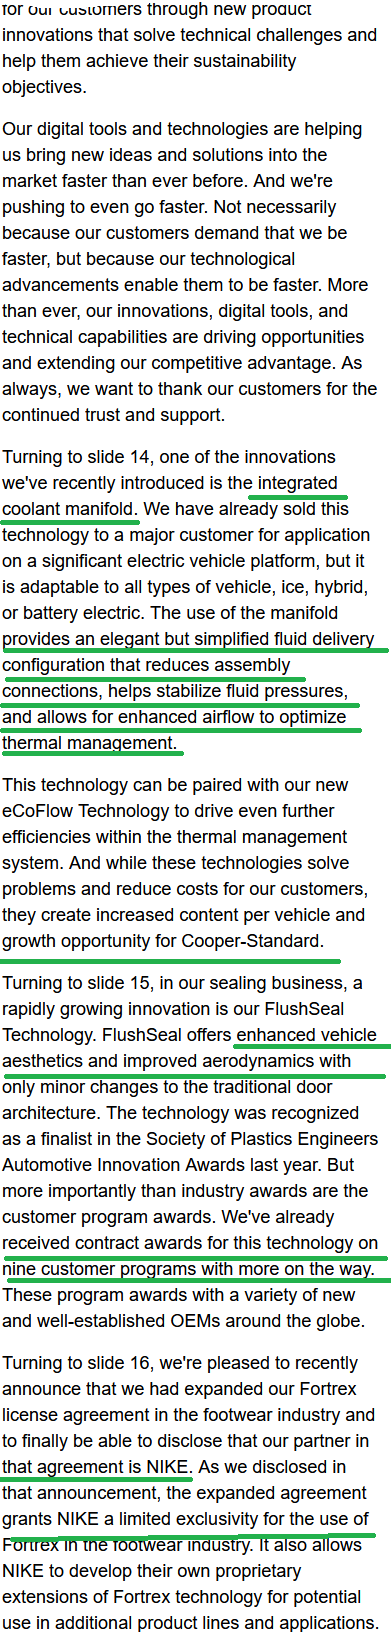
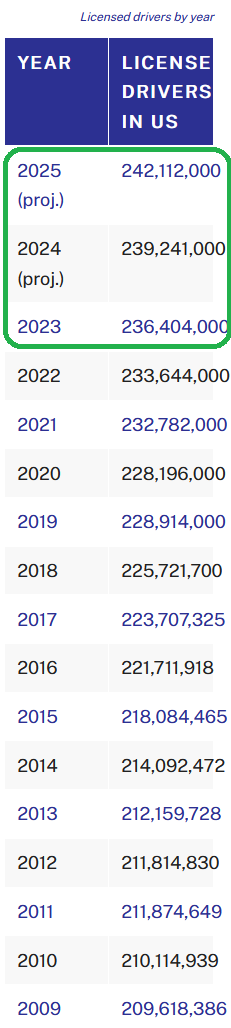
The most important table is the one above with the IHS estimates of Global Light Vehicle production. The key takeaway is that volumes are expected to return to 2017 levels by 2024 or 2025.
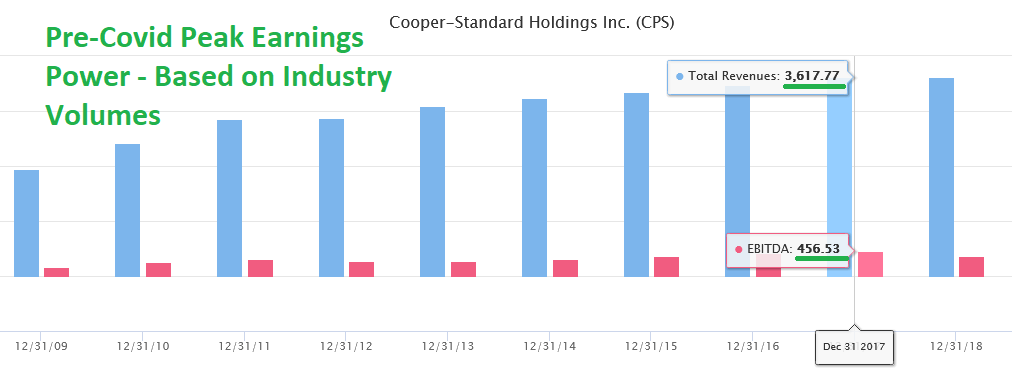
Here’s what Cooper Standard achieved in 2017:
$3.62B Revenues
$452M Adj. EBITDA (12.5% of revs)
$135M Net Income (3.73% of revs) ~18.78M fully diluted shares = ($7.21/share EPS)
Peak stock price on $7.21/share EPS was $146.78 (August 3, 2018) = ~20x P/E multiple.
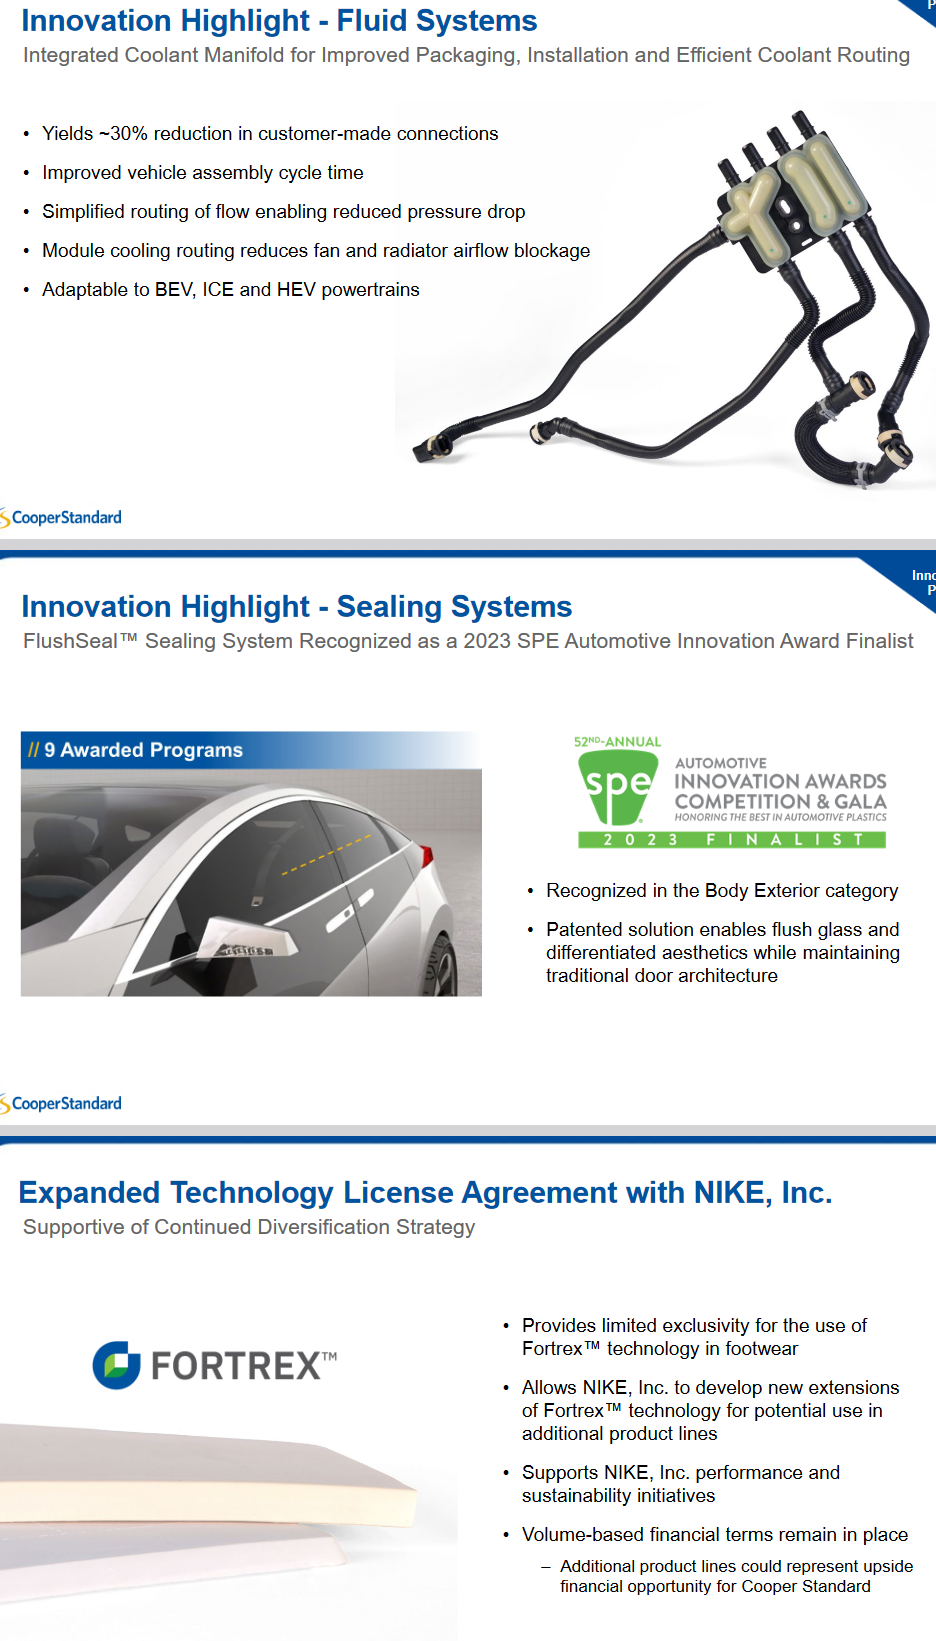
Here’s what Cooper could achieve in 2024-2025 IF INDUSTRY VOLUMES MEET EXPECTATIONS AND RETURN TO NEAR 2017 LEVELS:
$3.3B Revenues (Anti-Vibration unit sold. $320M revenue 2017)
$412M Adj. EBITDA (12.5% of revs)
$123M Net Income (3.73% of revs) ~17.16M fully diluted shares = ($7.19/share EPS).
At 10x P/E = $71.90. At 2017 peak multiple = $146.37. Cut both in half and you’re still at a 5-10x+ bagger.
BUT, you say, EPS will be effected by increased interest expense. THAT IS CORRECT. Interest expense in 2017 was $42M, but TAXES were $74M. While the Interest expense in 2024 or 2025 will be ~$100M (assuming they don’t refinance at lower rates in coming year(s)), keep in mind they have $130MM in Deferred Tax Assets. They will just be moving into profitability and will be able to use a significant portion of that asset to dramatically reduce their cash tax obligation. In effect, it’s possible that EPS in 2024 or 2025 could be a tick higher than 2017 on the same volumes. The key will be what multiple is assigned (peak or trough)?
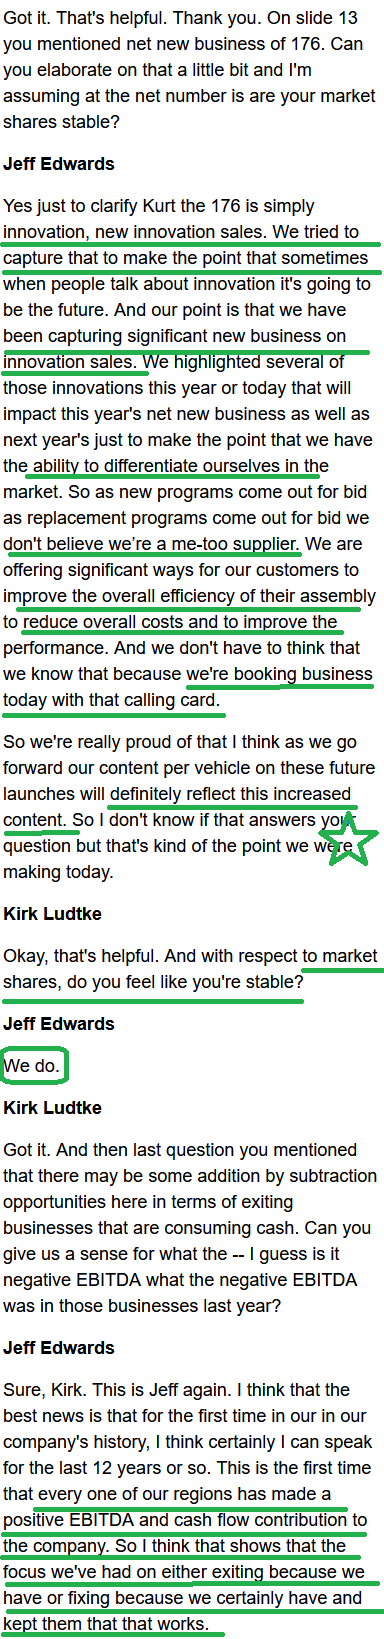
As I have said numerous times on our podcast|videocast there are 3 key reasons I bought ownership in the company: 1) management respects equity (they have brought share count DOWN over the years), 2) management comp is tied to ROIC (return on invested capital) 3) the operating leverage in this business is unparalleled coming out of industry troughs.
*Past performance is no guarantee of future results. See “terms” above.
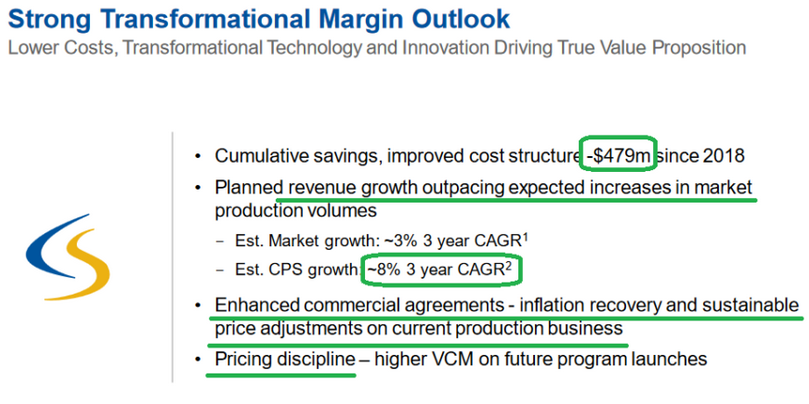
This last slide (from November) is the most important. While there is low estimated market growth, they also have conservative revenue growth for the company at 8% CAGR. An 8% CAGR implies $3.15B of top-line revenue in 2025 and $3.4B in 2026. This puts us right in line with our original thesis from last year:
“$3.3B Revenues (Anti-Vibration unit sold. $320M revenue 2017)
$412M Adj. EBITDA (12.5% of revs)
$123M Net Income (3.73% of revs) ~17.16M fully diluted shares = ($7.19/share EPS).
At 10x P/E = $71.90. At 2017 peak multiple = $146.37. Cut both in half and you’re still at a 5-10x+ bagger.”
KEEP IN MIND OUR ORIGINAL THESIS IS PREDICATED ON 2017 MARGINS. AS YOU CAN SEE THEY HAVE TAKEN OUT MEANINGFUL COSTS IN THE LAST FEW YEARS (AND INCREASED PRICING) WHICH MEANS OUR BOTTOM LINE TARGETS COULD BE EXCEEDED OR REACHED EARLIER THAN ANTICIPATED. Time will tell…
What’s NEW?
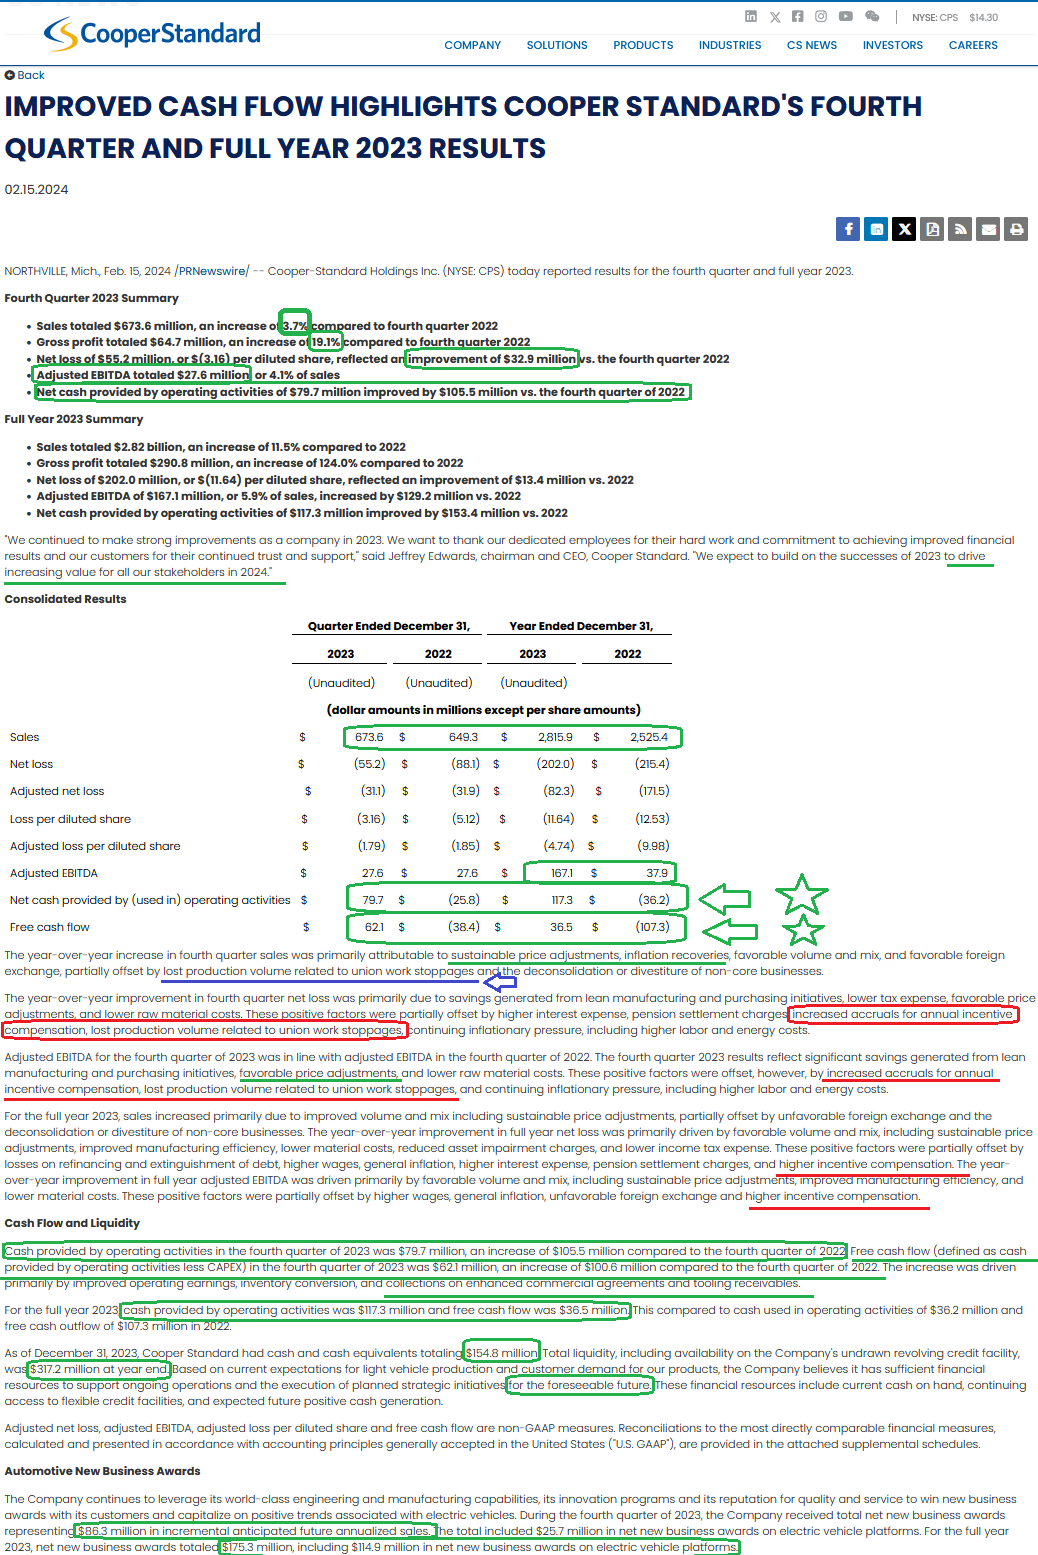
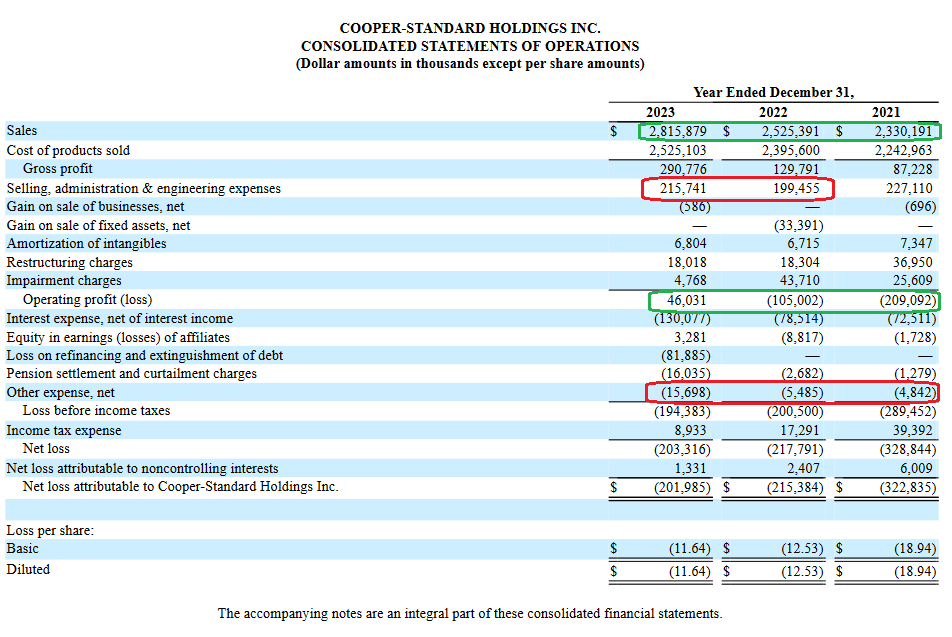
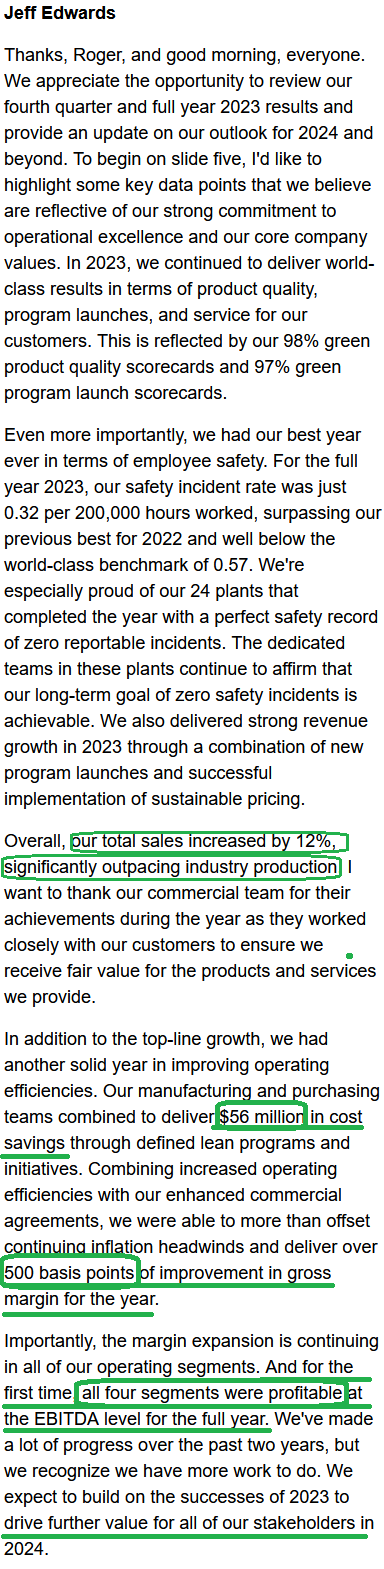
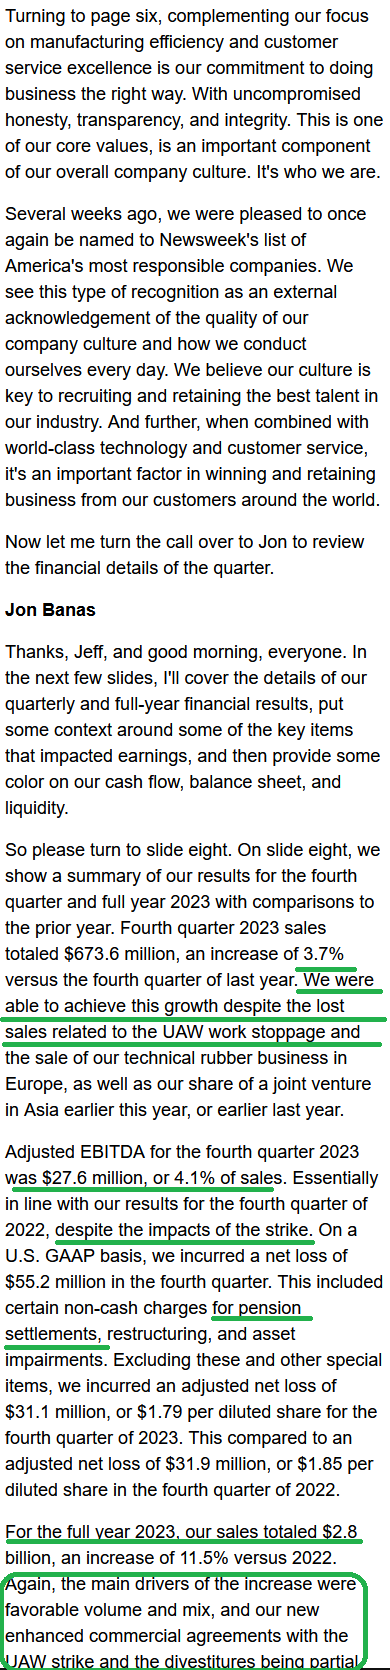
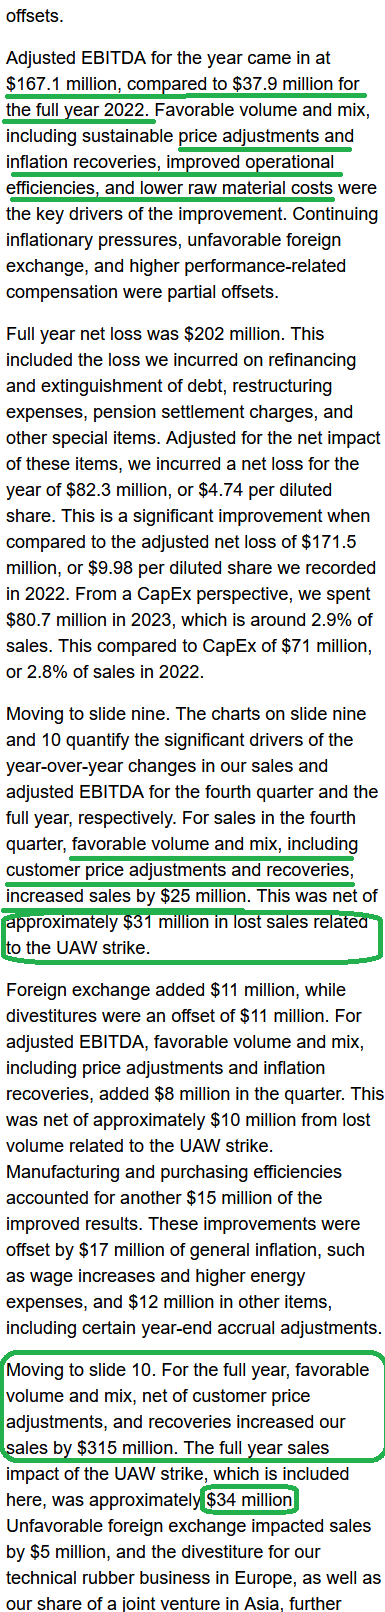
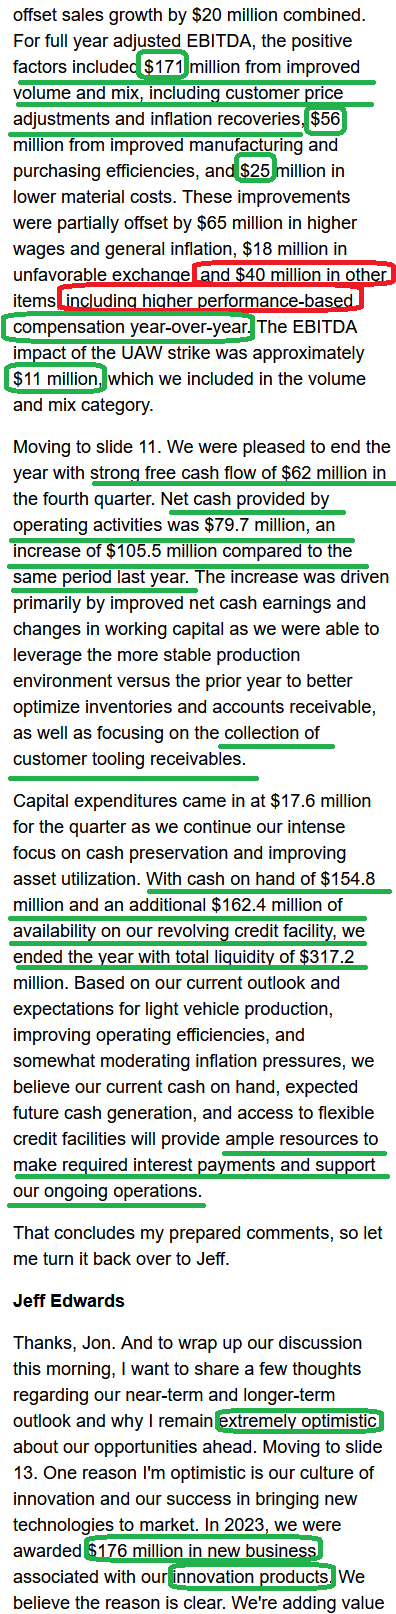
Cooper Standard reported Earnings Results on Thursday. Similar to PayPal, the results were good on all metrics, but the guidance was conservative.
Highlights from Friday’s Earnings Call:
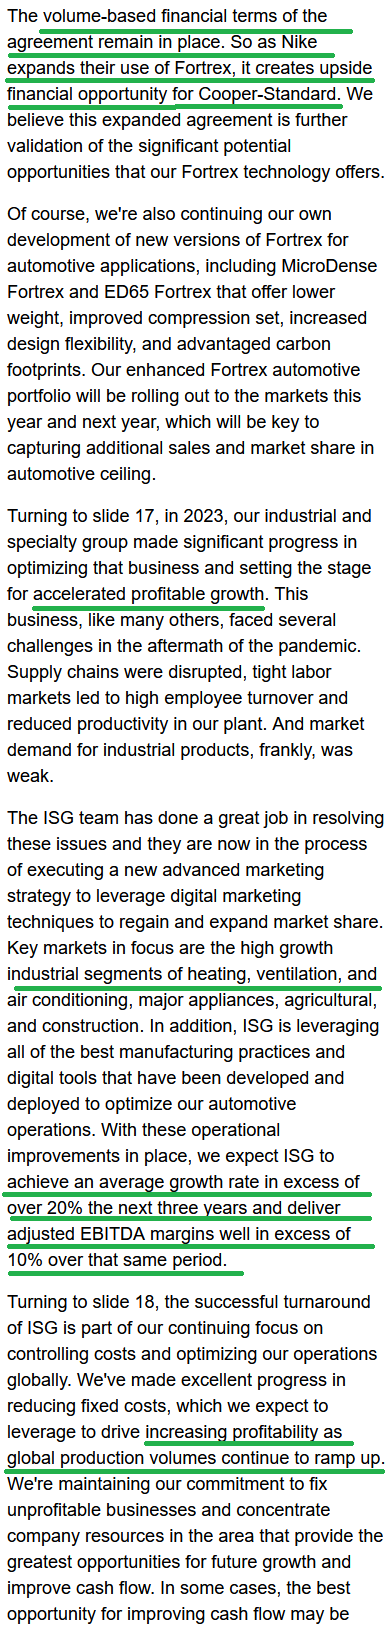
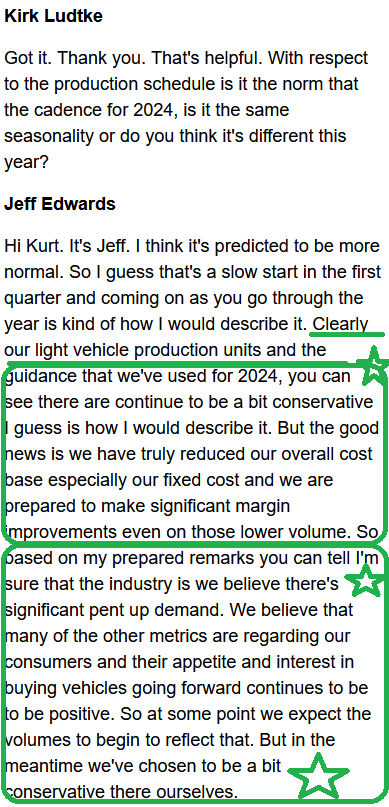
Just to give you an idea of how conservative management is being (and the Industry Estimates of Volumes are), let’s look at what they promised last year at this exact time: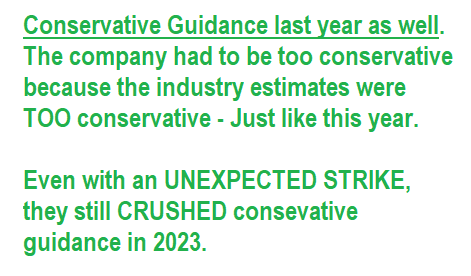
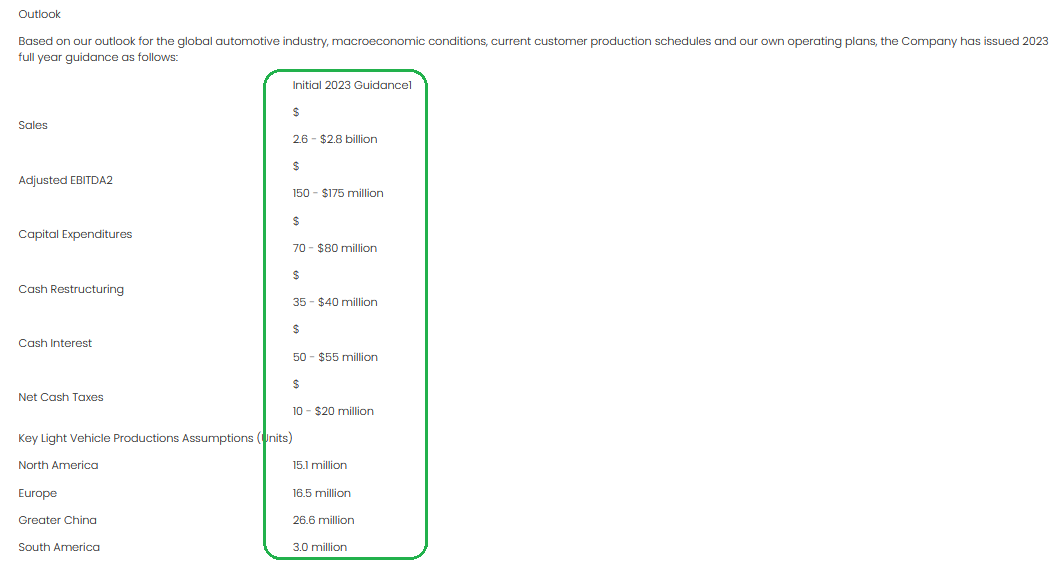
Here is a table showing what CPS management promised at this time last year (without knowing about the “black swan” of weeks of cut production) and what they delivered.
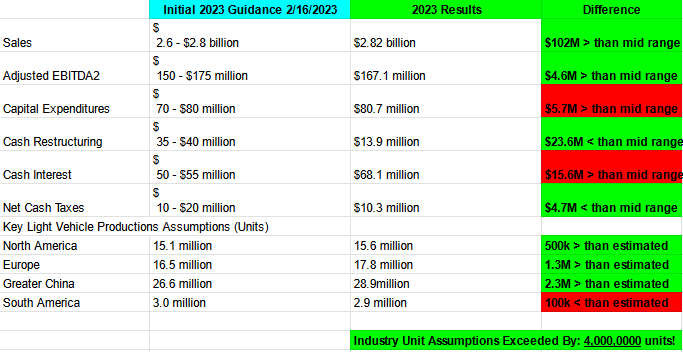
 You can see they pulled the exact same “under promise, over deliver” at this time last year. The stock did not like the conservative guidance, but recovered to new highs as the year wore on.
Of important note, the stock was trading abnormally high relative to 2022/2023 fundamentals – as they had just refinanced their debt out to 2027 and taken solvency risk off the table (in what was a very treacherous/closed credit market in Q4 2022). The conservative guidance was an excuse for the stock to settle down.
This year we have not run up into the conservative guide. We have simply been grinding sideways passing time for the next new catalysts (higher industry volumes and implementation of higher margin renegotiated contracts) to arrive.
Not only did management dramatically exceed expectations despite the strike, but you can also see that IHS estimates of Units were too conservative by 4,000,000 units! On that basis, we could see close to 70M units in 2024 (up from 65.2M).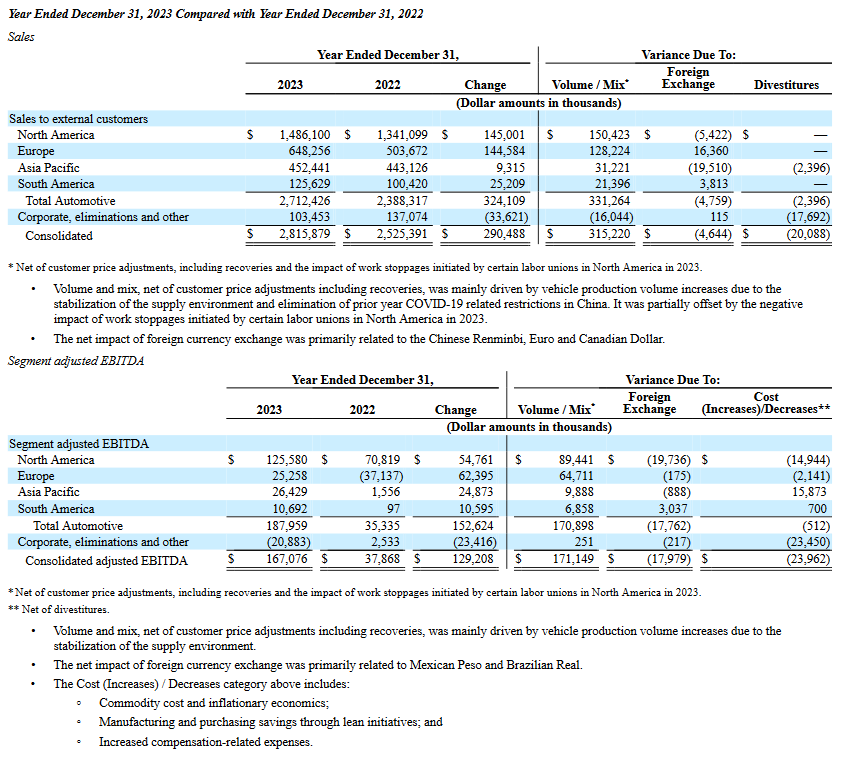
 There are a few points I would draw attention to:
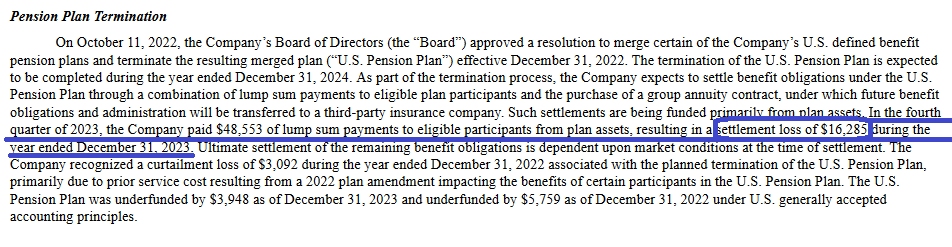
- A high accrual for pension of $16M as well as performance comp targets met that bumped up comp for the quarter. On a normalized basis (without the one-off massive performance comp/other items ~$40M), Adjusted EBITDA would have been well above the TOP end of the guidance range (even WITH the multi-week shutdown in production). The difference between the OEM (GM, F, STLA, etc) Q4 results and CPS results is the fact that OEMs book SALES, CPS books units PRODUCED. The strike shut down PRODUCTION (what CPS is paid for) for WEEKS.
- Much of the enhanced margin from renegotiated contracts has not yet kicked in.
More color in the conference call:
Now onto the shorter term view for the General Market:
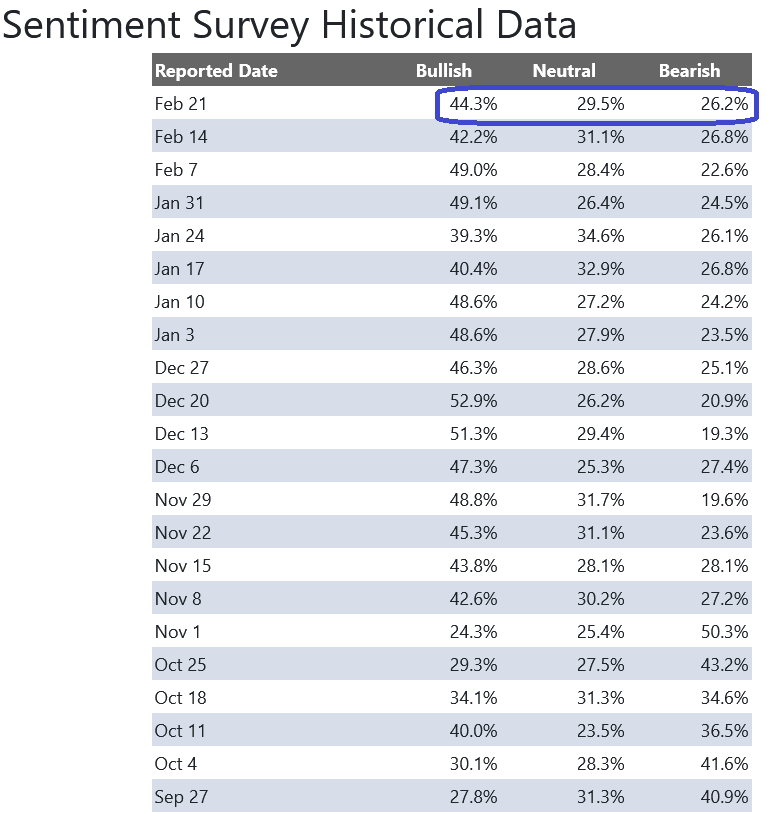
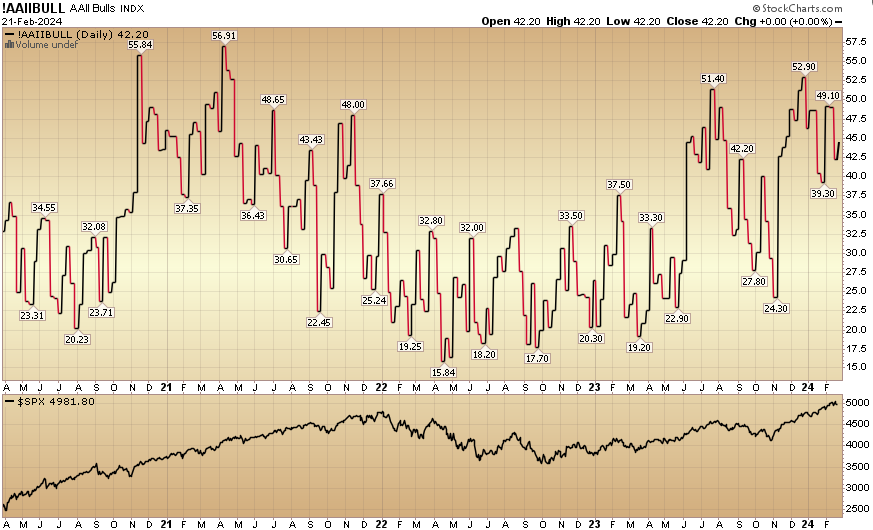
In this week’s AAII Sentiment Survey result, Bullish Percent (Video Explanation) ticked up 44.3% from 44.2% the previous week. Bearish Percent ticked down to 26.2% from 26.8%.
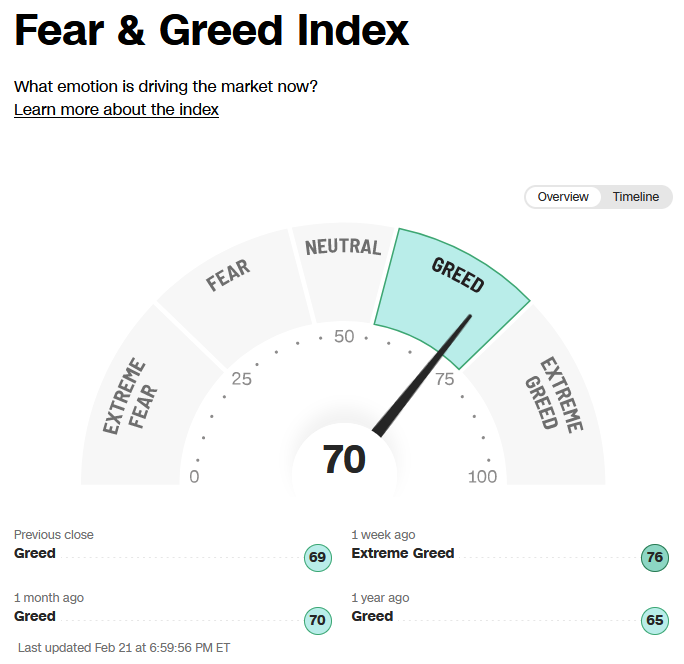
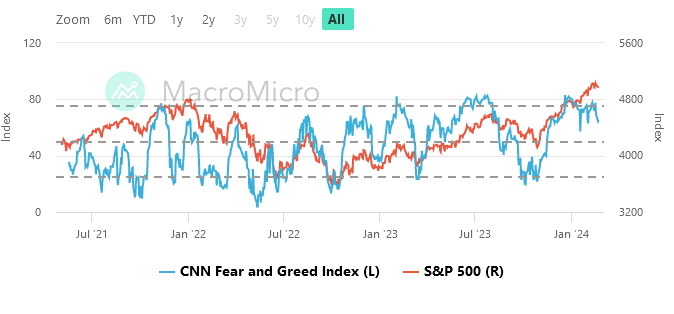
 The CNN “Fear and Greed” ticked down from 73 last week to 70 this week. You can learn how this indicator is calculated and how it works here: (Video Explanation)
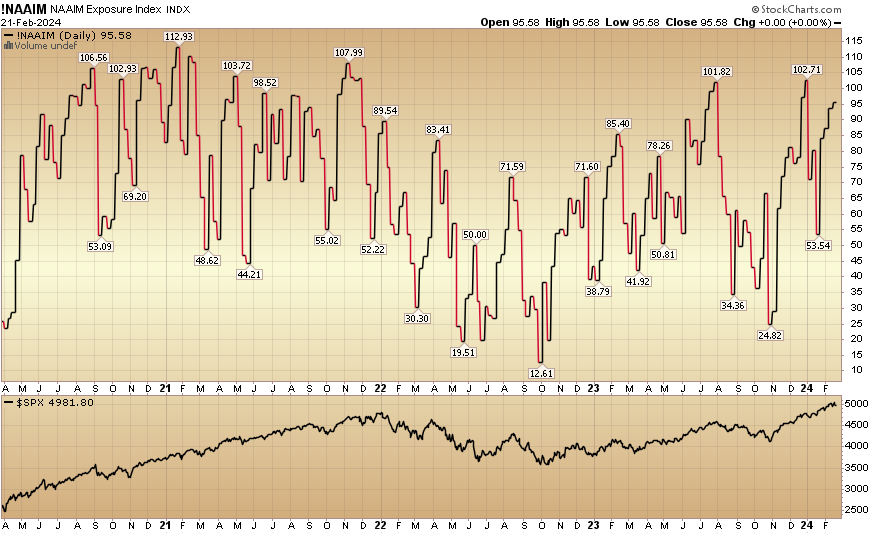
 The NAAIM (National Association of Active Investment Managers Index) (Video Explanation) ticked up to 95.58% this week from 93.77% equity exposure last week.
Our podcast|videocast will be out late today or tomorrow. Each week, we have a segment called “Ask Me Anything (AMA)” where we answer questions sent in by our audience. If you have a question for this week’s episode, please send it in at the contact form here.
Congratulations to all of the new clients that came in from our Q1 raise. We will re-open to smaller accounts $1M+ again sometime in Q2. Larger accounts $5-10M+ can access bespoke service beforehand at their preference here.
*Opinion, Not Advice. See Terms


