
In 1972, Stealers Wheel released the song “Stuck in the Middle with You.”
It is a song written by Scottish musicians Gerry Rafferty and Joe Egan and performed by their band Stealers Wheel.
The band performed the song on the BBC’s Top of the Pops in May 1973, and the song charted at No. 8 in the UK Singles Chart. It also became an international hit, reaching No. 6 in the US Billboard Hot 100. (wikipedia)
The salient lyrics regarding this week’s market commentary are as follows:
Well I don’t know why I came here tonight
I’ve got the feeling that something ain’t right
I’m so scared in case I fall off my chair
And I’m wondering how I’ll get down the stairs
Clowns to the left of me
Jokers to the right
Here I am stuck in the middle with you
Yes I’m stuck in the middle with you
And I’m wondering what it is I should do
It’s so hard to keep this smile from my face
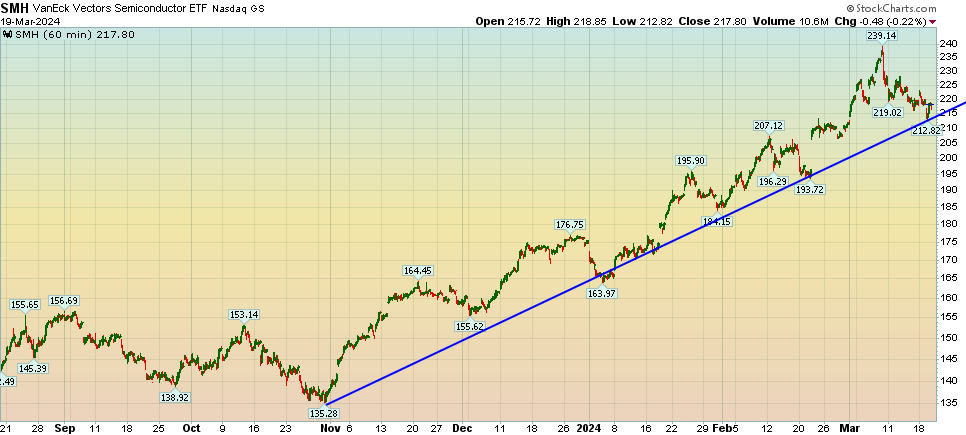
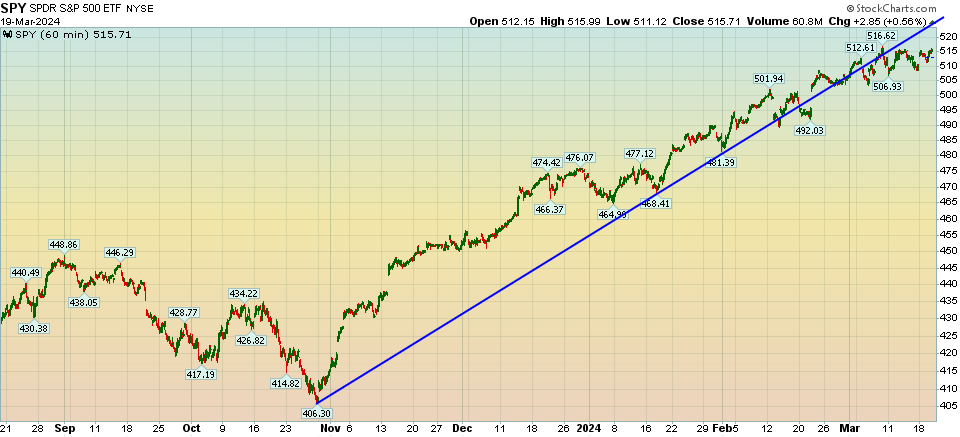
In the last week (s) we have put on tactical hedges/shorts across our portfolio. 1% of total equity capital is an S&P index put spread. If we get a 4-8% pullback it has an EV (expected value of ~5.61X – 461%). So far it is unprofitable. Another 1% of total equity is a put spread on the semiconductor index. If we get a 4-8% pullback on that sector it has an EV (expected value of ~5.74X – 474%). So far it is almost a double.
The remainder of our assets are long. So how can you be bullish (long) and bearish (protective short) at the same time?
The answer is, the odds favor a short term pullback, but none of our active positions are at/above fairly/fully valued (so we ignore the short term noise and do not create unnecessary tax events in the name of short term volatility). The several that were (fully valued) – we harvested profits and re-allocated to new opportunities (companies) that are just beginning their recovery and have (double+ – multi-bagger) EV (expected values) over the next 12-48 month time-frame.
The purpose of the 2% of leveraged hedges/shorts are to 1) dampen volatility for clients if we do get a market pullback, but more importantly, 2) create ~10% of NEW FREE capital to go LONG with at the trough of the pullback. That 2% of quantified “risk” could lead to as much as 20%+ of excess returns by year-end if it plays out.
On the flip side, if the hedges/shorts “fail” that means the remaining 98% of the portfolio is appreciating (likely at a pace greater than the general indices due to higher beta, modest derivative overlay, and plain old good stock analysis). In other words, the 2% “lost” will be earned back through excess return if the market continues to climb.
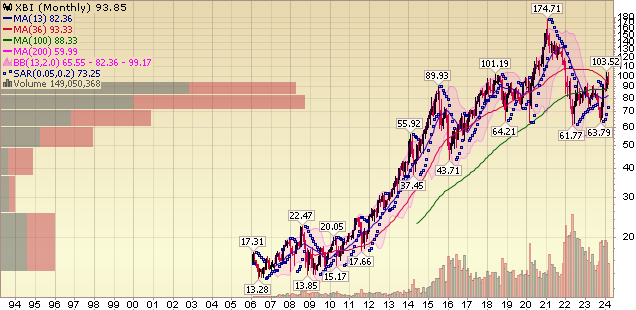
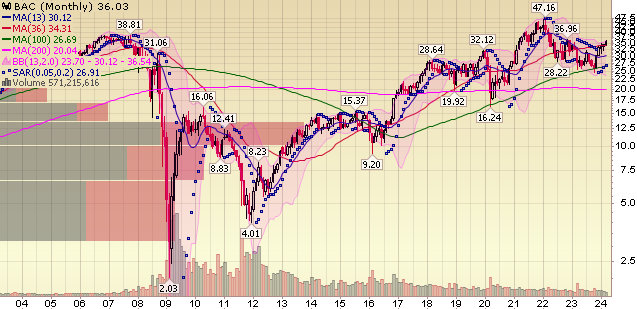
While many of these have been big moves in terms of short-term percentage gains, they are barely even getting started and not at the stages we would want to be a seller (just to avoid a little short-term bumpiness). More importantly – are some of the names we’ve discussed publicly and have barely moved or are just beginning to move – along the lines of PYPL and BABA as well as many more we have not discussed publicly and are working on for our clients.
So yes, there are some pockets of the market that appear stretched and could use a breather – but could get more stretched first. We don’t know, which is why we buy high quality businesses (preferably generating free cash flow) that are temporarily impaired and on the mend back to normalcy. We hold them until they reach our predetermined analysis of fully valued (regardless of headlines, fed, wars, noise, politics, etc). We take defined risk asymmetric shorts from time to time – when the odds are in our favor for large gains and our risk is limited.
That’s what we’ve always done. That’s what we’ll always do. We don’t chase “shiny new objects” and never will. Why? #1 – We enjoy the daily “treasure hunt” for great (proven, durable) businesses at reasonable prices, and #2 – It works.
Mixed Messages
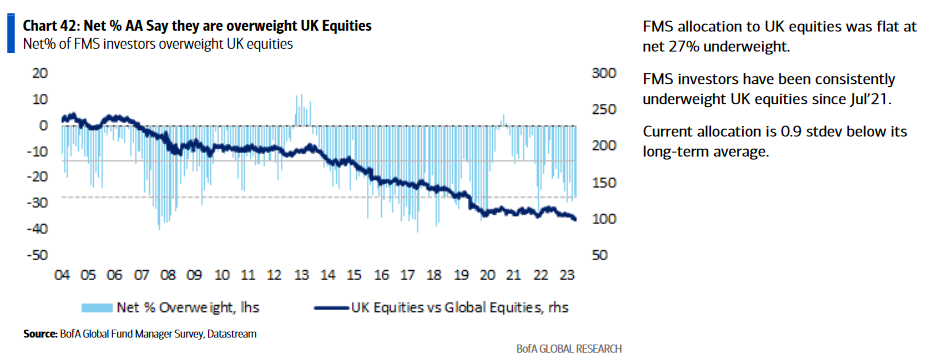
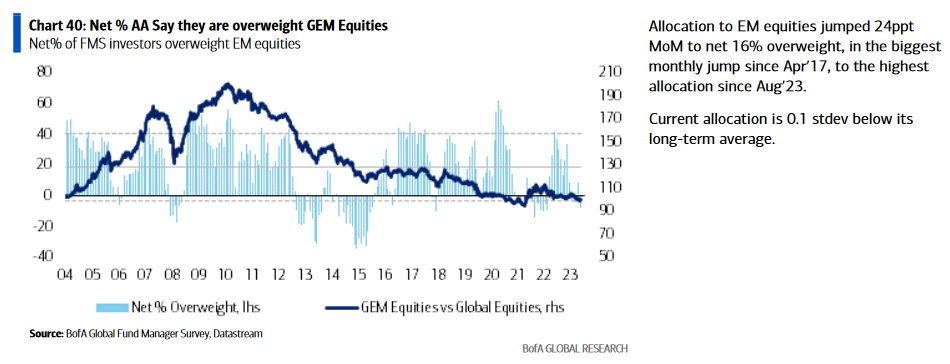
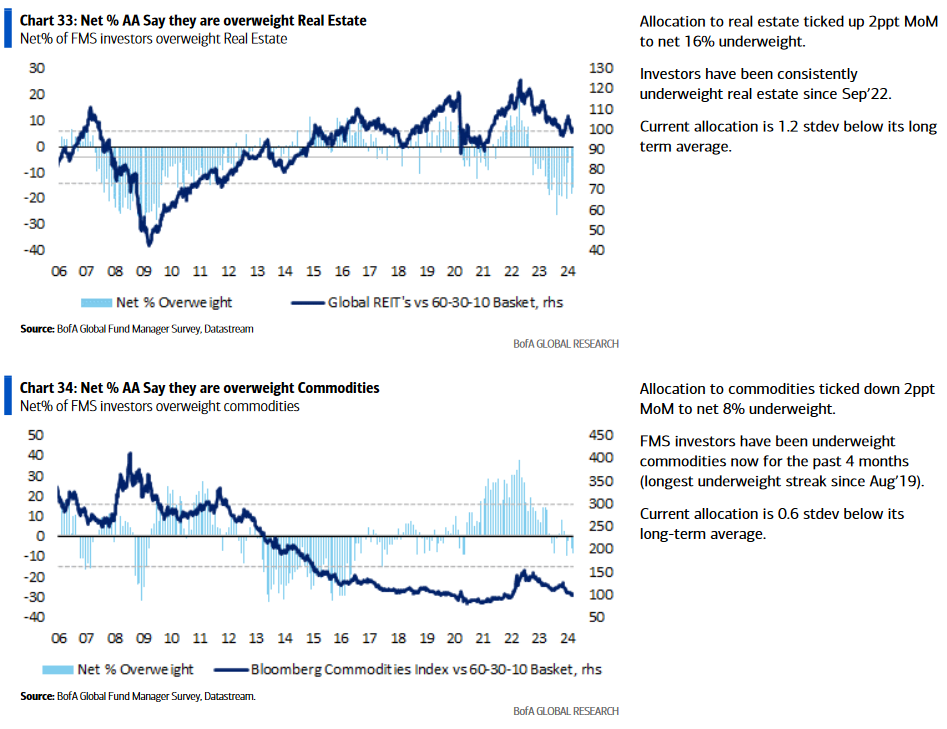
On Tuesday, we put out a summary of the monthly Bank of America “Global Fund Manager Survey.” This month they surveyed 198 managers with $527B AUM.
March 2024 Bank of America Global Fund Manager Survey Results (Summary)
Sentiment has definitely turned bullish, but not to the extreme “obvious” levels where you want to raise a lot of cash and put more shorts on. Managers are just coming out from under their desks after missing much of the last 1.5yr rally and now chasing the “shiny objects” to catch up.
Let’s take a look at a few points:
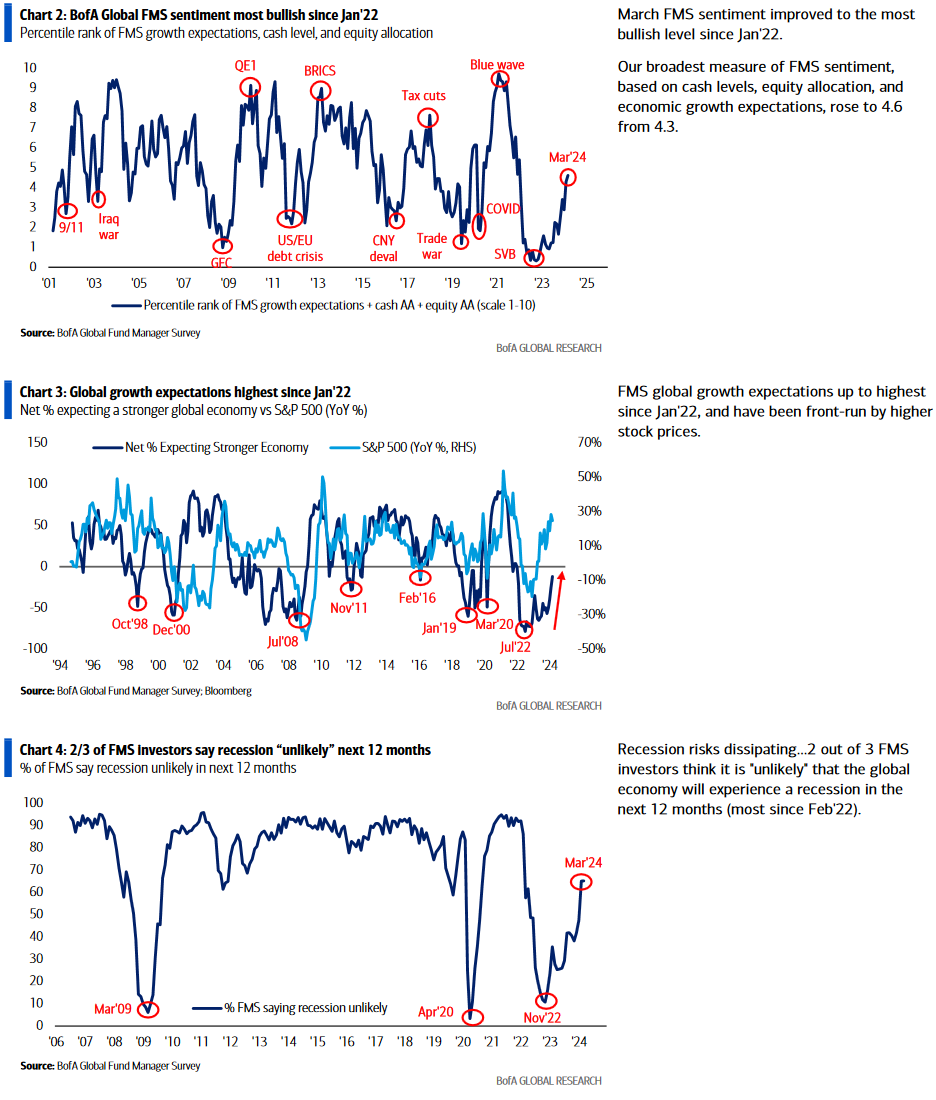
1) The “Risk Appetite” is at the highest level since Nov 2021. On the one hand you can say “see we peaked 3 months later.” On the other hand you could say “that is normal coming out of large draw-downs like 2022.” Just look at Feb 2013 (after the 2011 crash), sentiment was at the same level and the music kept playing for another 2 years.
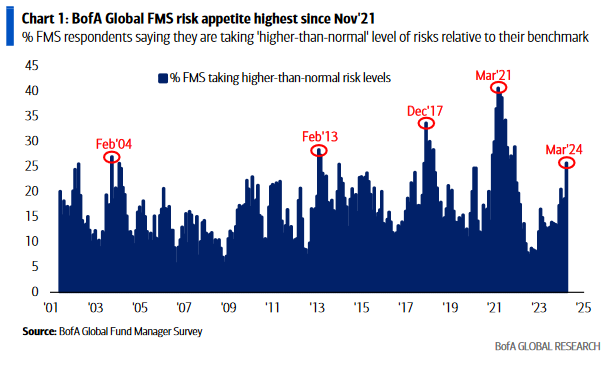
I think conditions are closer to what we saw in 2013 than 2021.
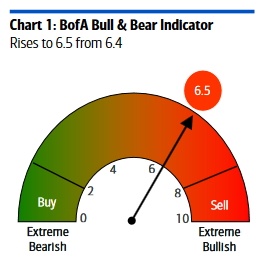
2) Managers are the “most bullish since Jan 2022,” but nowhere near a PEAK bullish level that you would ordinarily see before a MAJOR correction (10-20%+):
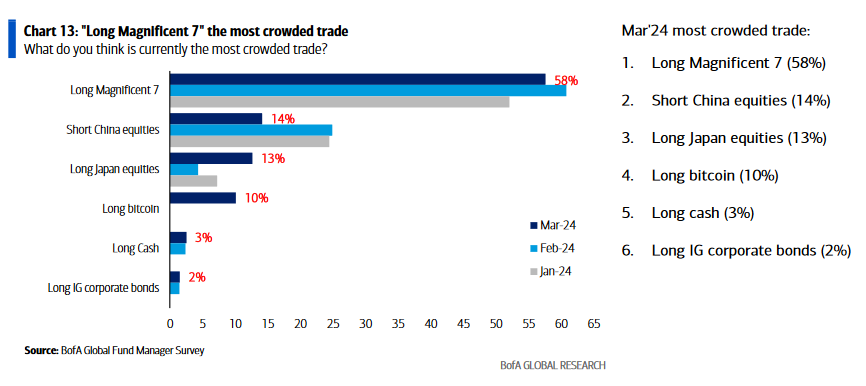
4) Managers are still overweight the “Magnificent 7” but view it as the “Most Crowded Trade!”
Japan
One thing I am keeping an eye on is the sea change in the global coordinated central bank policy. For the past two years, the Fed & ECB have engaged in aggressively restrictive policy to drain liquidity and put a lid on inflation. They have largely succeeded. During that time, the Bank of Japan was a regular provider of liquidity through ZIRP (zero interest rate policy), QE (buying Gov’t bonds), and open market purchases of equities (through ETFs). That has now changed as the Bank of Japan is moving to normalize its policy and begin a rate hiking cycle. Without Japan’s perpetual liquidity backstop, the Fed and ECB may not have the runway they think they have – to hold rates at current elevated levels – while keeping record debt-laden government’s borrowing costs at sustainable levels.
We will look for clues from the Fed Press Conference today as to whether they acknowledge this risk and speak in a dovish flexible tone (June is a “live meeting”) or they push a hawkish agenda – citing recent bumpiness in inflation data.
Oddly, somehow we are positioned for both, and that is why they say:
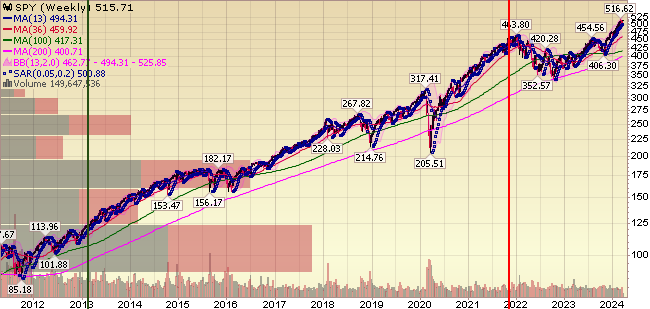
Now onto the shorter term view for the General Market:
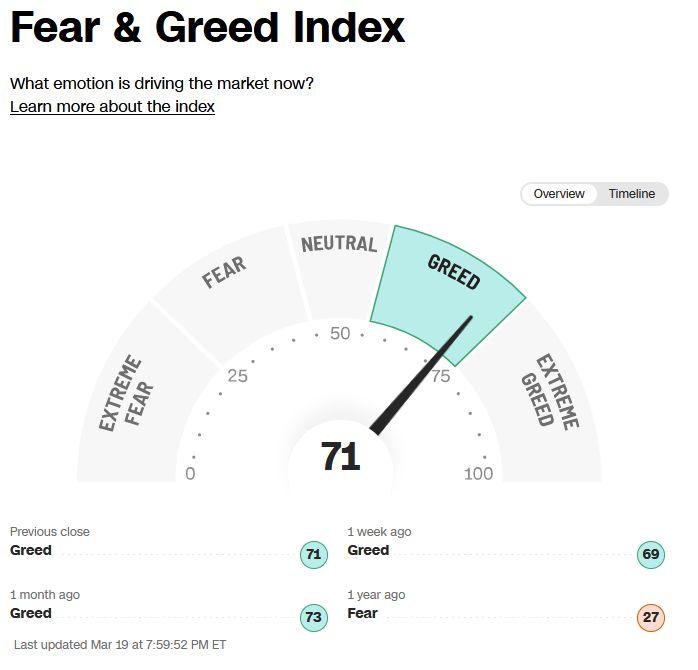
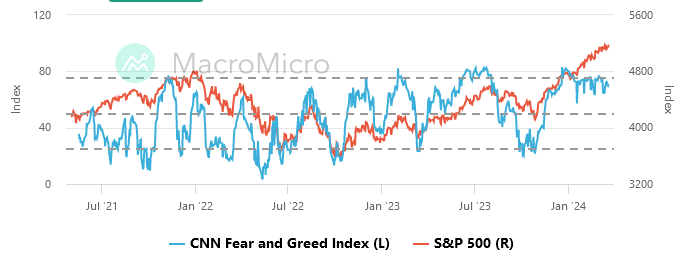
The CNN “Fear and Greed” flat-lined from 70 last week to 71 this week. You can learn how this indicator is calculated and how it works here: (Video Explanation)
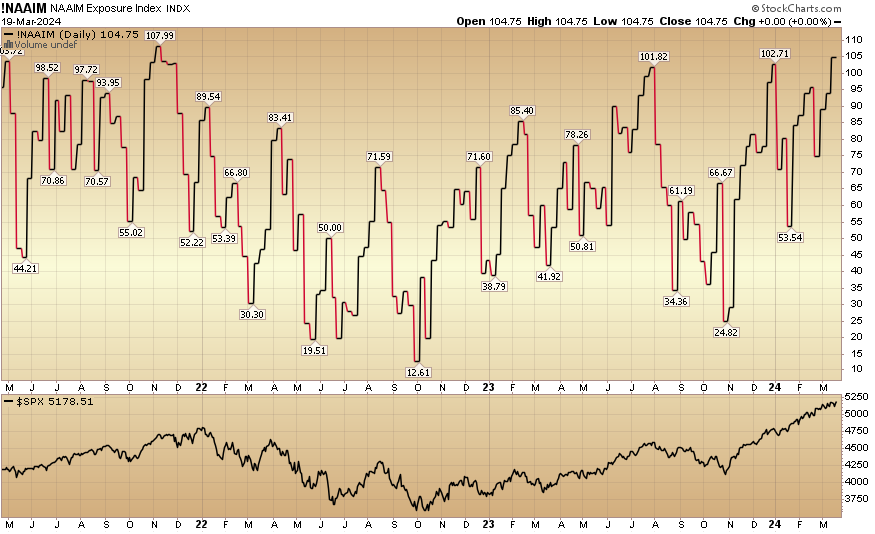
The NAAIM (National Association of Active Investment Managers Index) (Video Explanation) rose to 104.75% this week from 93.99% equity exposure last week.
Our podcast|videocast will be out later today. Each week, we have a segment called “Ask Me Anything (AMA)” where we answer questions sent in by our audience. If you have a question for this week’s episode, please send it in at the contact form here.
Congratulations to all of the new clients that came in during our early Q1 raise. We will re-open to smaller accounts $1M+ again sometime in Q2. Larger accounts $5-10M+ can access bespoke service beforehand at their preference here.
*Opinion, Not Advice. See Terms


