Our Applied Stock Market Indicator of the Day is:
Elliot Wave Pattern Theory

Our Applied Stock Market Indicator of the Day is:
Elliot Wave Pattern Theory
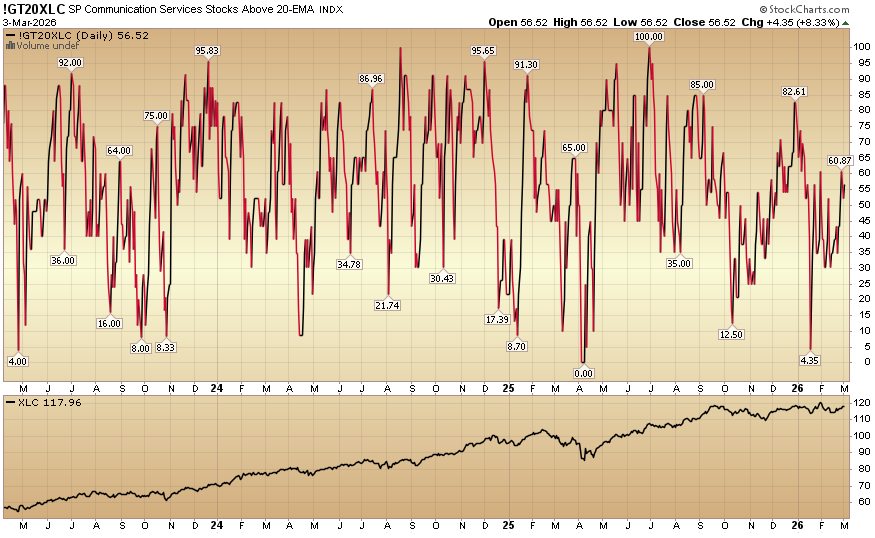
Our Applied Stock Market Indicator of the Day (in 60 Seconds or Less) is:
S&P Communication Services Stocks Above 20 EMA
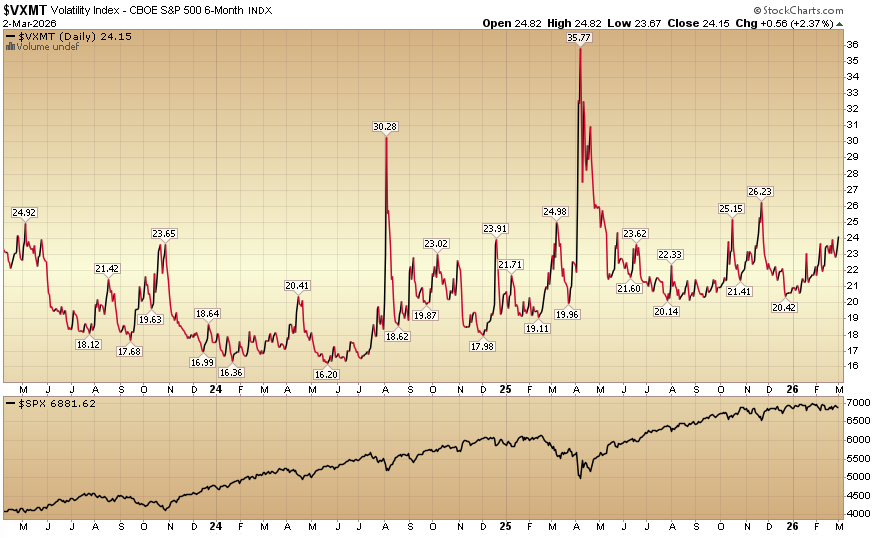
Our Applied Stock Market Indicator of the Day (in 60 Seconds or Less) is:
Volatility index – CBOE S&P 500 6-Month
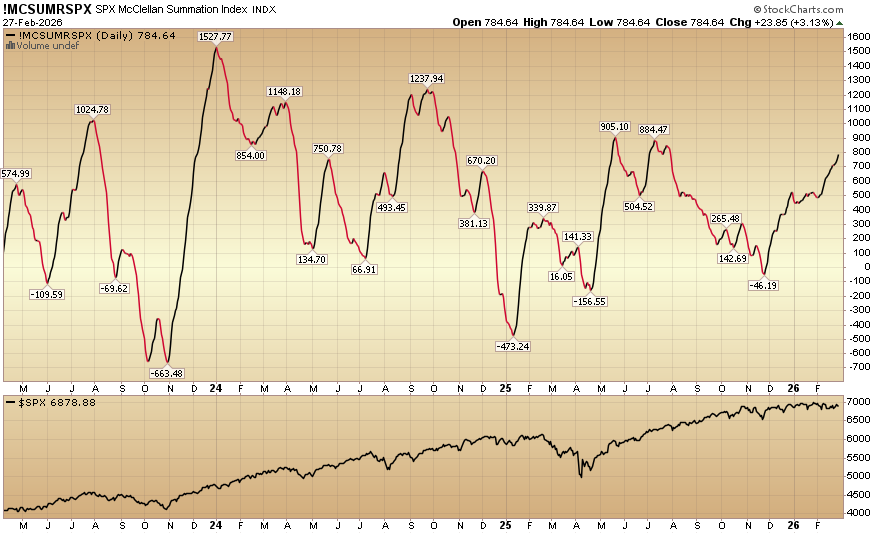
Our Applied Stock Market Indicator of the Day (in ~60 Seconds) is:
S&P 500 McClellan Summation Index
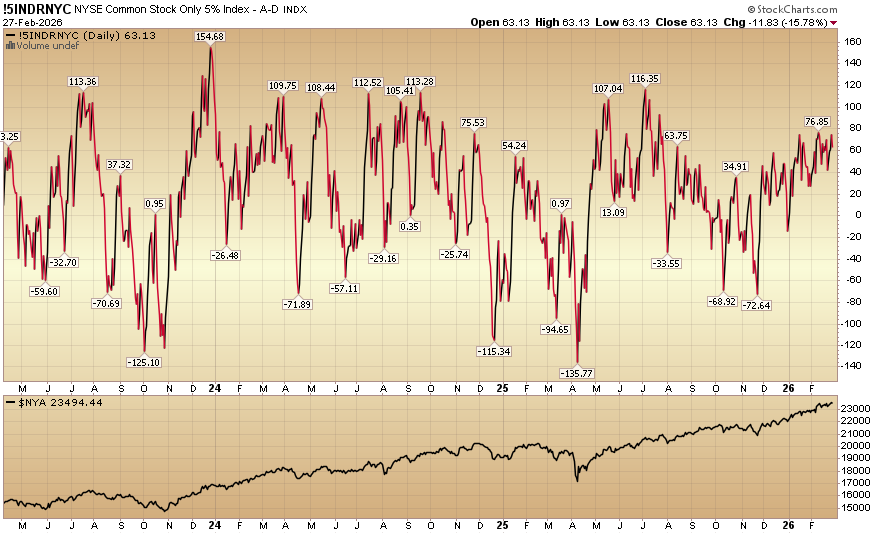
Our Applied Stock Market Indicator of the Day (in 60 Seconds or Less) is:
NYSE Common Stock Only 5% Index A D
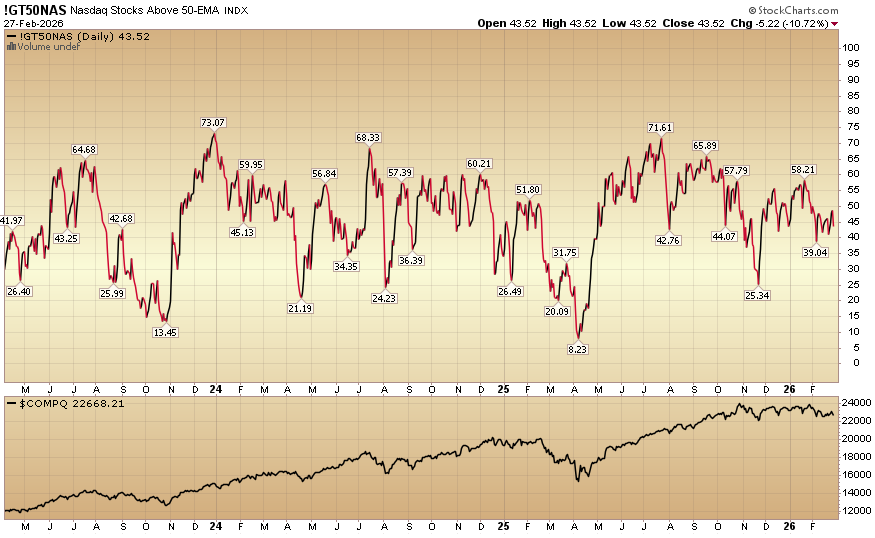
Our Applied Stock Market Indicator of the Day (in 60 Seconds or Less) is:
Nasdaq Stocks Above 50 EMA
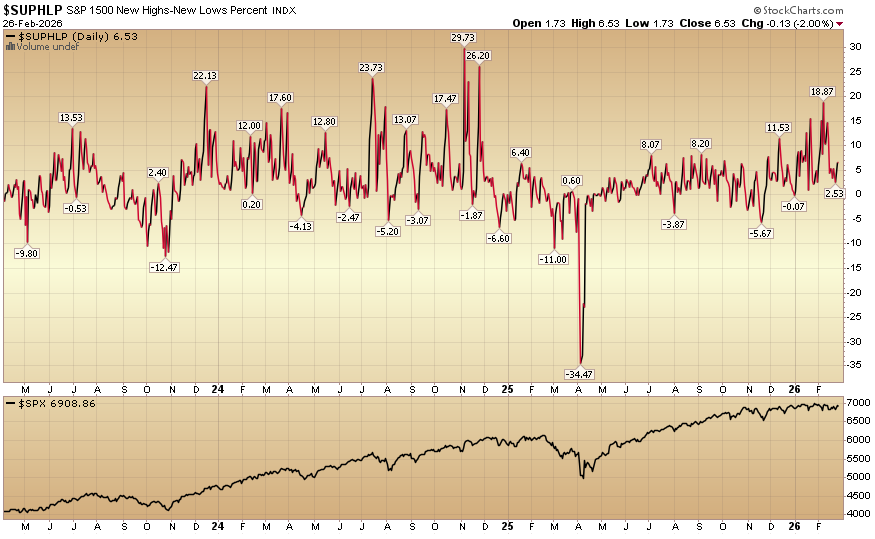
Our Applied Stock Market Indicator of the Day (in 60 Seconds or Less) is:
S&P 1500 New High New Low Percent
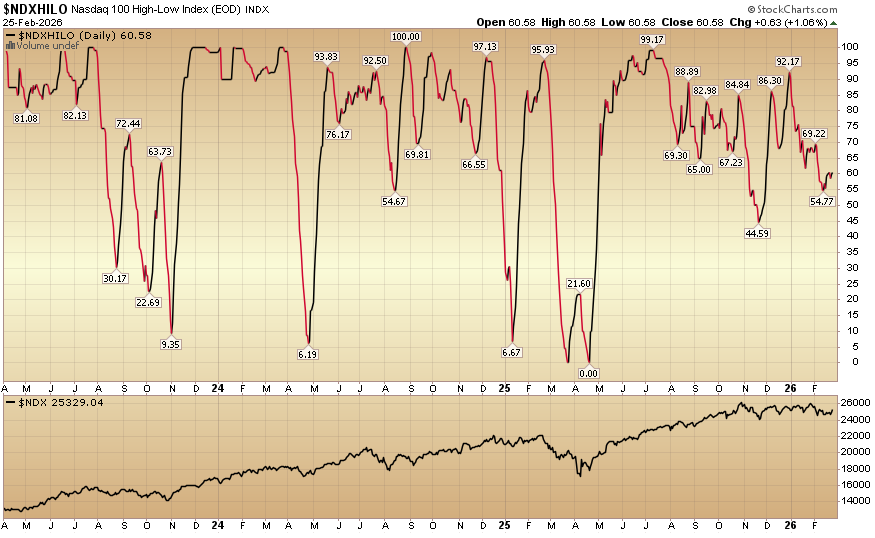
Our Applied Stock Market Indicator of the Day (in 60 Seconds or Less) is:
Nasdaq 100 High Low Index
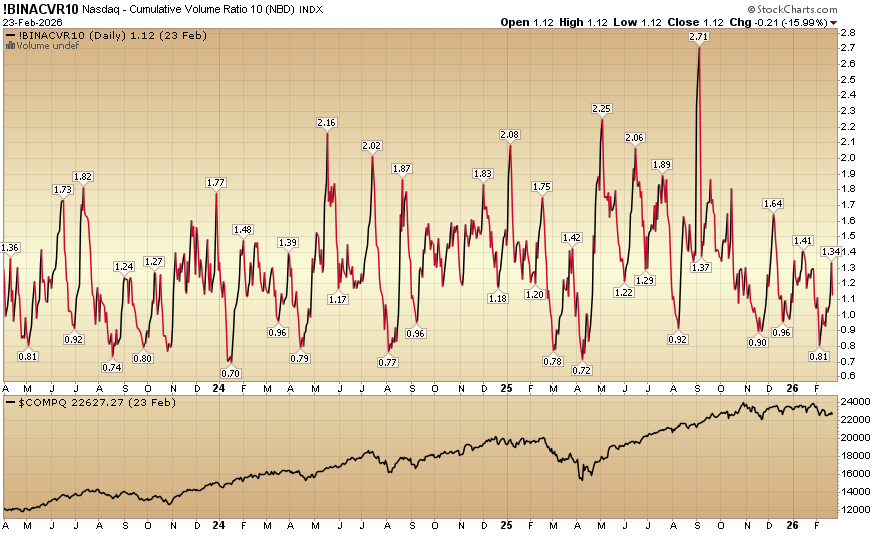
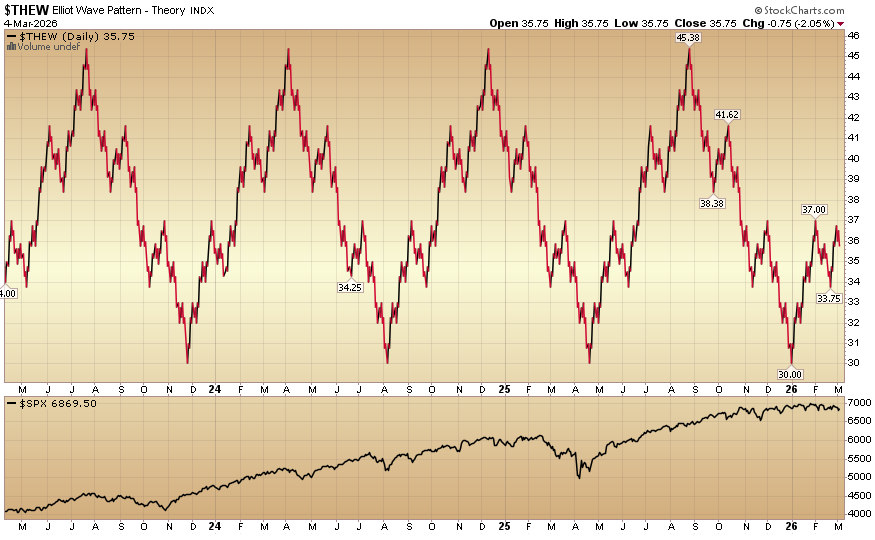
Our Applied Stock Market Indicator of the Day is:
Nasdaq Cumulative Volume Ratio 10
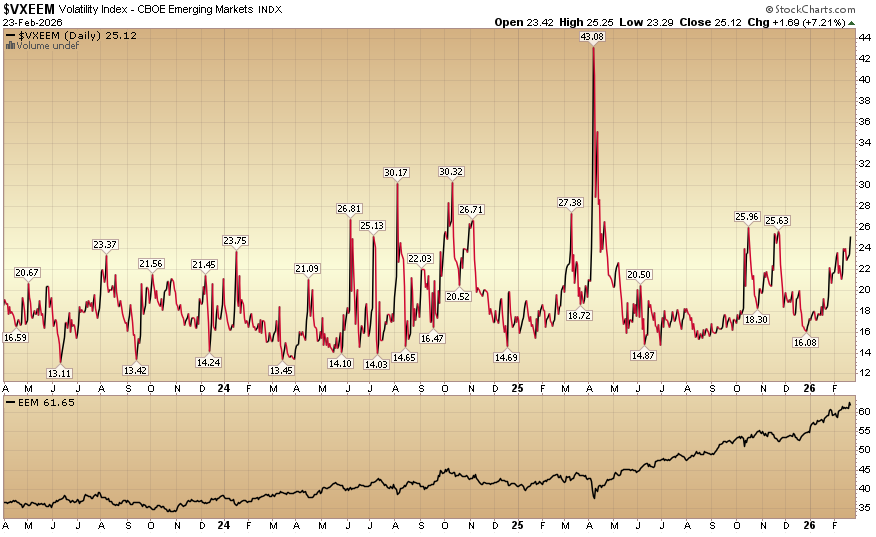
Our Applied Stock Market Indicator of the Day is:
Emerging Markets VIX
SCROLL DOWN TO ENTER YOUR EMAIL
FREE: Professional Market Data/Analysis, Company by Company Stock/Financial Analysis, plus AMA questions from our audience - by a Seasoned Pro - each week.
Proven Value: Over 300+ Episodes... Over 6+ years running...
First Added Bonus for signing up:
We will send you a FREE copy of Warren Buffett's Favorite Book (credited for changing his life):

Second Added Bonus: Be in the KNOW: Get Hedge Fund Tips® FREE Daily Email Newsletter NOW.
100% privacy. No email sharing. No spam.
GET YOURS NOW: