
On Tuesday, I joined Ashley Webster on Fox Business – the Claman Countdown – to discuss the Stock Market, Fed and Opportunities. Thanks to Liz and Ellie Terrett for having me on:
Watch in HD directly on Fox Business
Show Notes Ahead of Segment:
-WSJ reported Fed may go 75bps tomorrow.
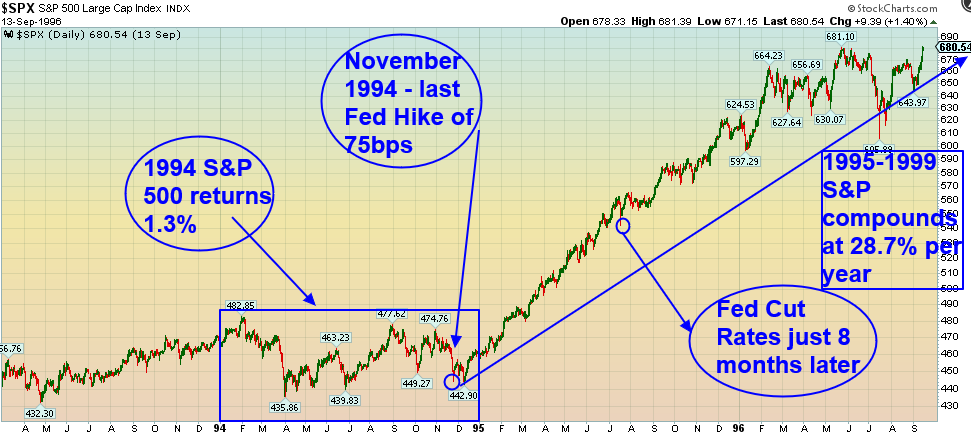
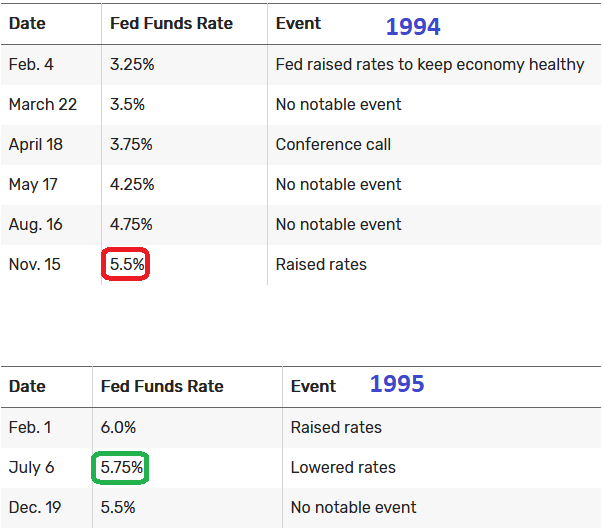
–First time since 1994. Was a success. They raised 75bps in November 1994. NOTE THE S&P BOTTOMED a MONTH LATER. S&P finally ended up 1.3% for 1994 after trading down much of the year.

–By July of 1995 (8mo. later) they started lowering again. Next 5 years S&P was up on average 28.7% per year. Soft Landing/Avoided Recession. Unclear if they can pull it off this time considering yield curve inversion signaling shallow recession.
-While Europe and the US are TIGHTENING (trying to SLOW consumption), there are 2 large economies in the world that are aggressively EASING (trying to INCREASE consumption): China & Japan.
-3 ways to play the aggressive stimulus and easing as China comes out of lockdown:
1) NKE – The biggest overhang on Nike’s stock has been China. China is Nike’s most profitable market with ~20% of global revenues. Expected to grow earnings 22.6% next year.
2) TSM – 50% of global auto-chip market. Production up 60% yoy. Unlimited demand/backlog orders from new car OEMs. Expected to avg 20% EPS growth/yr next 5 years. Trading at 13.7x next year’s earnings.
3) BABA – bumpy ride but now up ~42% off the March lows as Tech Crackdown winds down and stimulus ramps up. Expected to grow earnings by 20% next year. Possible ANT Fin’l IPO coming owns 1/3.
While US just marked a bear market close yesterday, China now appears to be coming out of a pronounced Bear Market that began 16 months ago.
Recession
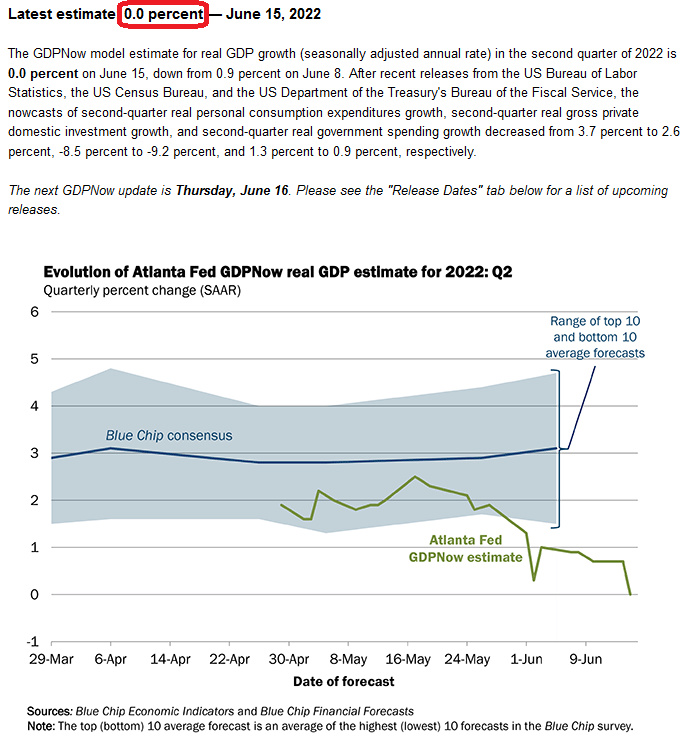
The yield curve (2/10 spread) already inverted and we had negative GDP in Q1. The definition of a recession is 2 consecutive quarters of negative GDP growth. Here’s the latest estimate from the Atlanta Fed for Q2 GDP:
 Here’s a question: What if we already HAD the recession and Q2 comes in negative? How much do you think is already priced in considering the US indices already marked a bear market on Monday (down 20% on closing basis)? We think most (if not all) of a mild recession has already been priced in. The market always bottoms BEFORE the data begins to improve. By the time they announce a recession, the market bottom will already be in the rear-view mirror. That announcement could come as early as next month if we see negative Q2 GDP – or as late as mid-2023 if we don’t – but our base case is it will have been/will be shallow.
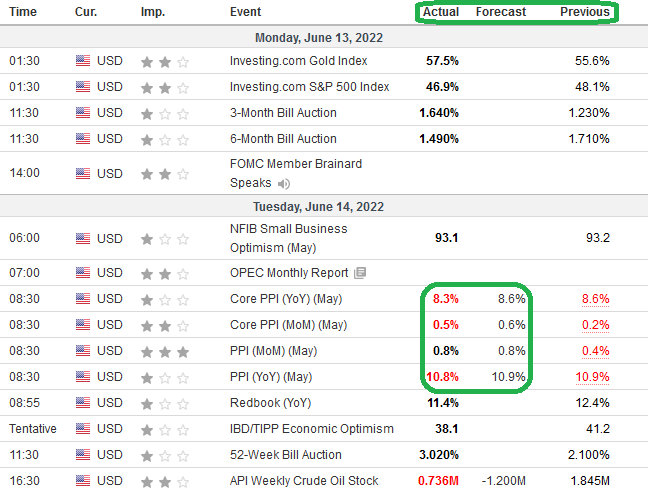
We covered – in the last week – the idea of “Peak Inflation.” While Friday’s CPI report was a train wreck, Tuesday’s PPI report (wholesale prices) told a better story (and is a LEADING indicator):
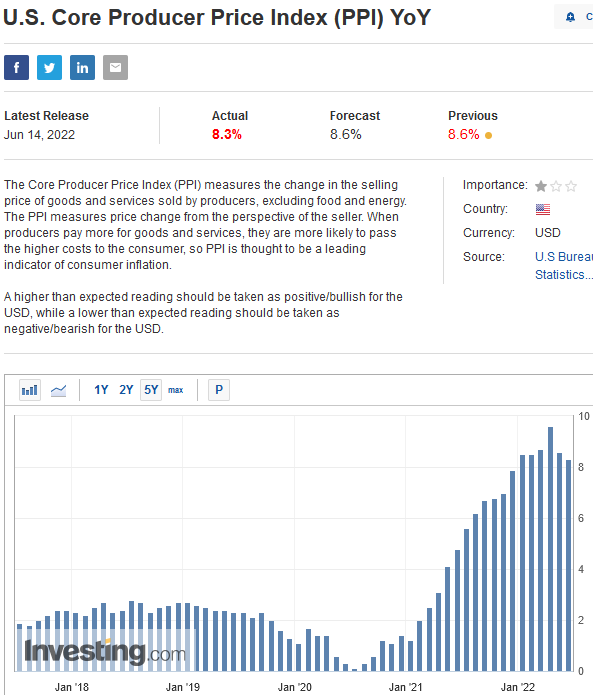
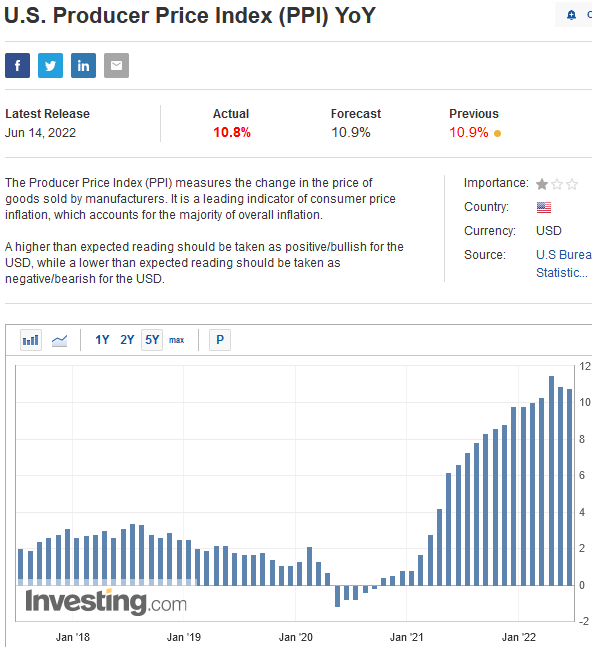
This is consistent with a view we expressed in recently on our podcast|videocast that we could be peaking (as it relates to inflation) based on these LEADING indicators:
Source: (Bloomberg)
We discussed the possibility of a better than expected PPI print in 2 interviews on Monday – before the data was released (much better than my CPI expectation!). Thanks to Ryan Gallagher and Phillip Yin for having me on CGTN America on Monday night to discuss:
Watch in HD directly on CGTN America
1) How has inflation impacted the average person? What impact does it have on savings?
-CPI up 8.6% yoy in May. Fastest pace since December 1981.
-Energy up 34.6% yoy. West has decided to finance the defense of Ukraine with higher prices at the gas pump.
-Groceries up 11.9%.
-Airline fares surged 37.8% yoy.
-Hotel prices were 19.3% higher.
-Restaurant prices rose 7.4%.
-Used cars up 60% since 2020. May soon find relied as chip shortage abating.
-Cash erodes by 8% per year. Fixed income yields are below inflation. Only game is real assets and equities that can pass on costs to consumers.
2) Is inflation expected to get worse?
• ABOUT A THIRD OF US INFLATION IS AS A RESULT OF NEW AND USED CARS, ALL DUE TO THE SHORTAGE OF SEMICONDUCTORS.
• MS (Adam Jonas) Note: 1) the long-lasting global auto chip shortage is edging closer to resolution. 2) TSM (which accounts for ~50% of global auto MCU production) has seen significant improvements through 1Q with wafer foundry auto semi output up approximately 60% YoY.
• This should result in lower used vehicle prices since “Used vehicle prices are still up over 60% vs. 2 years ago and only 6% off of all time high. Recovering new car supply/inventory can be a release valve for unprecedented new and used car price inflation.”
OIL (will take time, BUT…):
• Oil is in BACKWARDATION: Cash $120.67, Dec ’23 $92.89, Dec ’24 $83
• Rig Count 733 vs. 244 pandemic low (792 pre-pandemic). Production coming back.
• Many Commodities Softening: Wheat, Live Cattle, Cocoa, Lumber, Copper, Soybean Meal, Gold, Palladium prices dropping in recent weeks and mos.
• $20-$30/bbl war premium goes away with any resolution.
Other Inflation Factors:
• Biden Admin may drop tariffs on China Imports.
• Backlog in cargo ships waiting to unload in Los Angeles and Long Beach, Calif., fell for the fourth straight month in May
• Avg. hourly earnings came in lower than expected (Jobs Report).
• Discounting on (categories) inventory build from companies like Target will be dis-inflationary.
• Retailers from WMT to Gap face a glut of inventory as shoppers skip categories that were popular during the pandemic. (Sweats and hoodies OUT, party dresses IN)
TOMORROW:
-PPI Producer Price index (may show relief – leading indicator).
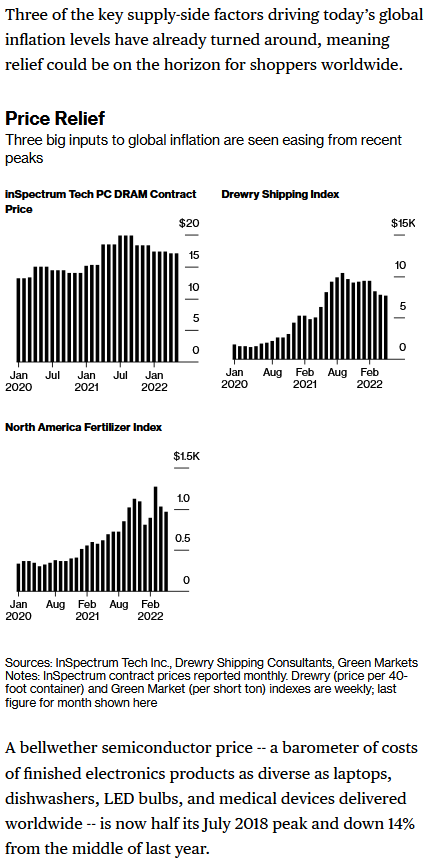
-PC DRAM Contract Price (bellwehter for semis) – down 14% from mid 2021.
-Drewry Index (spot rate for shipping containers) – down 26% since Sept 2021.
-North America’s fertilizer prices – down 24% from March (all-time high).
3) Fed meeting on Wednesday — What tools are available to address inflation? How is the federal reserve expected to address inflation?
-Either they can point to PPI and say, it’s coming down let’s be patient, OR they must re-take control of the narrative and pull forward July hikes.
-Problem is it works on a lagged basis, so by the time the consumer sees it at the store they may have over-tightened into a Recession.
-Leaks today (WSJ) that they could go 75bps instead of 50bps on Wednesday. They should simply pull forward July and see how it goes.
4) Is there any legitimacy to fears of a possible recession?
-Yes. The yield curve has inverted (2/10 spread). We expect a SHALLOW recession next year (or sooner).
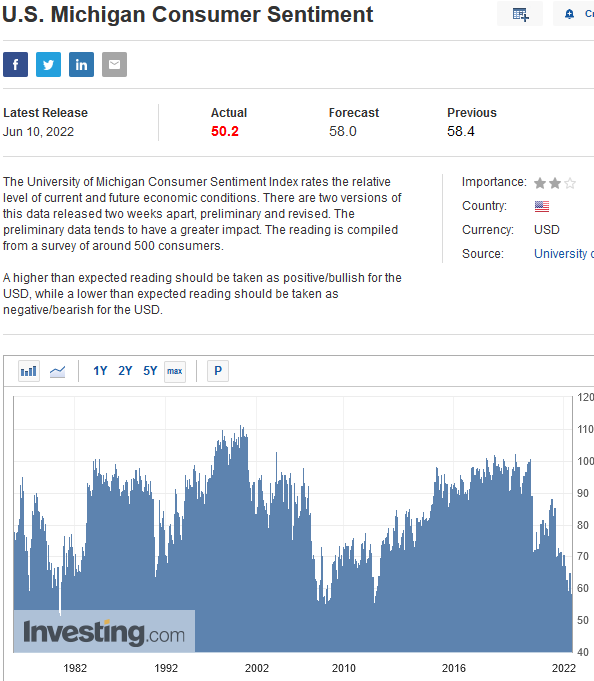
-Consumer Sentiment lower than 2008-2009 GFC. Overdone.
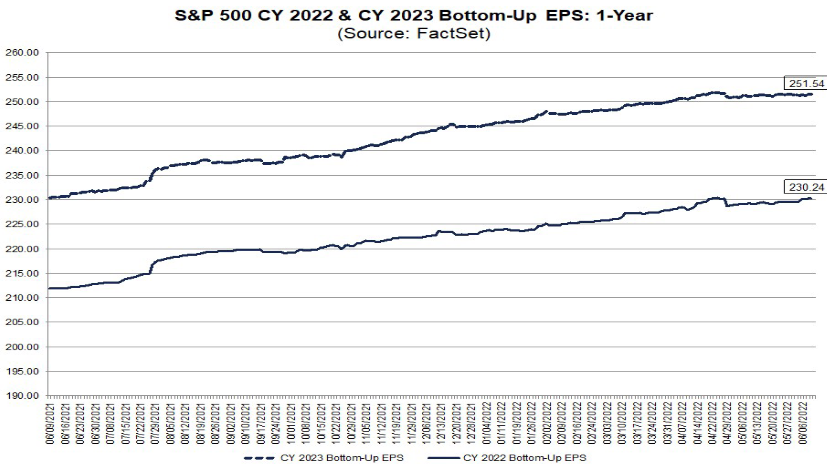
-Despite pessimism, Earnings Estimates still going UP. $251 for 2023. 15x next years earnings compared to 5 year average of 18.6x.
Money Mitch
Watch in HD directly on Benzinga
On Mitch Hoch’s Benzinga show, we just go with the flow! We talked hockey, energy, Russia, inflation, CPI, PPI, opportunities, sentiment, multiples, positioning and more. Not to be missed! Thanks to Mitch and Zoltan Suranyi for having me on.
Sentiment STILL Washed Out
On Tuesday, Bank of America put out its monthly “Fund Manager Survey” which surveys ~300 managers with ~$750B AUM. Here is my full summary:
June 2022 Bank of America Global Fund Manager Survey Results (Summary)
The three key points I want to focus on are:
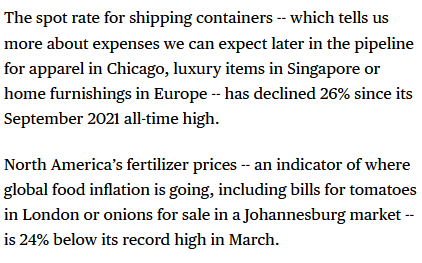
1) Managers expect inflation to fall. Historically they have been correct: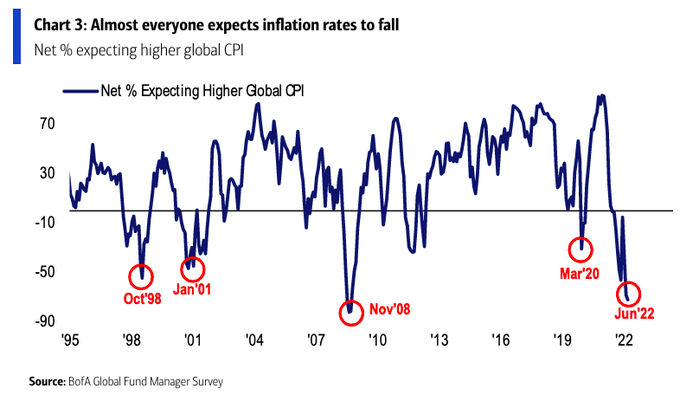 2) Optimism on Global Growth has only been this low at/near market bottoms:
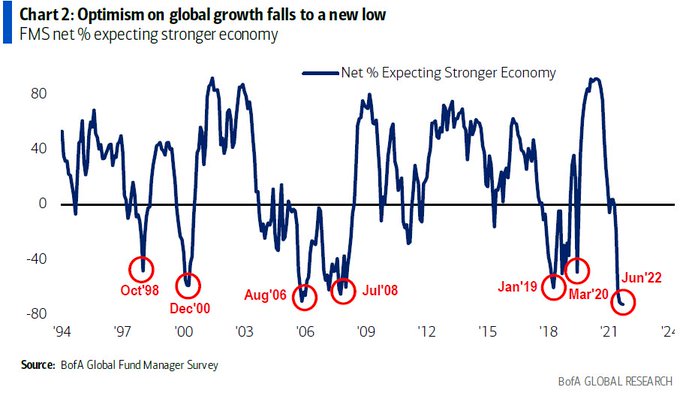
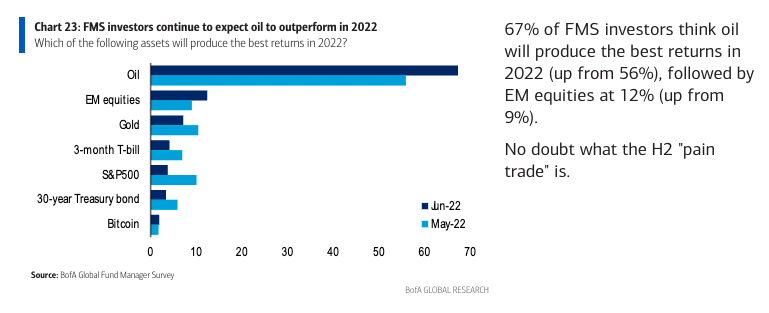
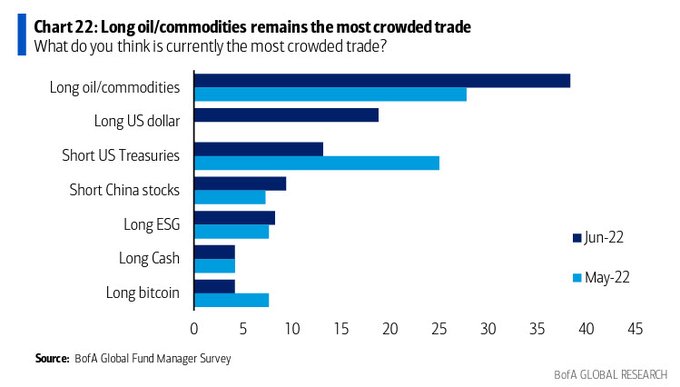
3) Everyone thinks Oil will continue to outperform. While managers “say” inflation will come down, they continue to chase energy. This sets it up to be the “pain trade” of 2H:
Hmm…
While pessimism continues to climb to a new all time high – SO DO EARNINGS! One of the two will have to come down soon. My bet is that pessimism will come down more than earnings:
Now onto the shorter term view for the General Market:
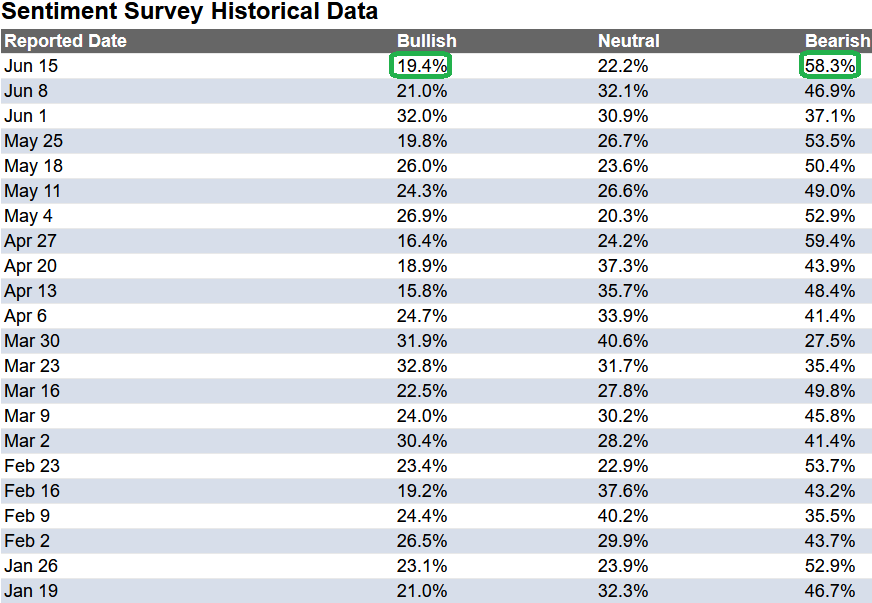
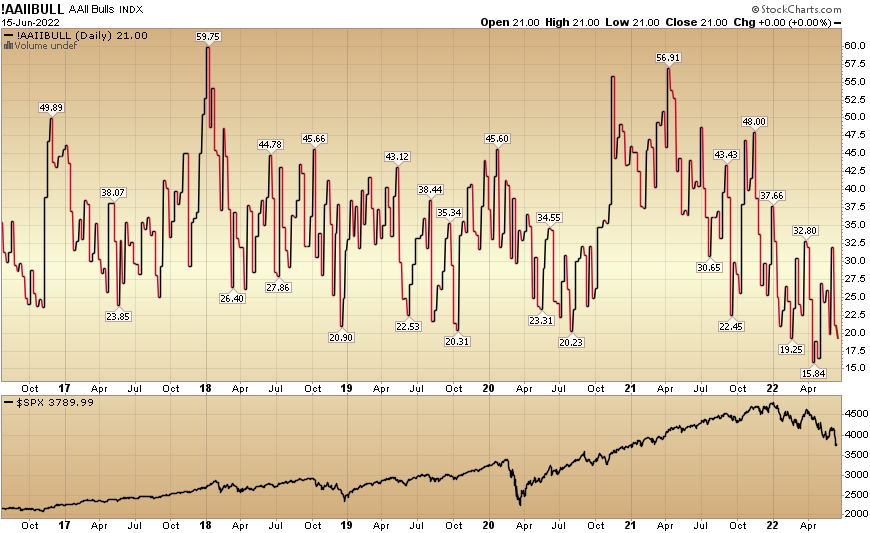
In this week’s AAII Sentiment Survey result, Bullish Percent (Video Explanation) ticked down to 19.4% this week from 21% last week. Bearish Percent jumped to 58.3% from 46.9%. Retail investors are extremely fearful once again.
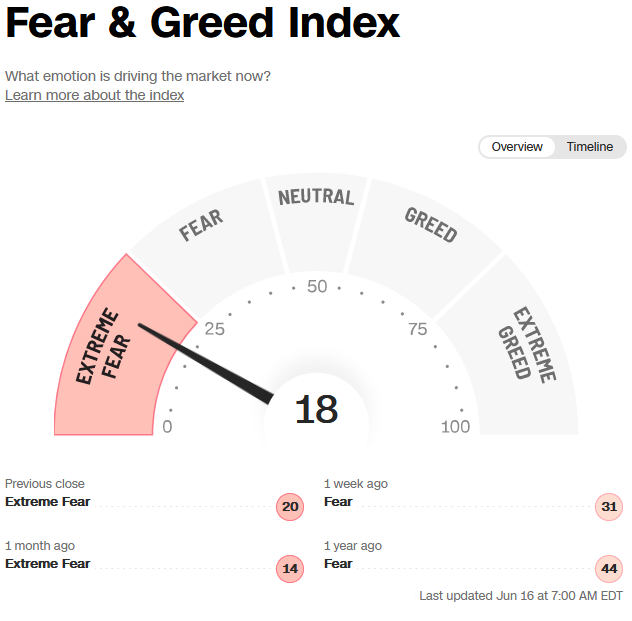
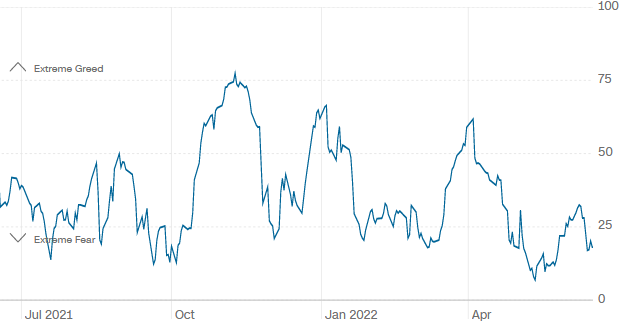
The CNN “Fear and Greed” dropped from 36 last week to 18 this week. This shows extreme fear. You can learn how this indicator is calculated and how it works here: (Video Explanation)
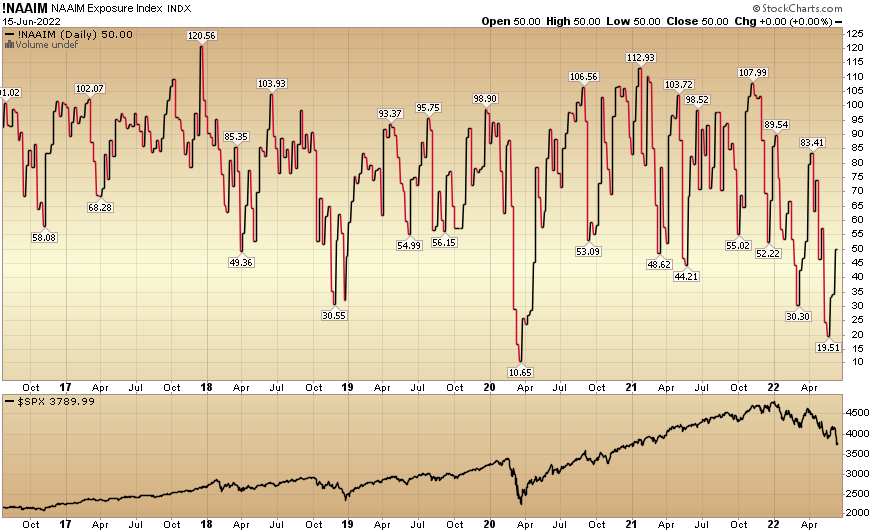
And finally, the NAAIM (National Association of Active Investment Managers Index) (Video Explanation) rose to 50% this week from 34.33% equity exposure last week.
Our podcast|videocast will be out this afternoon. I will be providing an update on our auto-supplier position. Each week, we have a segment called “Ask Me Anything (AMA)” where we answer questions sent in by our audience. If you have a question for this week’s episode, please send it in at the contact form here.


