

Key Market Outlook(s) and Pick(s)
On Monday, I joined Taylor Riggs, Brian Brenberg, Jackie DeAngelis, and Kennedy on Fox Business’ The Big Money Show to discuss markets, the economy, Iran, Papa John’s ($PZZA), and more. Thanks to Taylor, Brian, Jackie, Kennedy, and Anastasia Cavounis for having me on:
On Tuesday, I joined Stuart Varney and Taylor Riggs on Fox Business’ Varney & Co. to discuss markets, outlook, the economy, Iran, VF Corp ($VFC), Alibaba ($BABA), and more. Thanks to Stuart, Taylor, and Maggie Edwards for having me on:
On Monday, I joined Diane King Hall on the Schwab Network to discuss markets, the economy, outlook, Iran, VF Corp ($VFC), Disney ($DIS), and more. Thanks to Diane, Althea Thompson, and Kaitlyn Crist for having me on:
On Wednesday, I joined Ashley Mastronardi on NYSE TV to discuss markets, the economy, outlook, Iran, the consumer, and more. Thanks to Ashley and Mel Montanez for having me on:
Alibaba Update
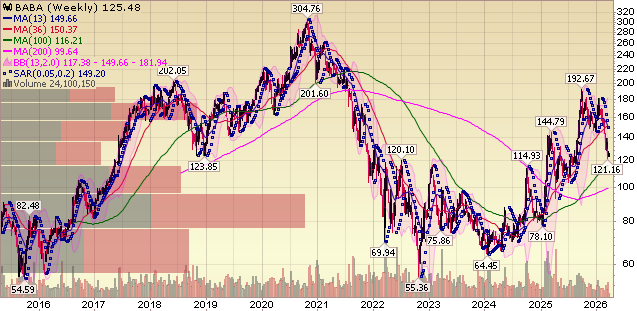
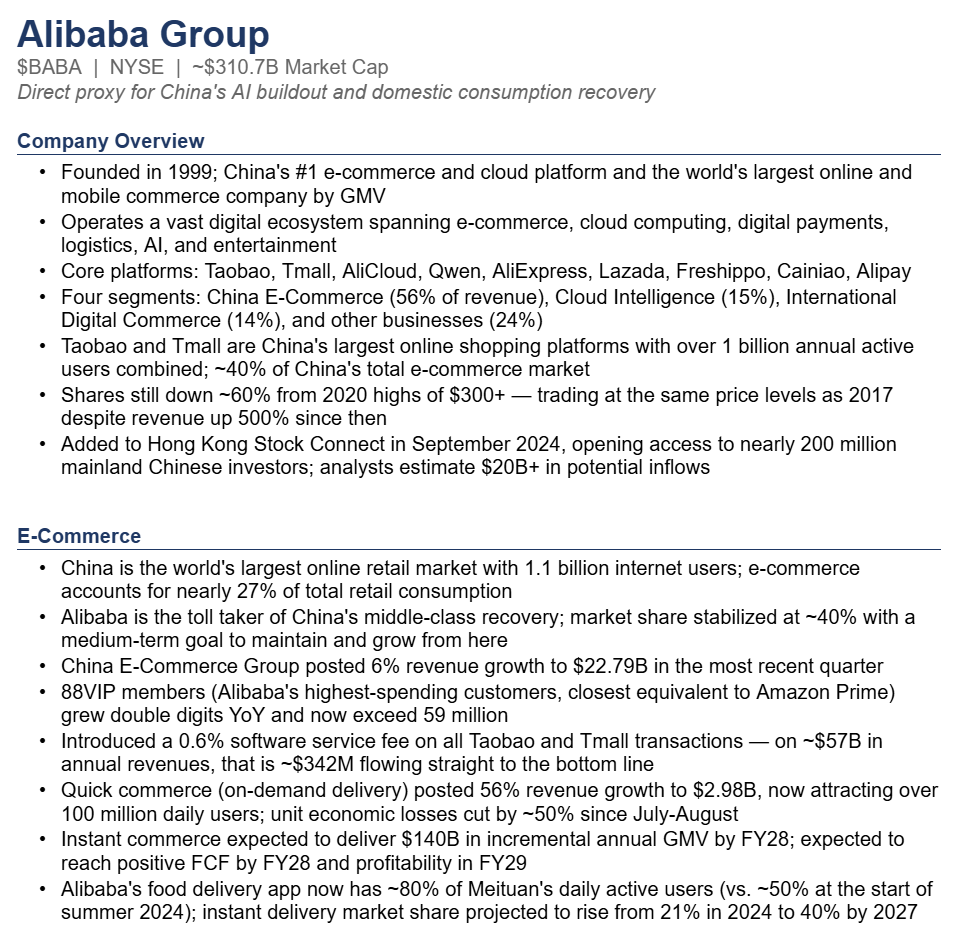
For newer readers, here’s a quick overview of the key drivers behind our thesis on Alibaba, the toll taker of the Chinese consumer recovery and the cheapest way to play AI globally:
Q3 Earnings Breakdown
10 Key Points
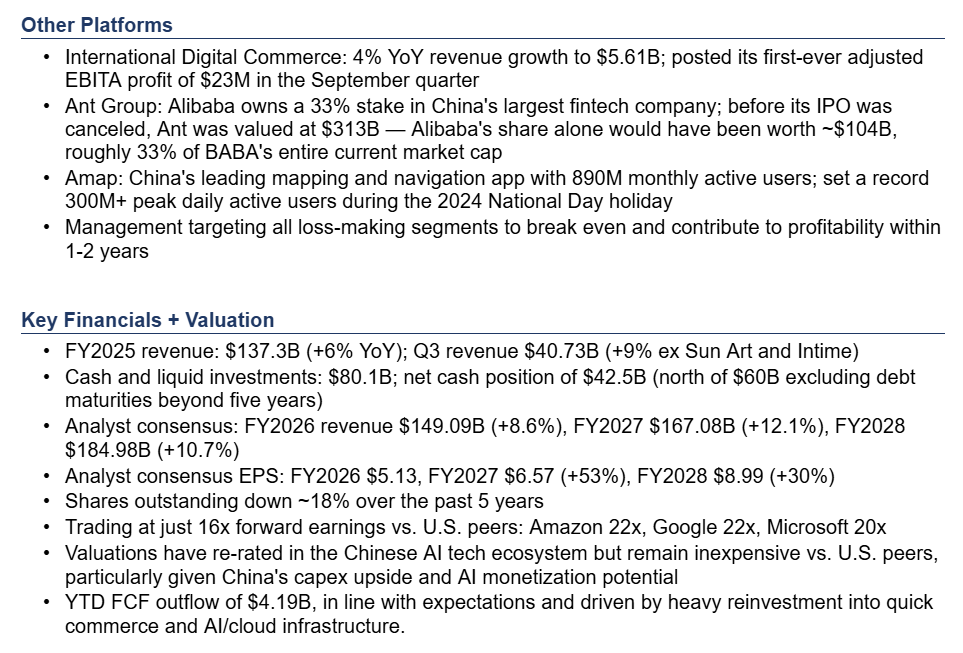
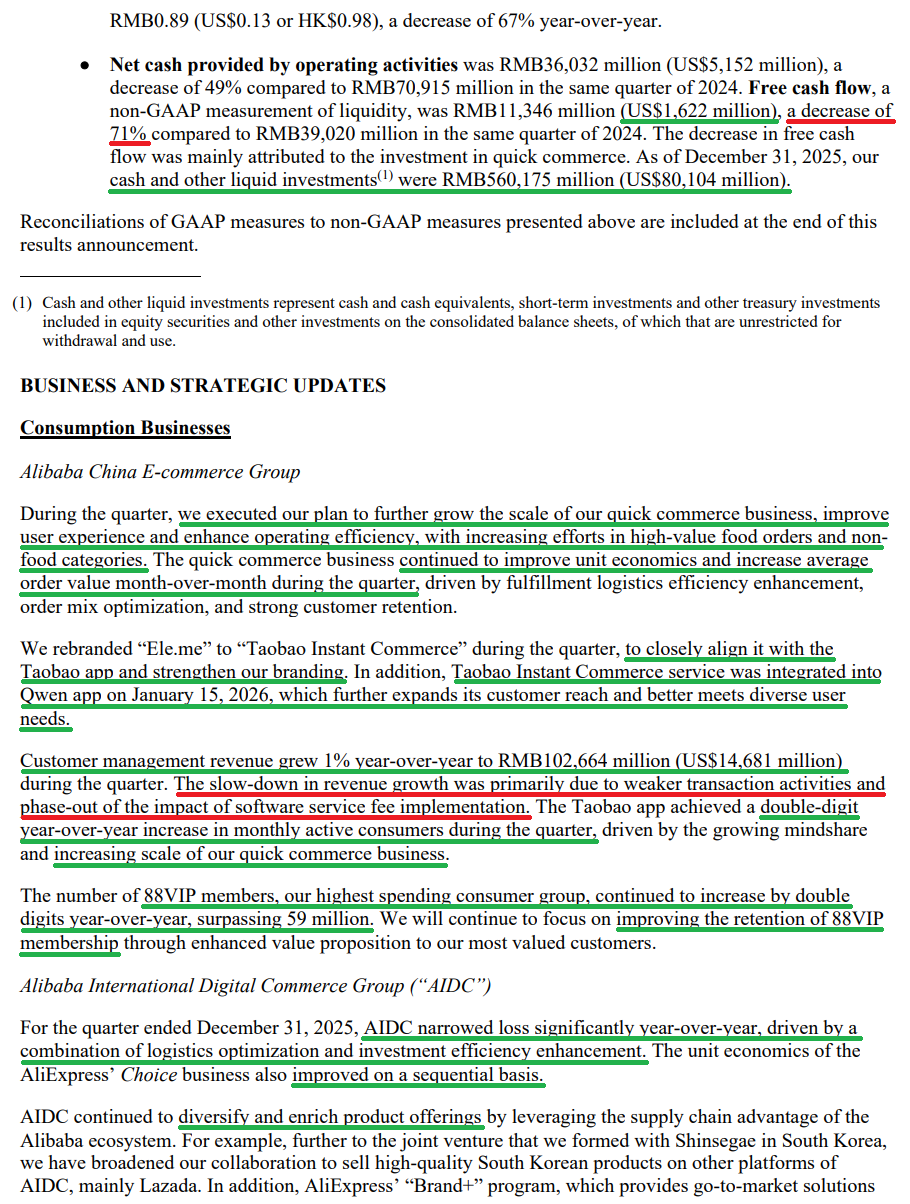
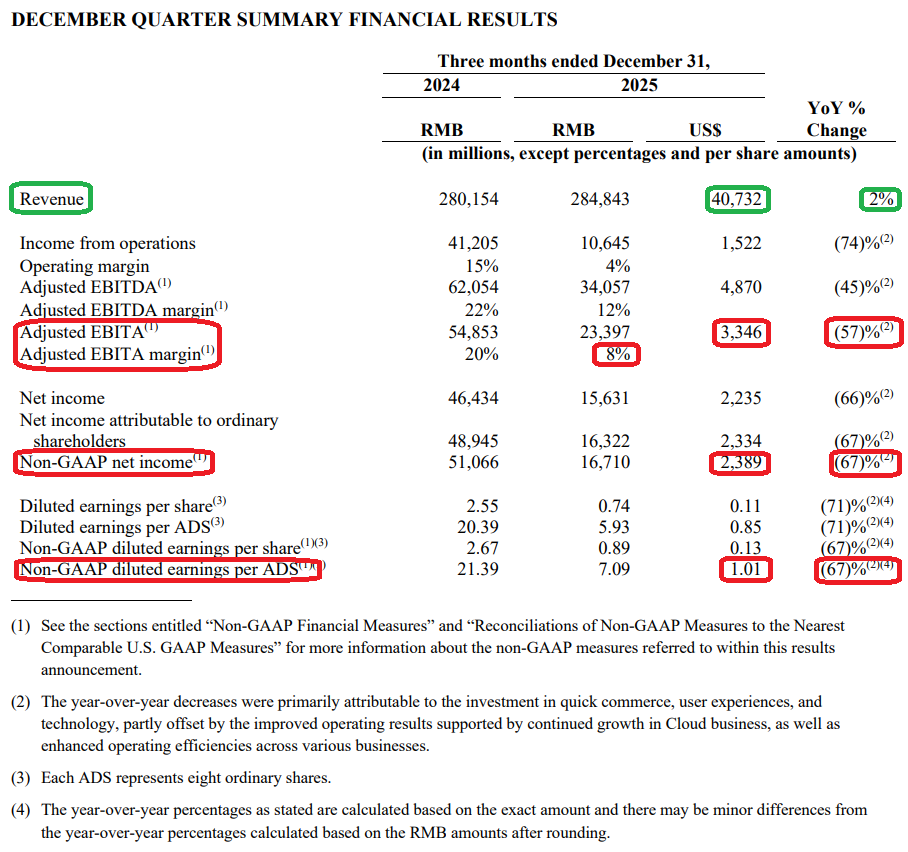
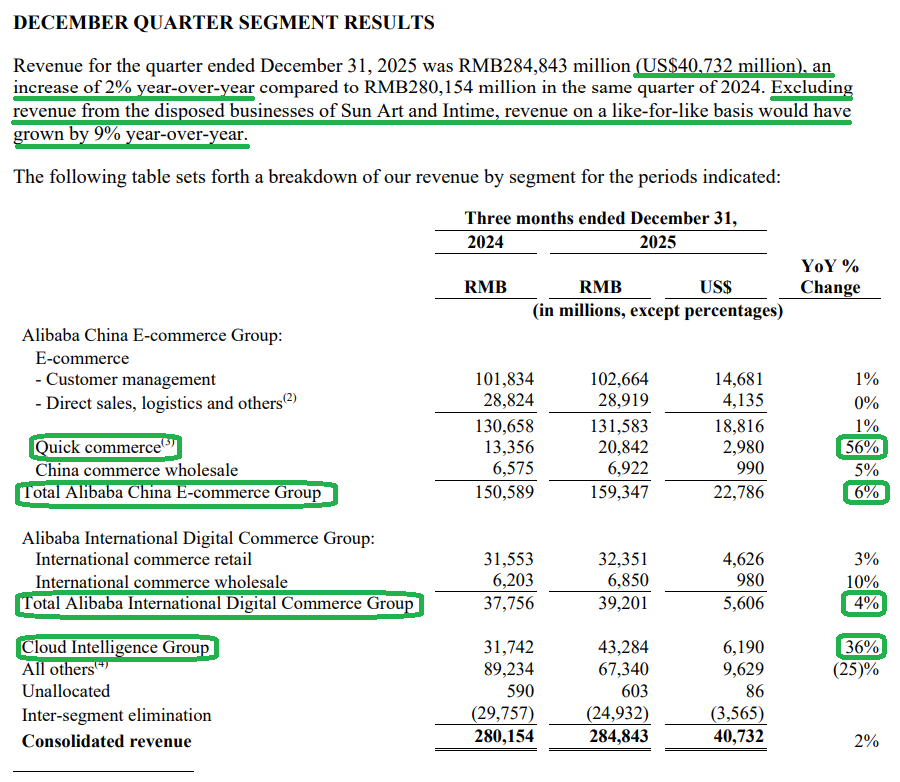
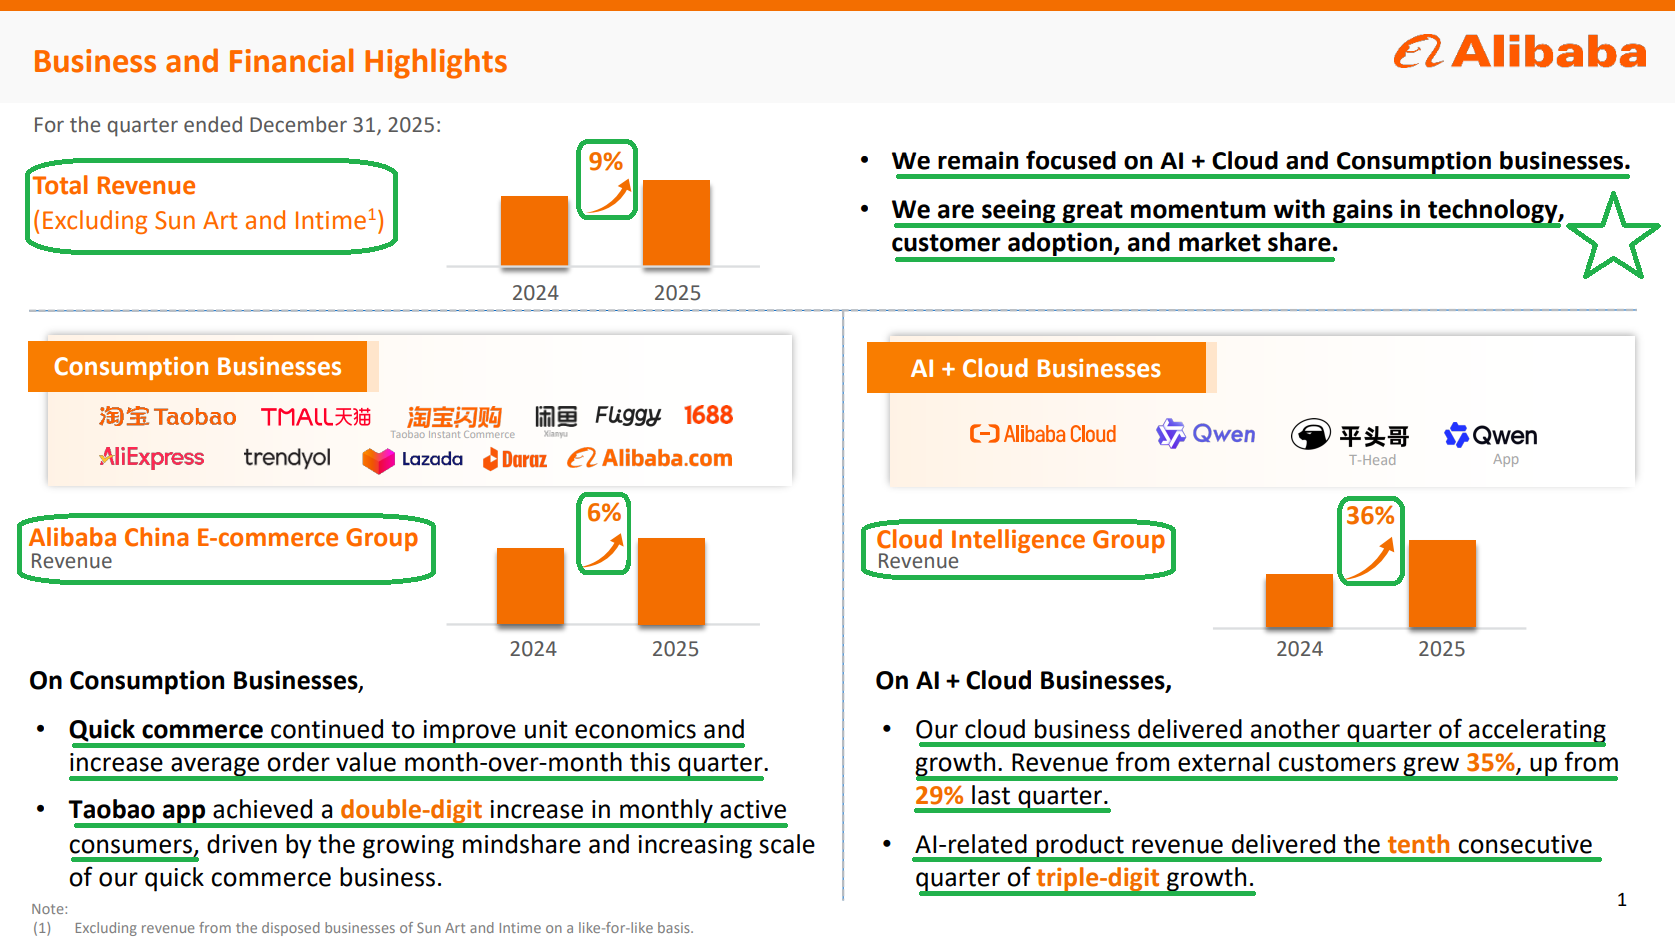
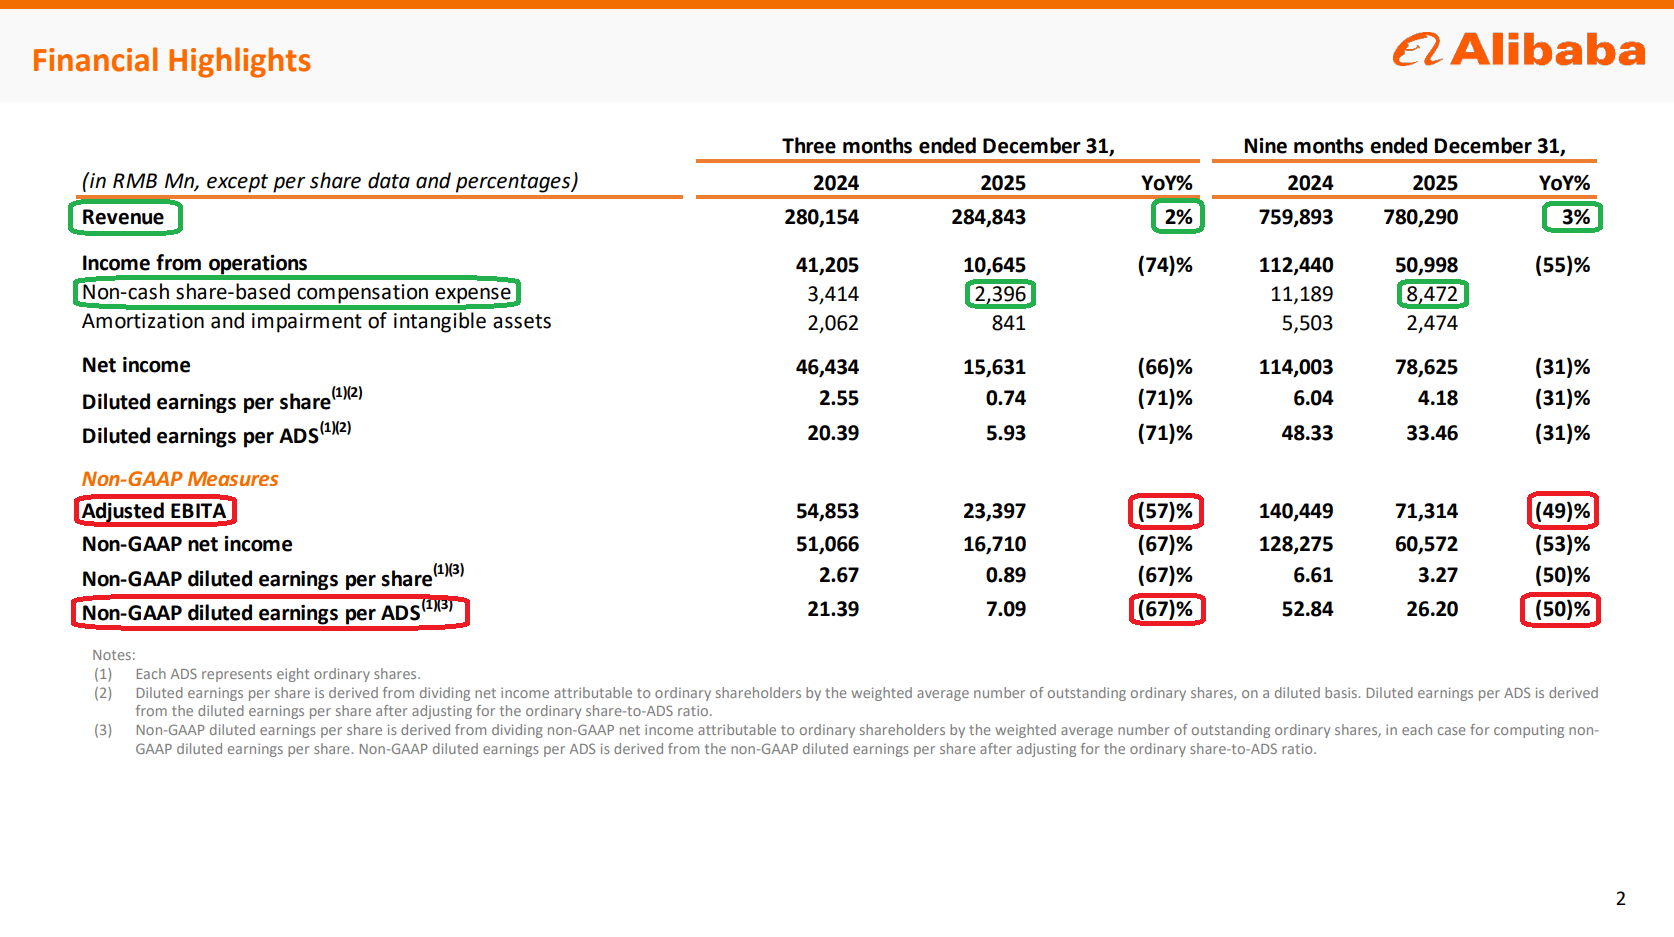
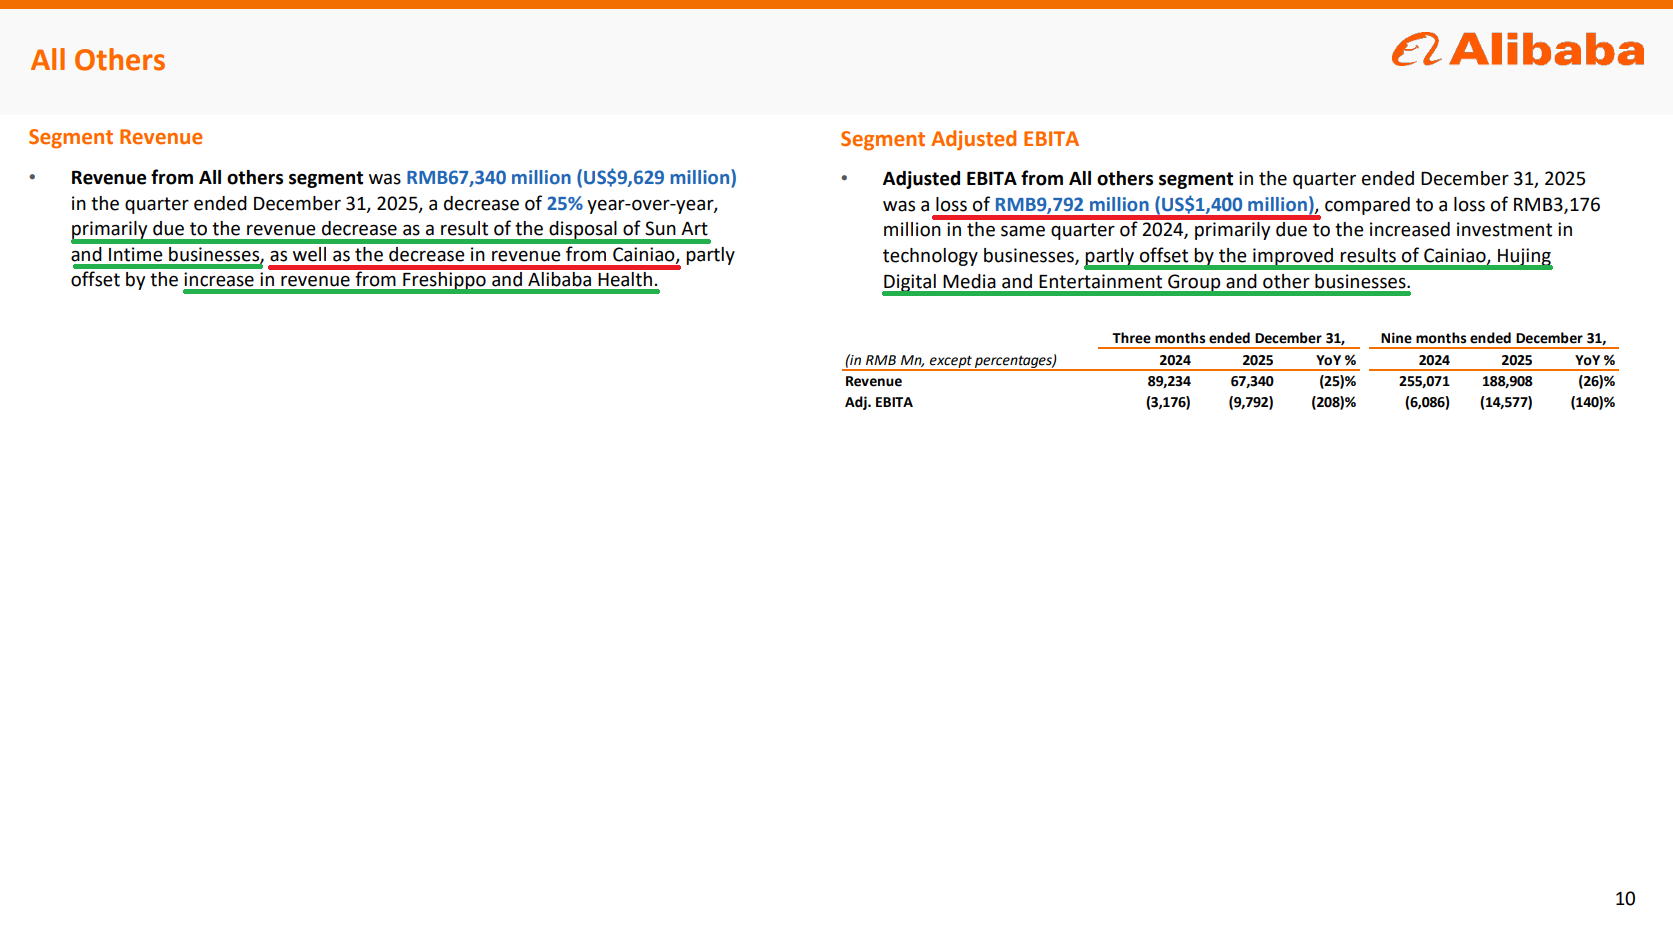
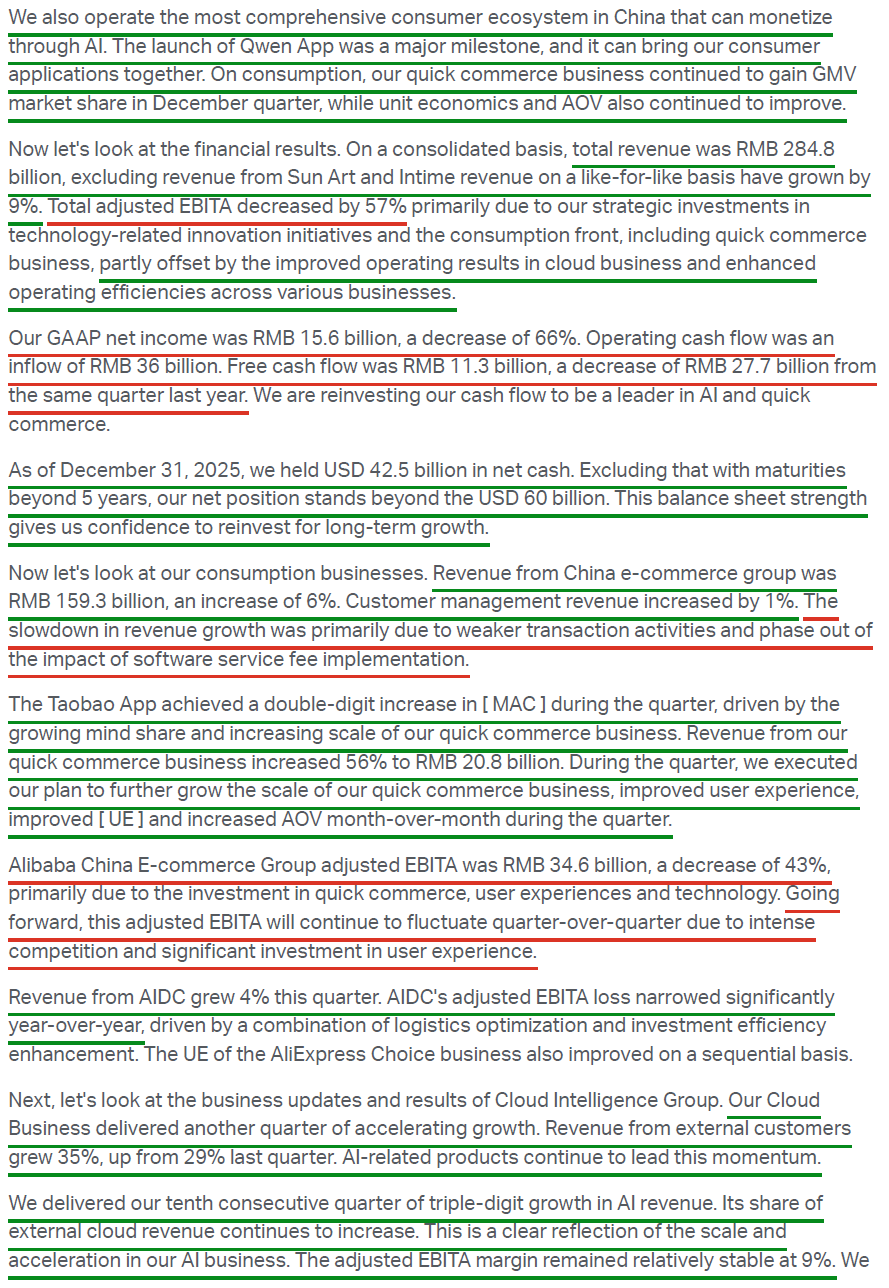
1) Revenue came in at $40.73B (+2% Y/Y reported, +9% ex-disposed businesses Sun Art and Intime), missing consensus by ~$1.42B. Adjusted EPS of $1.01 (-67% Y/Y) missed by $0.58, with the weakness driven by the intentional decision to reinvest heavily into quick commerce and AI/Cloud infrastructure. While the headline numbers may look ugly, we continue to see it as mostly noise; the underlying business on a like-for-like basis grew +9%, and the investment cycle is exactly what a long-term shareholder should want to see.
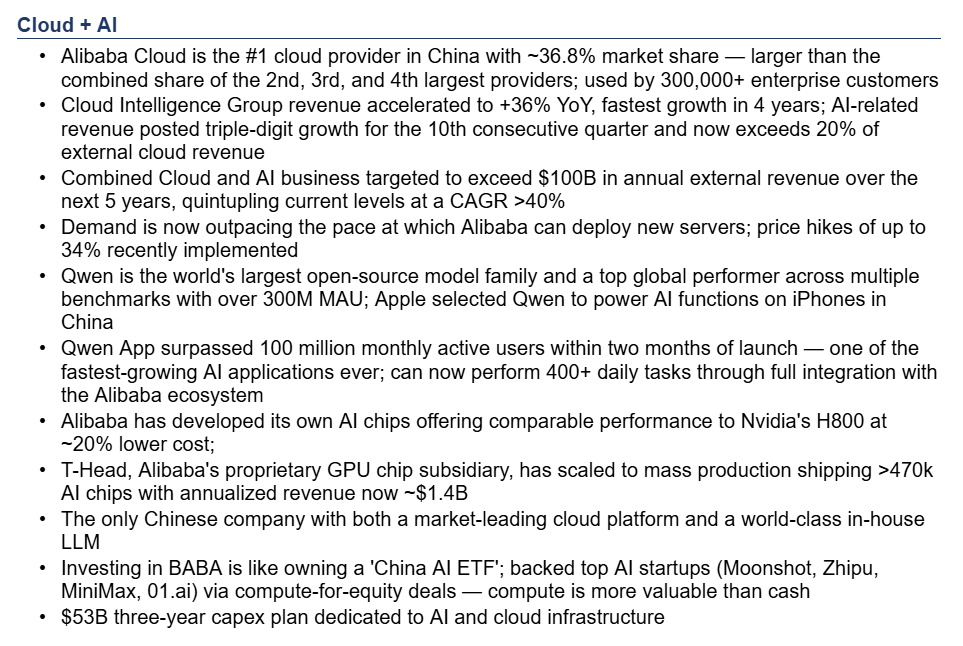
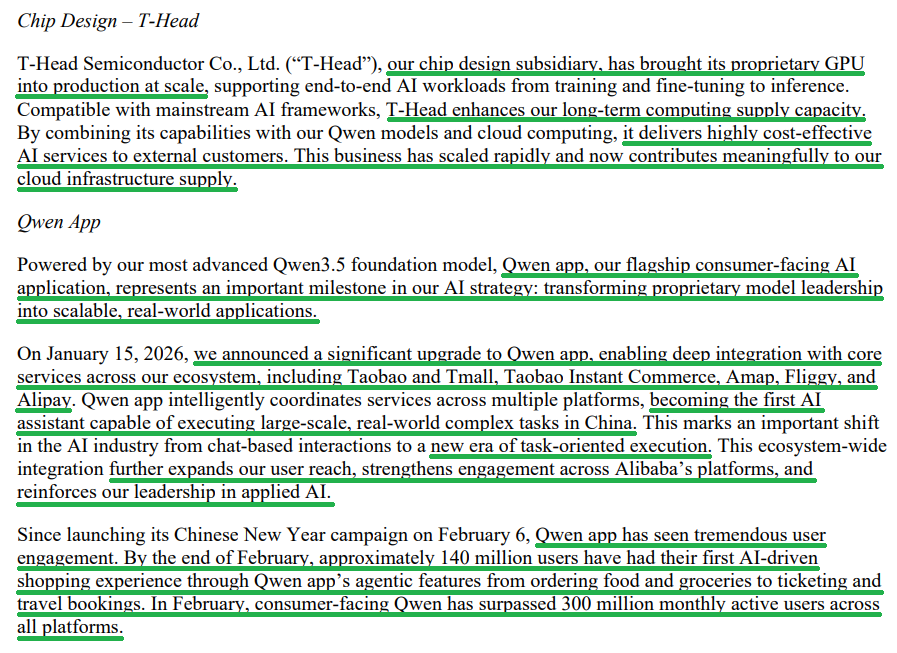
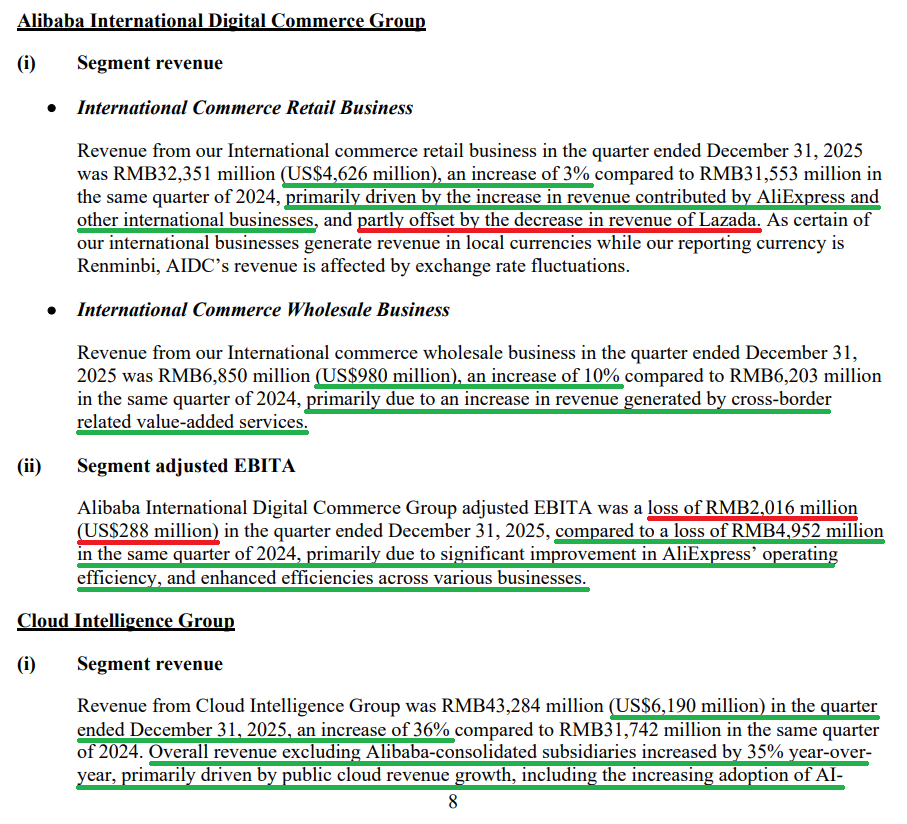
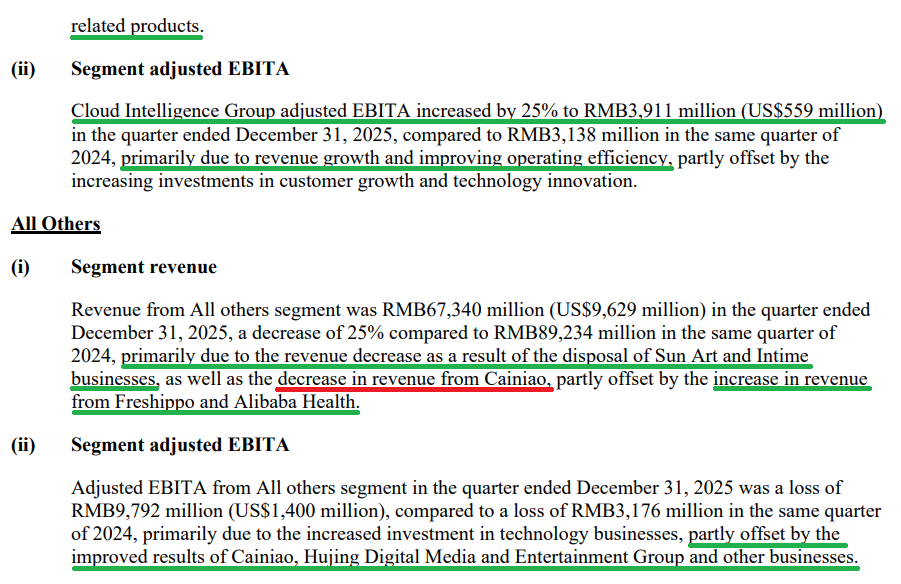
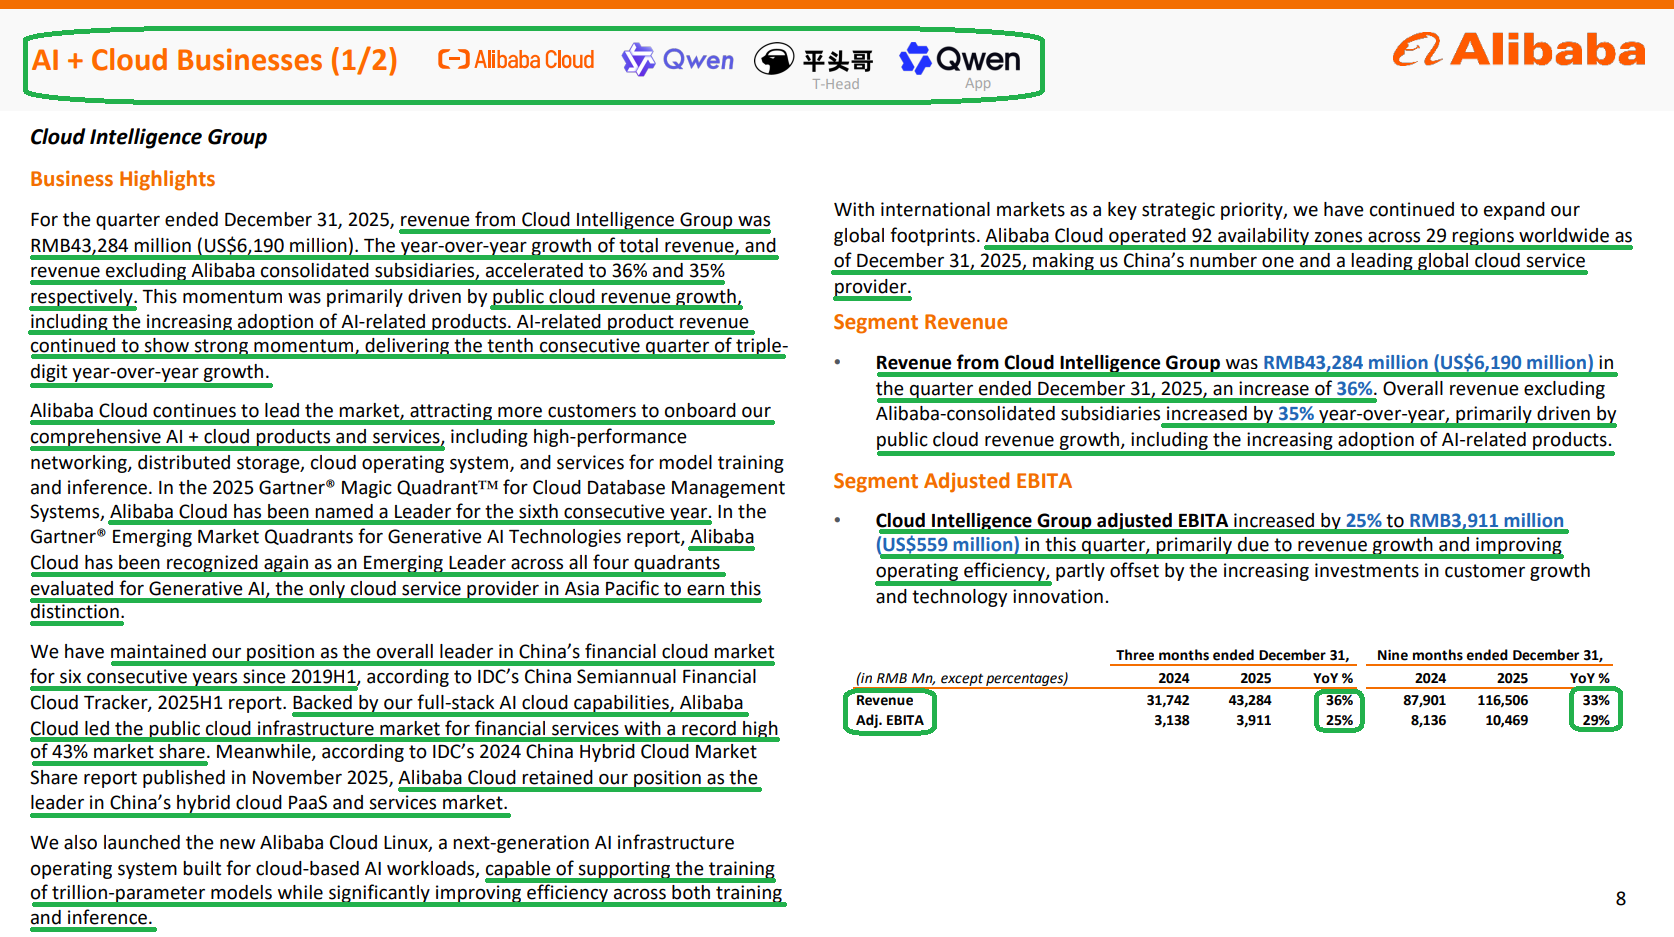
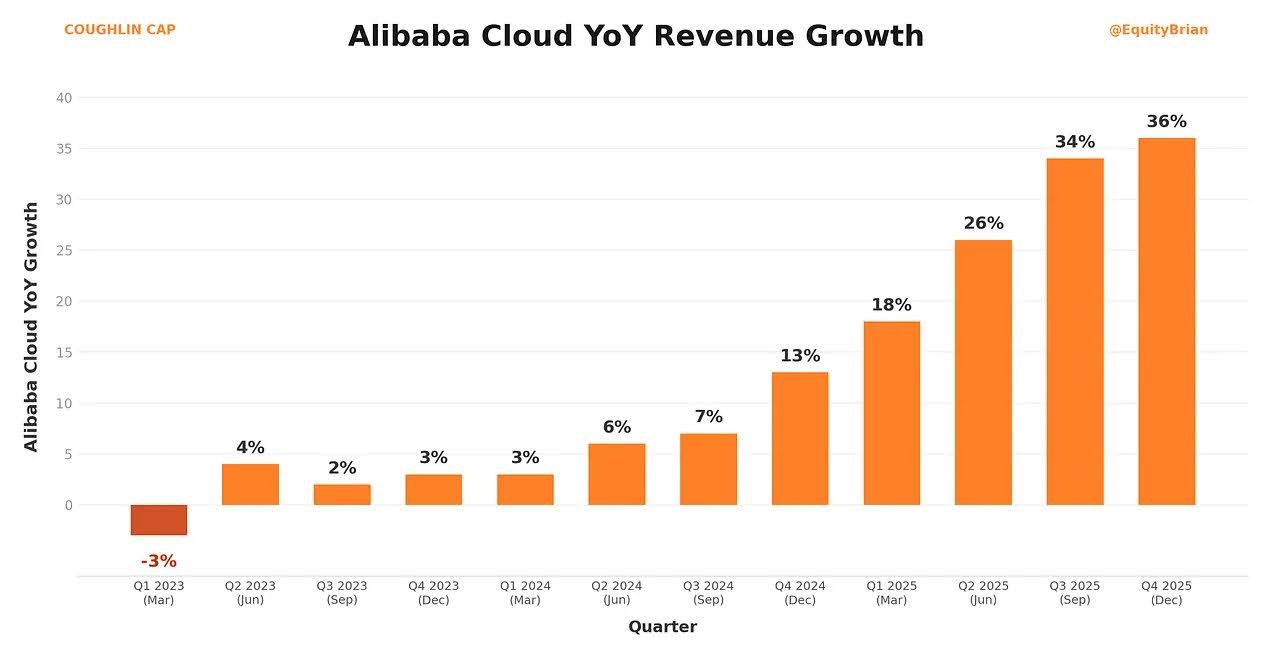
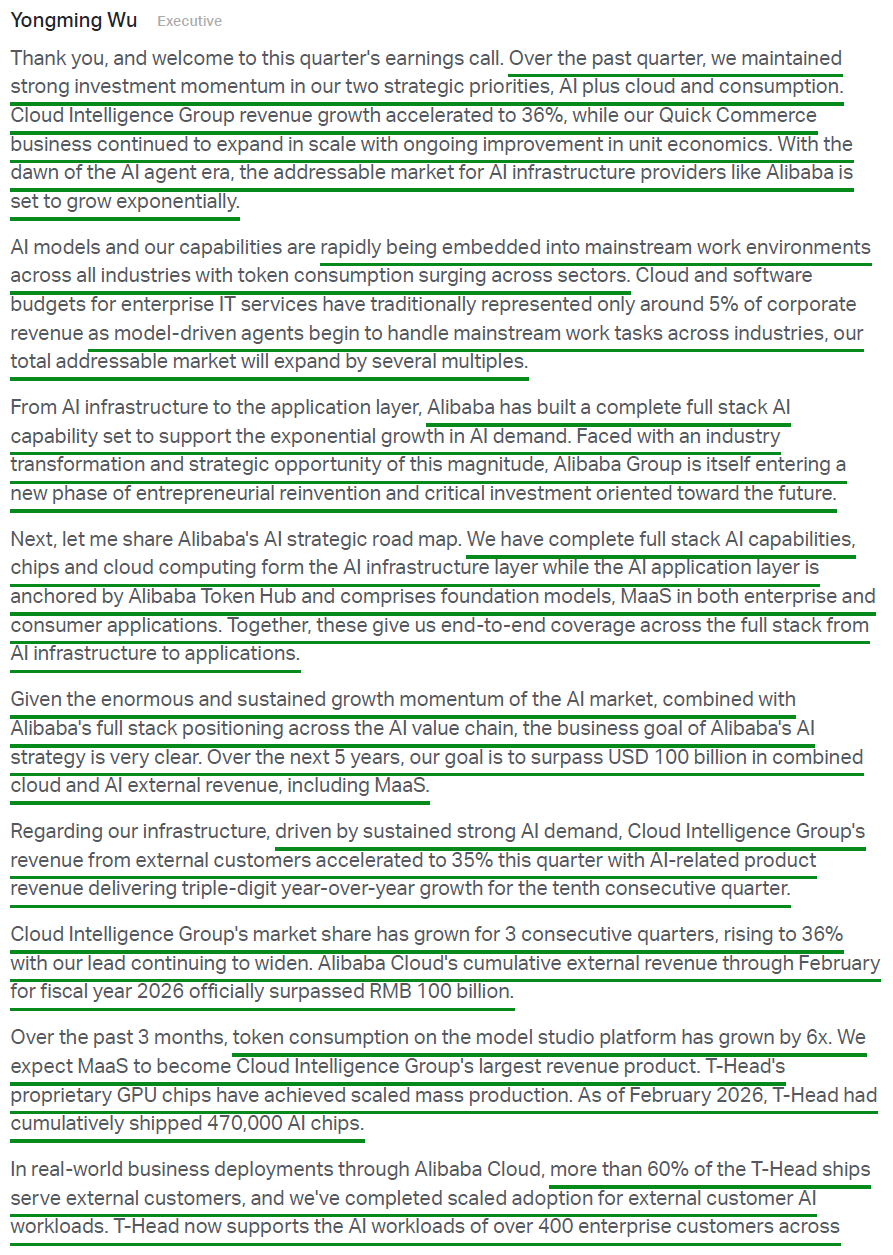
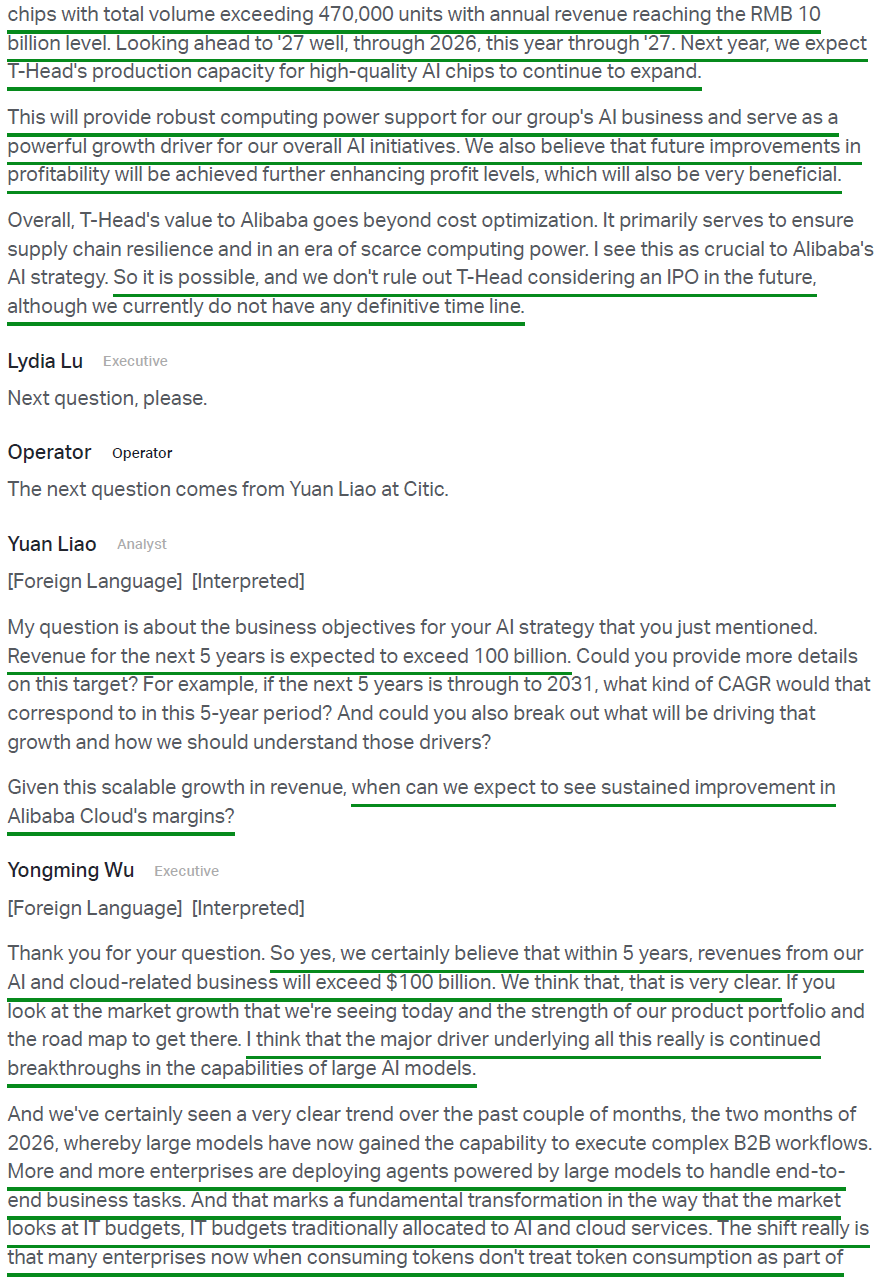
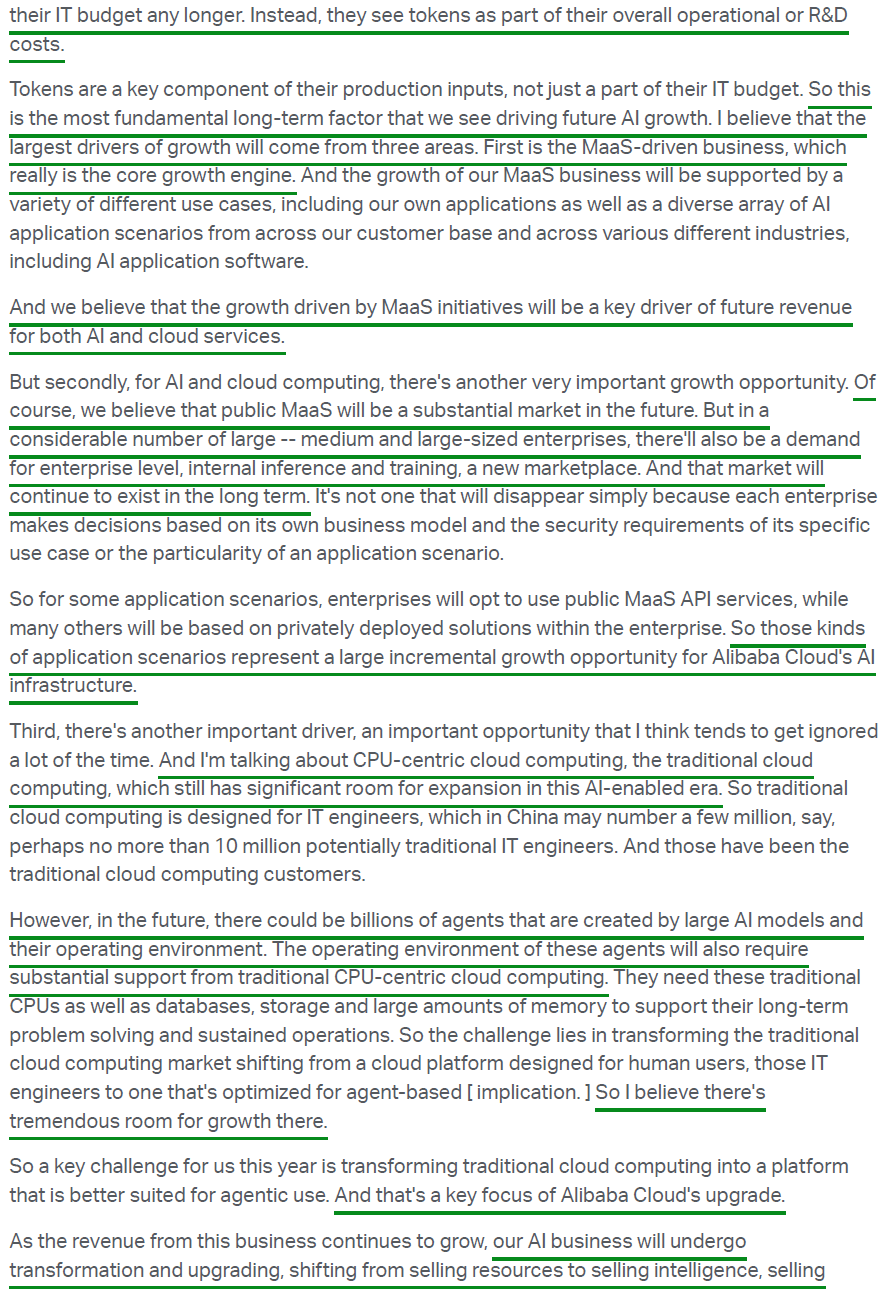
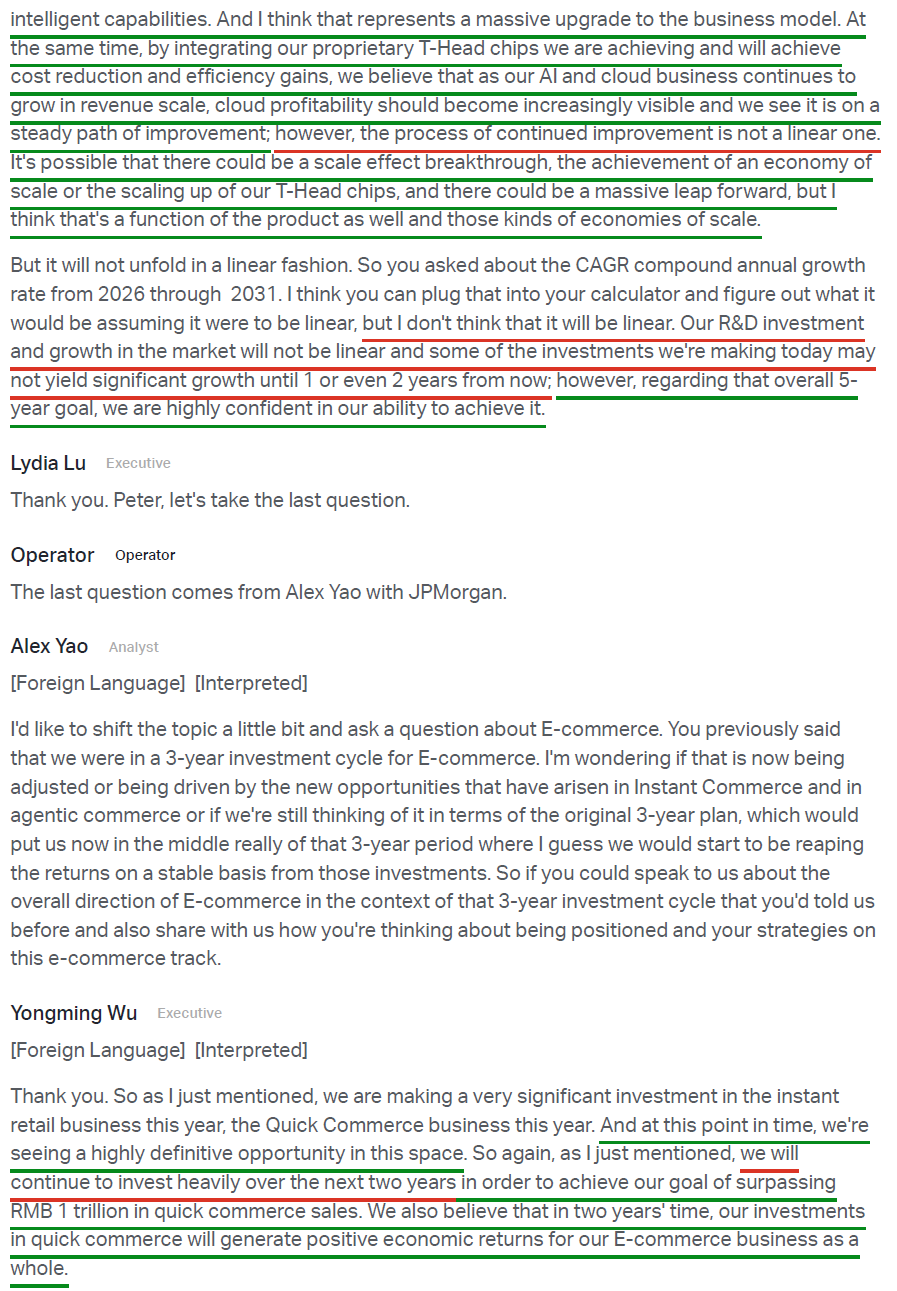
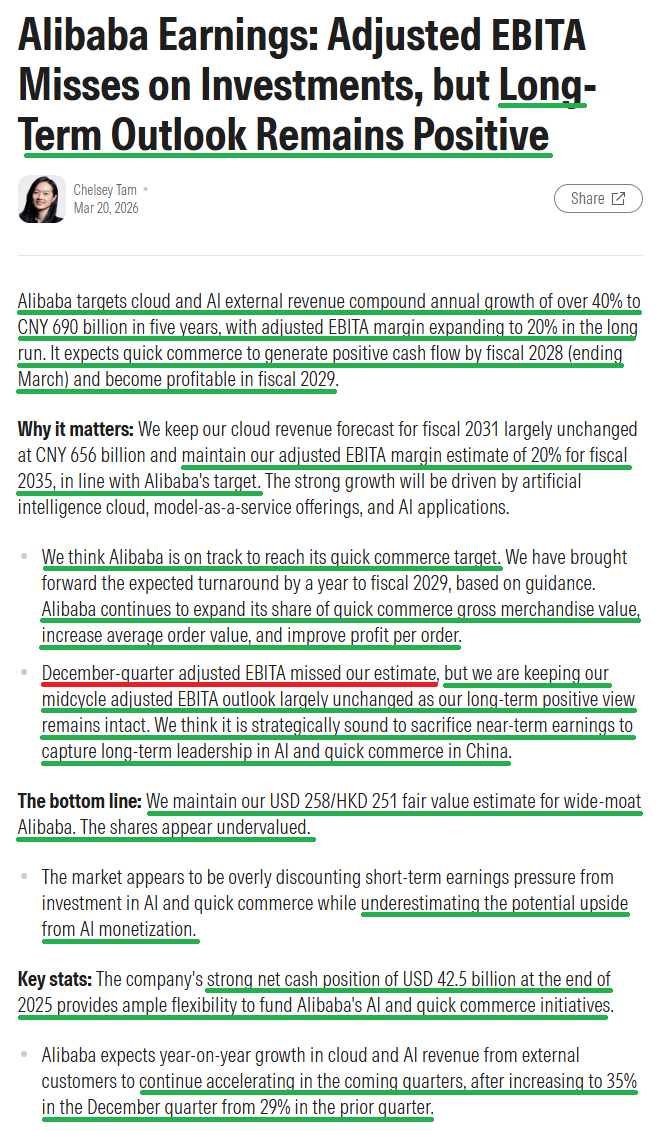
2) Cloud revenue accelerated to +36% Y/Y (a 4-year high) to $6.19B, with external customer revenue accelerating to +35% from +29% last quarter. Adjusted EBITA grew +25% to $559M with margins holding steady at ~9%, with significant expansion expected as recently implemented price hikes of up to 34% begin flowing through. Alibaba remains China’s #1 full-stack cloud provider with 36% market share, a position that has grown for three consecutive quarters with the lead continuing to widen. Management expects continued acceleration ahead, targeting the combined Cloud and AI business to surpass $100B in annual external revenue over the next five years, a quintupling of current levels implying a 40%+ CAGR.
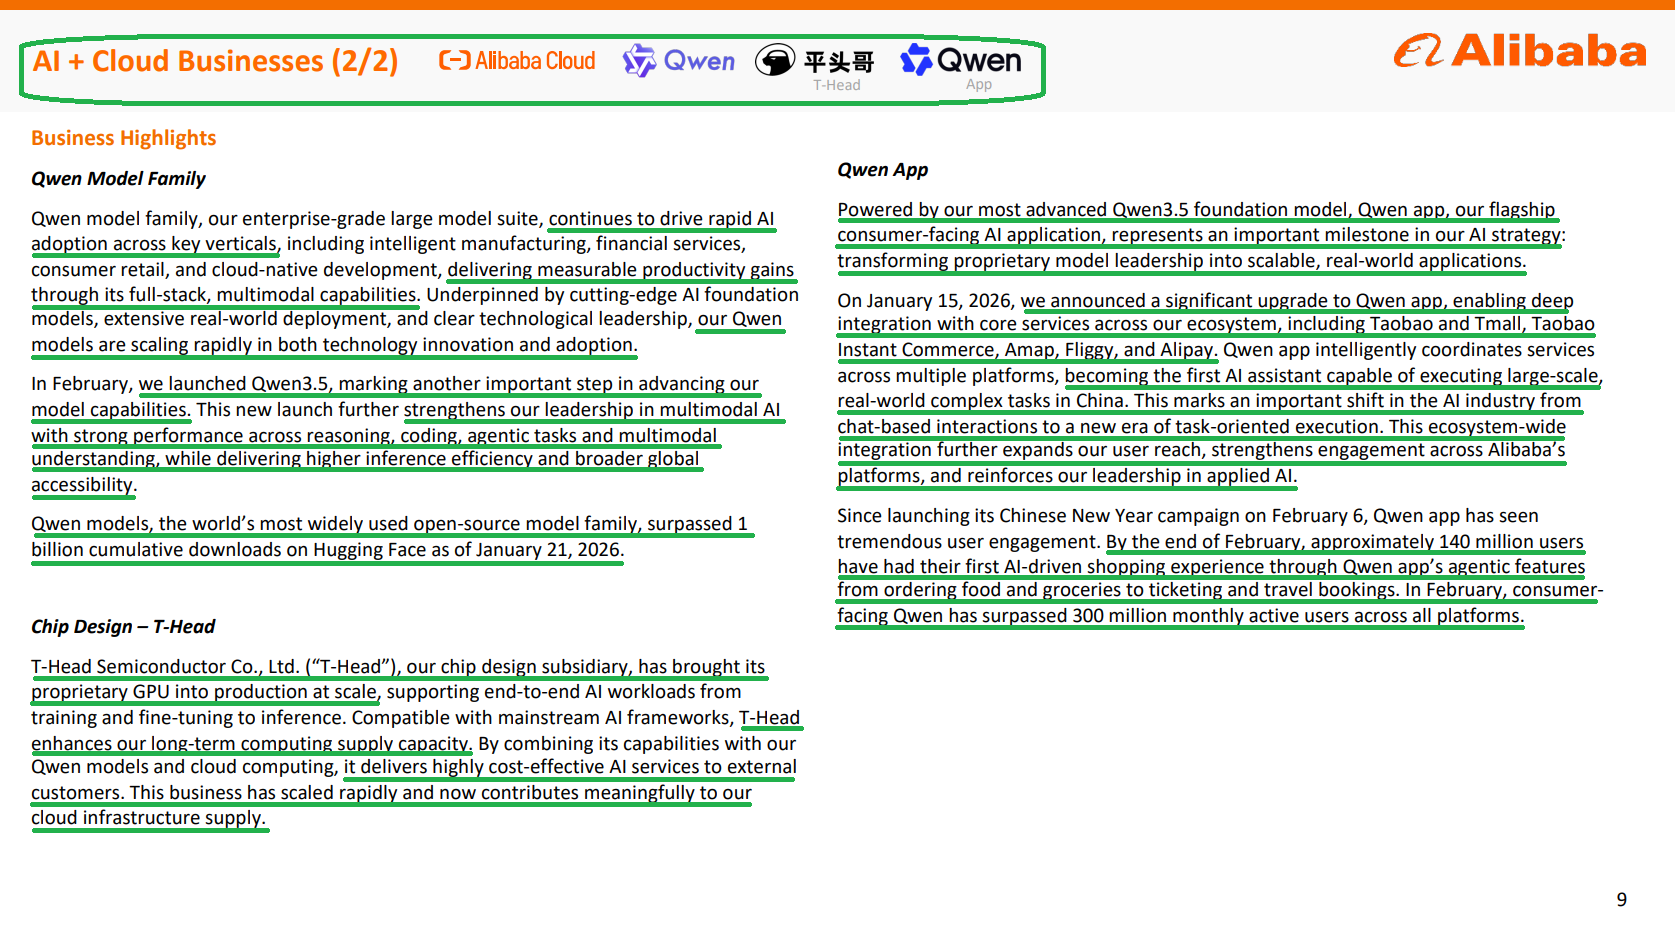
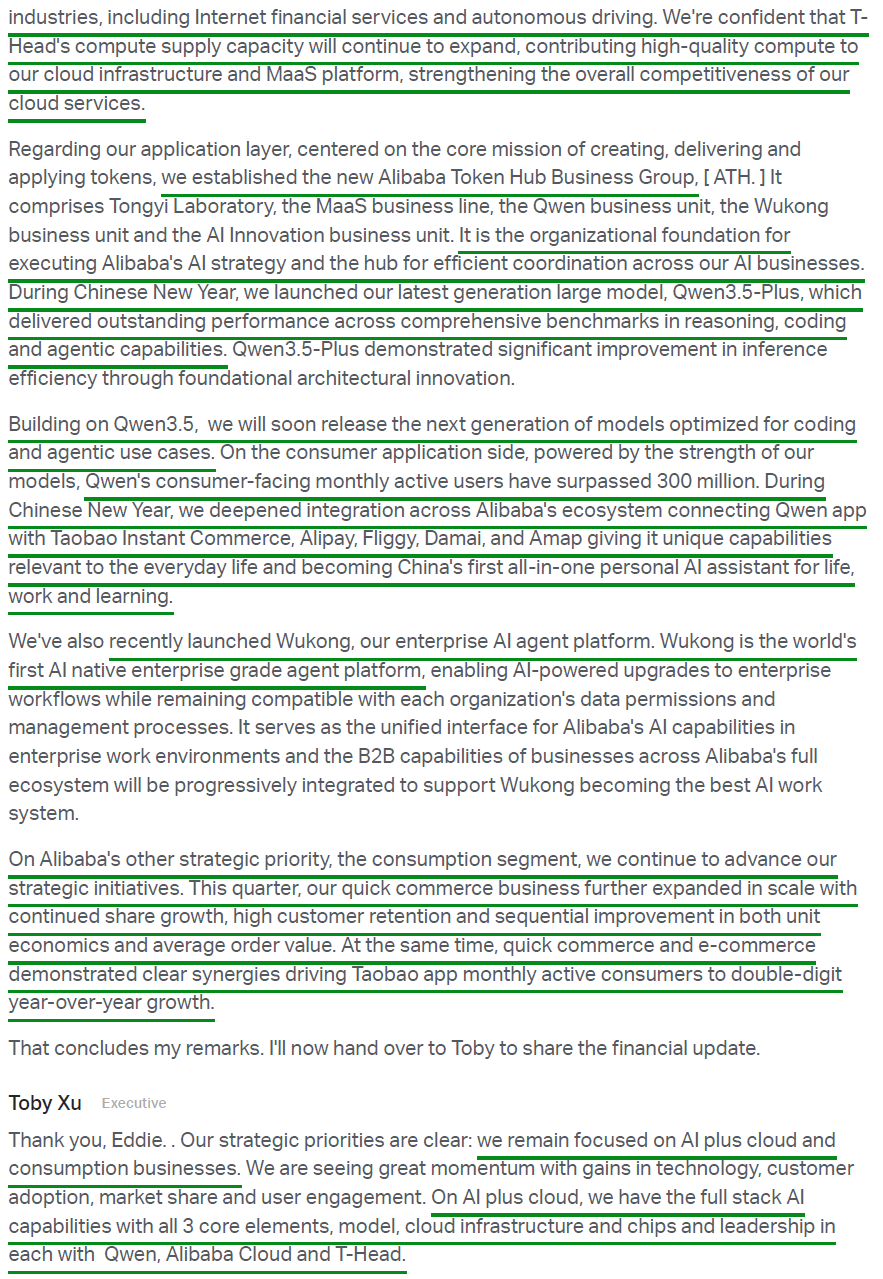
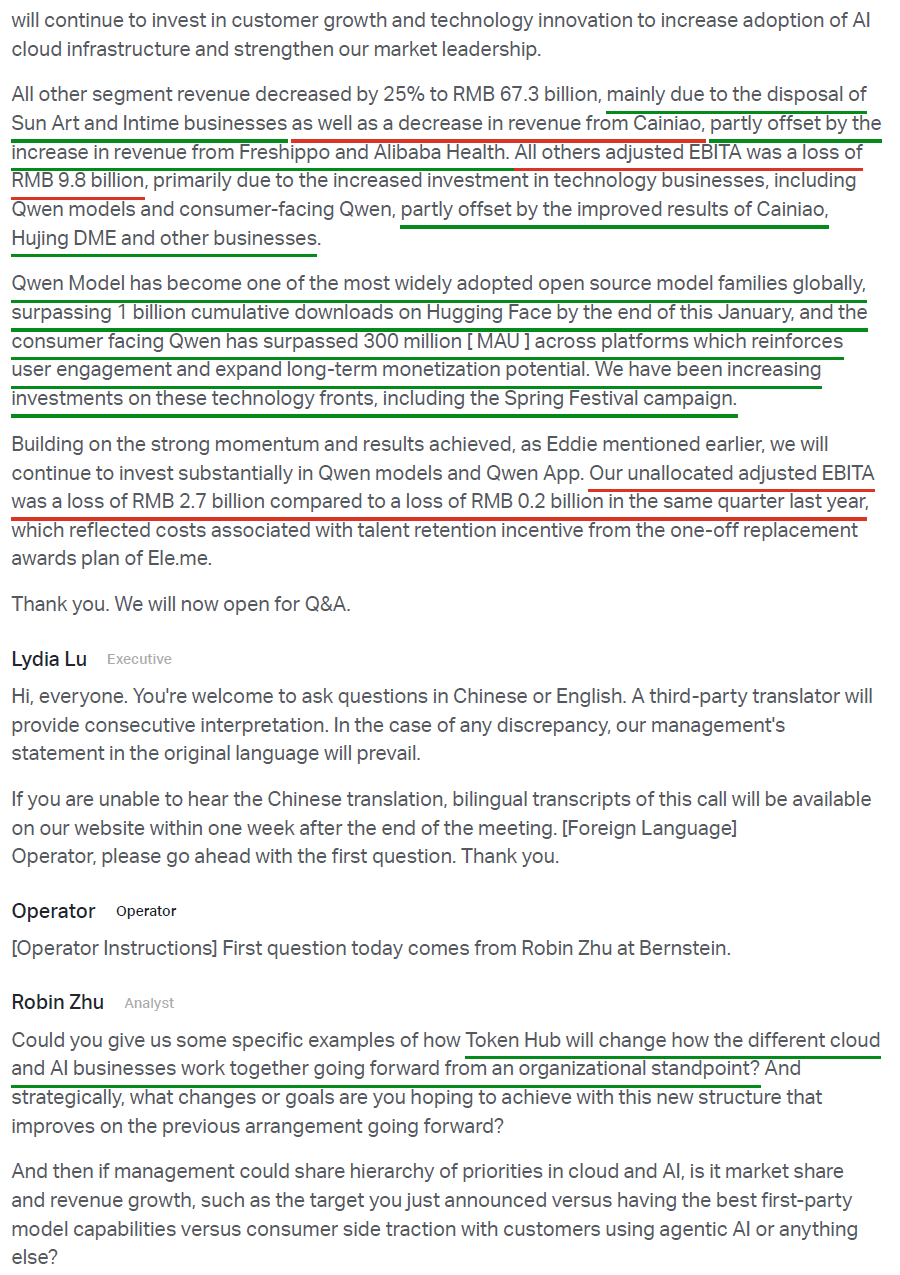
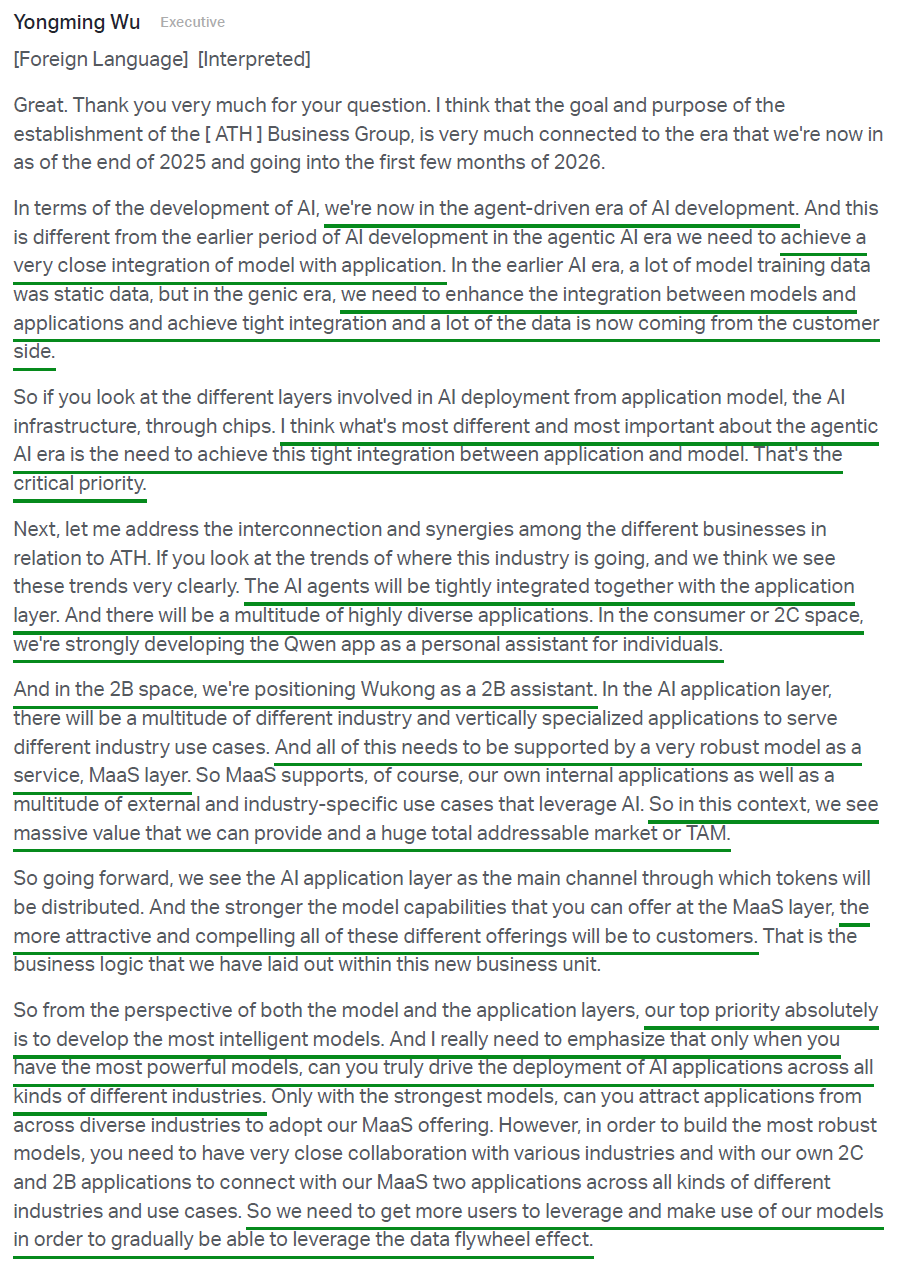
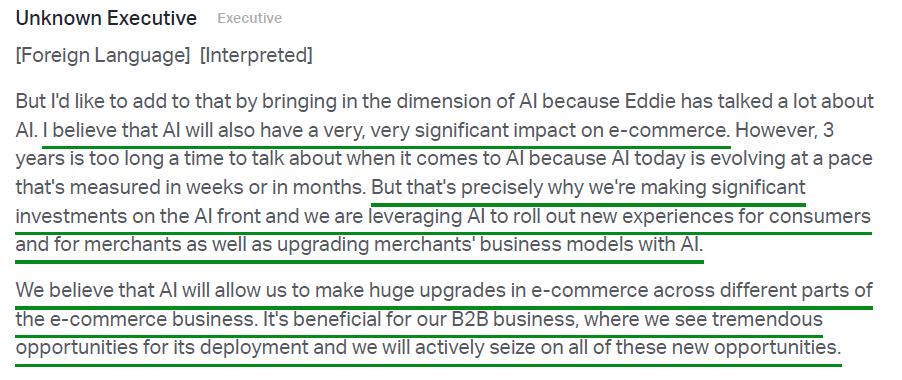
3) AI-related product revenue posted triple-digit growth for the tenth consecutive quarter, now accounting for a significant share of Cloud segment external revenue (>20% as of Q2). The consumer-facing Qwen app has surpassed 300M MAU across all platforms, with deep integration across the core Alibaba ecosystem including Taobao, Tmall, Amap, Fliggy, and Alipay. By the end of February, ~140M users had their first AI-driven shopping experience through Qwen’s agentic features, with Qwen becoming China’s first all-in-one personal AI assistant. Qwen models have also surpassed 1B cumulative downloads on Hugging Face, making them the world’s most widely used open-source model family.
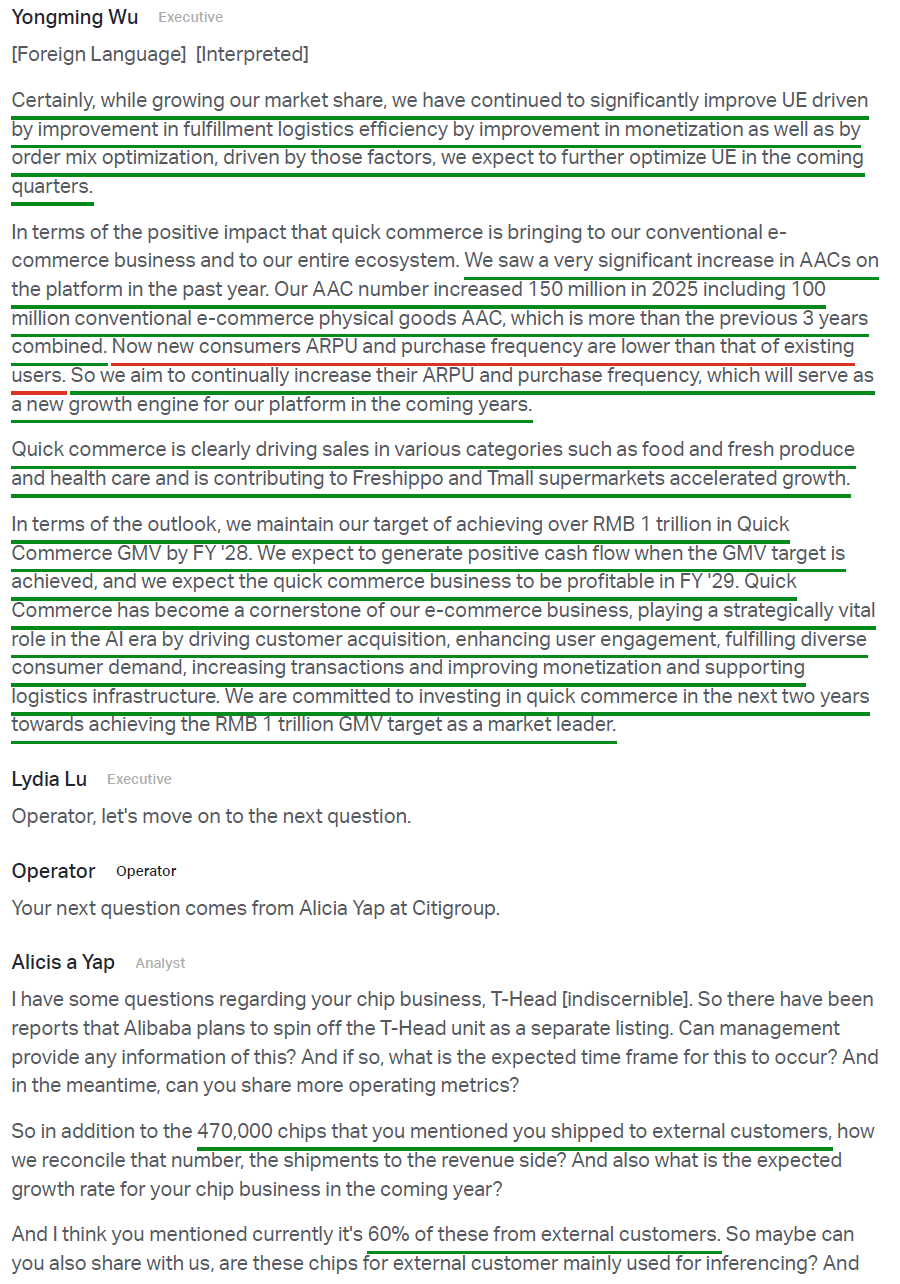
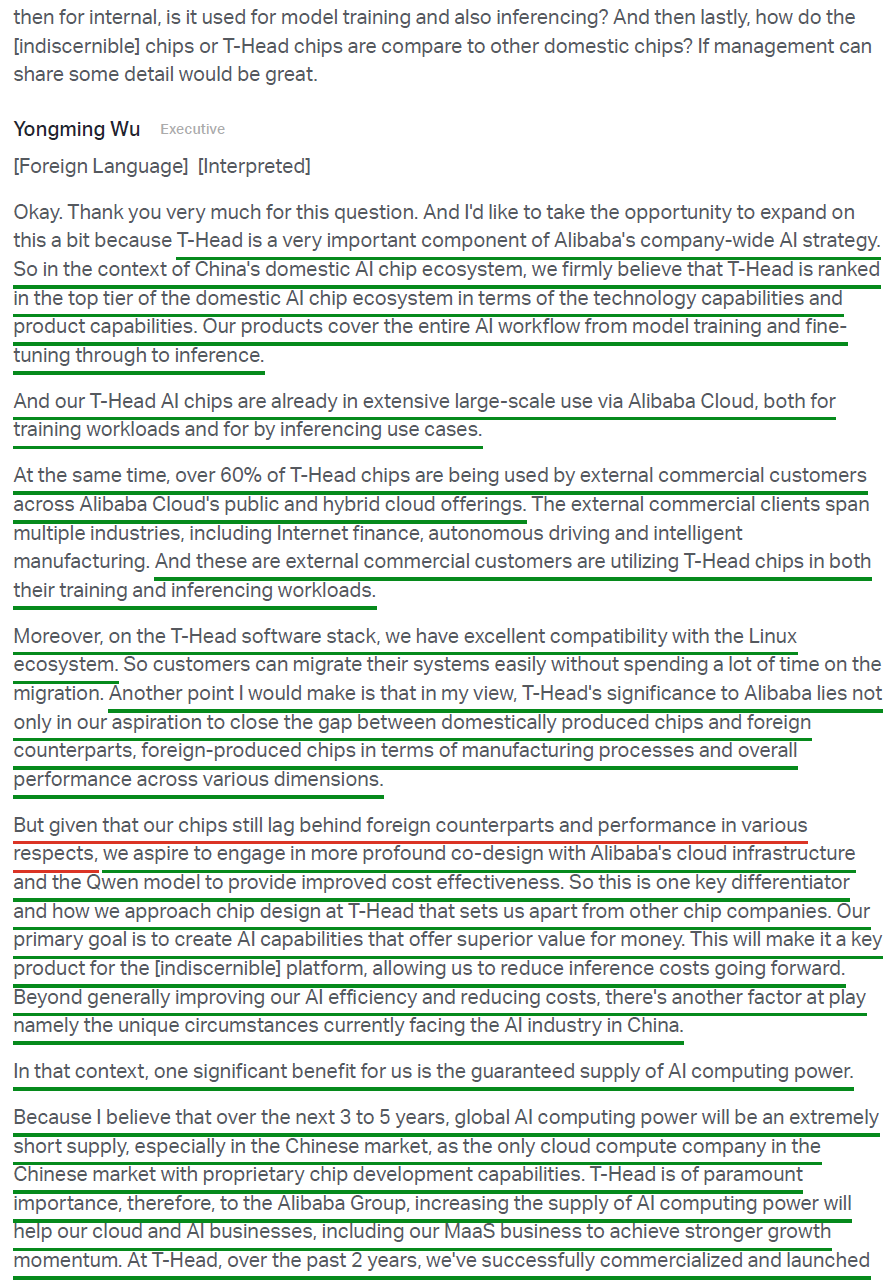
4) T-Head, Alibaba’s proprietary GPU chip subsidiary, has scaled to mass production, shipping >470k AI chips with annualized revenue now in the RMB 10B scale (~$1.4B). More than 60% of chips are serving and supporting AI workloads for 400+ external enterprise customers across multiple industries, with management expecting continued production capacity expansion to meet demand. Management ranks T-Head in the top tier of the domestic AI chip ecosystem, with a clear edge in cost effectiveness relative to foreign counterparts. Management did not rule out a rumored IPO of the business, though no timeline was given.
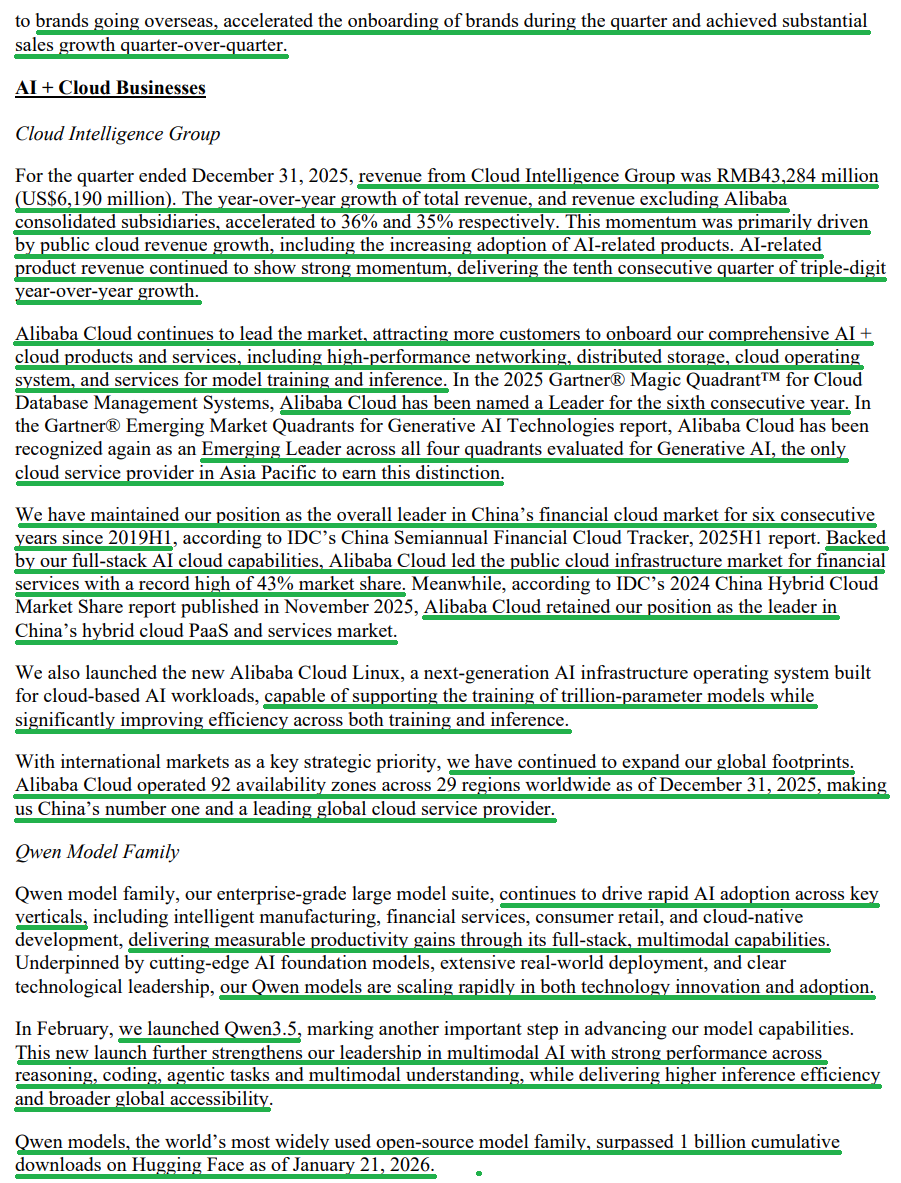
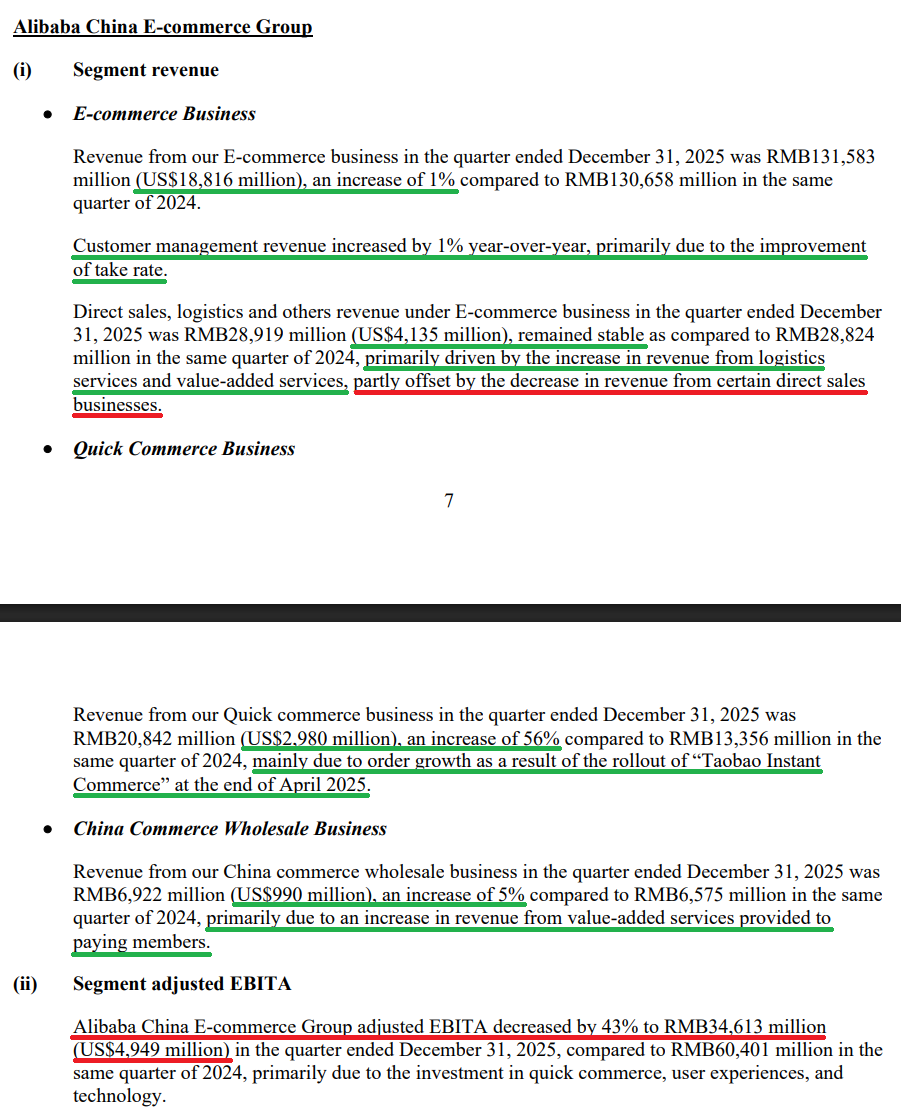
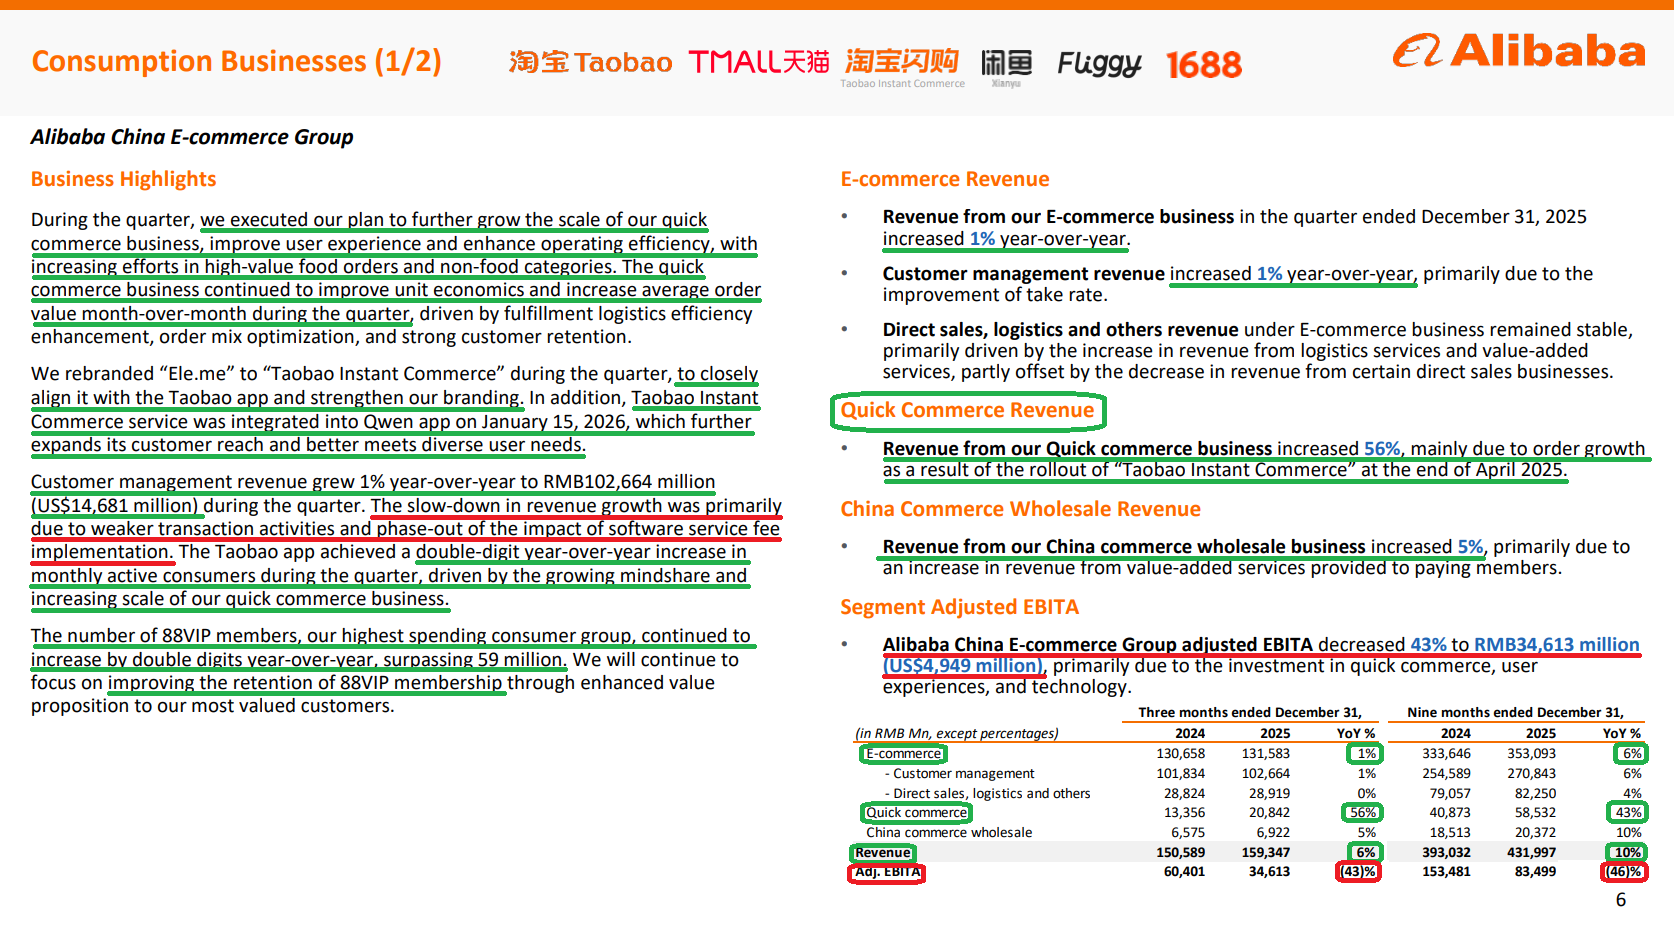
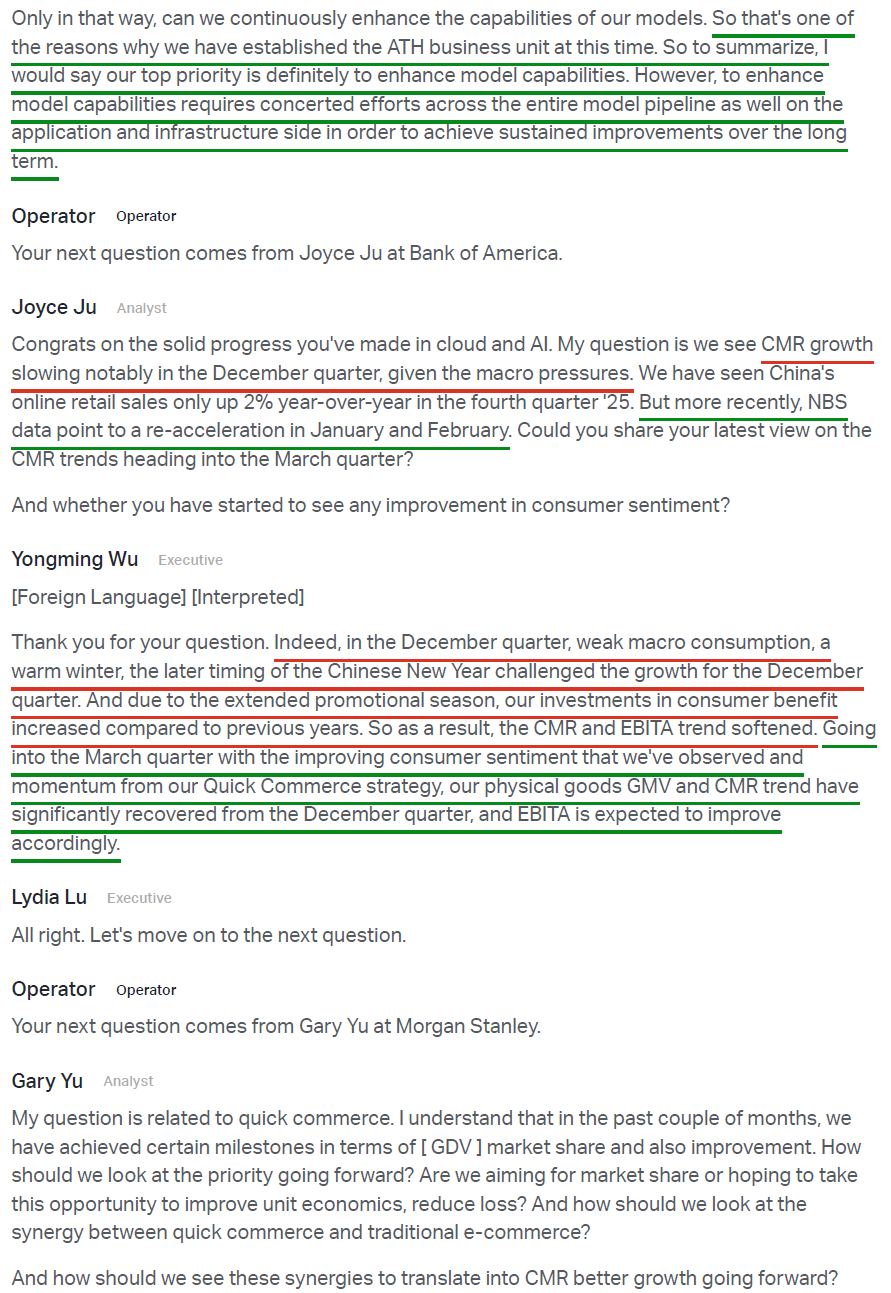
5) China e-commerce revenue came in at $22.79B (+6% Y/Y), with the core business ex-Quick Commerce and wholesale at $18.82B (+1% Y/Y). Customer management revenue slowed to just +1% Y/Y to $14.68B, driven by softer transaction activity and the phasing out of the software service fee implementation tailwind from last year. 88VIP members, Alibaba’s highest-spending cohort and equivalent of Amazon Prime, continued to grow double digits Y/Y and have now surpassed 59M. Heading into the March quarter, management noted improved consumer sentiment with both physical goods GMV and CMR trends significantly recovering, and EBITA expected to improve accordingly.
6) Quick commerce revenue grew +56% Y/Y to $2.98B, with continued GMV market share gains and sequential improvement in both unit economics and average order value throughout the quarter. Management expects further UE improvement in the coming quarters driven by fulfillment logistics efficiency, order mix optimization, and strong customer retention. Importantly, quick commerce strength is driving clear synergies with traditional e-commerce growth, with the Taobao app achieving a double digit Y/Y increase in MAA during the quarter. The long-term target of reaching RMB 1 trillion ($138B) in GMV by FY28 as a market leader remains intact, with management expecting positive cash flow upon hitting that milestone and profitability by FY29.
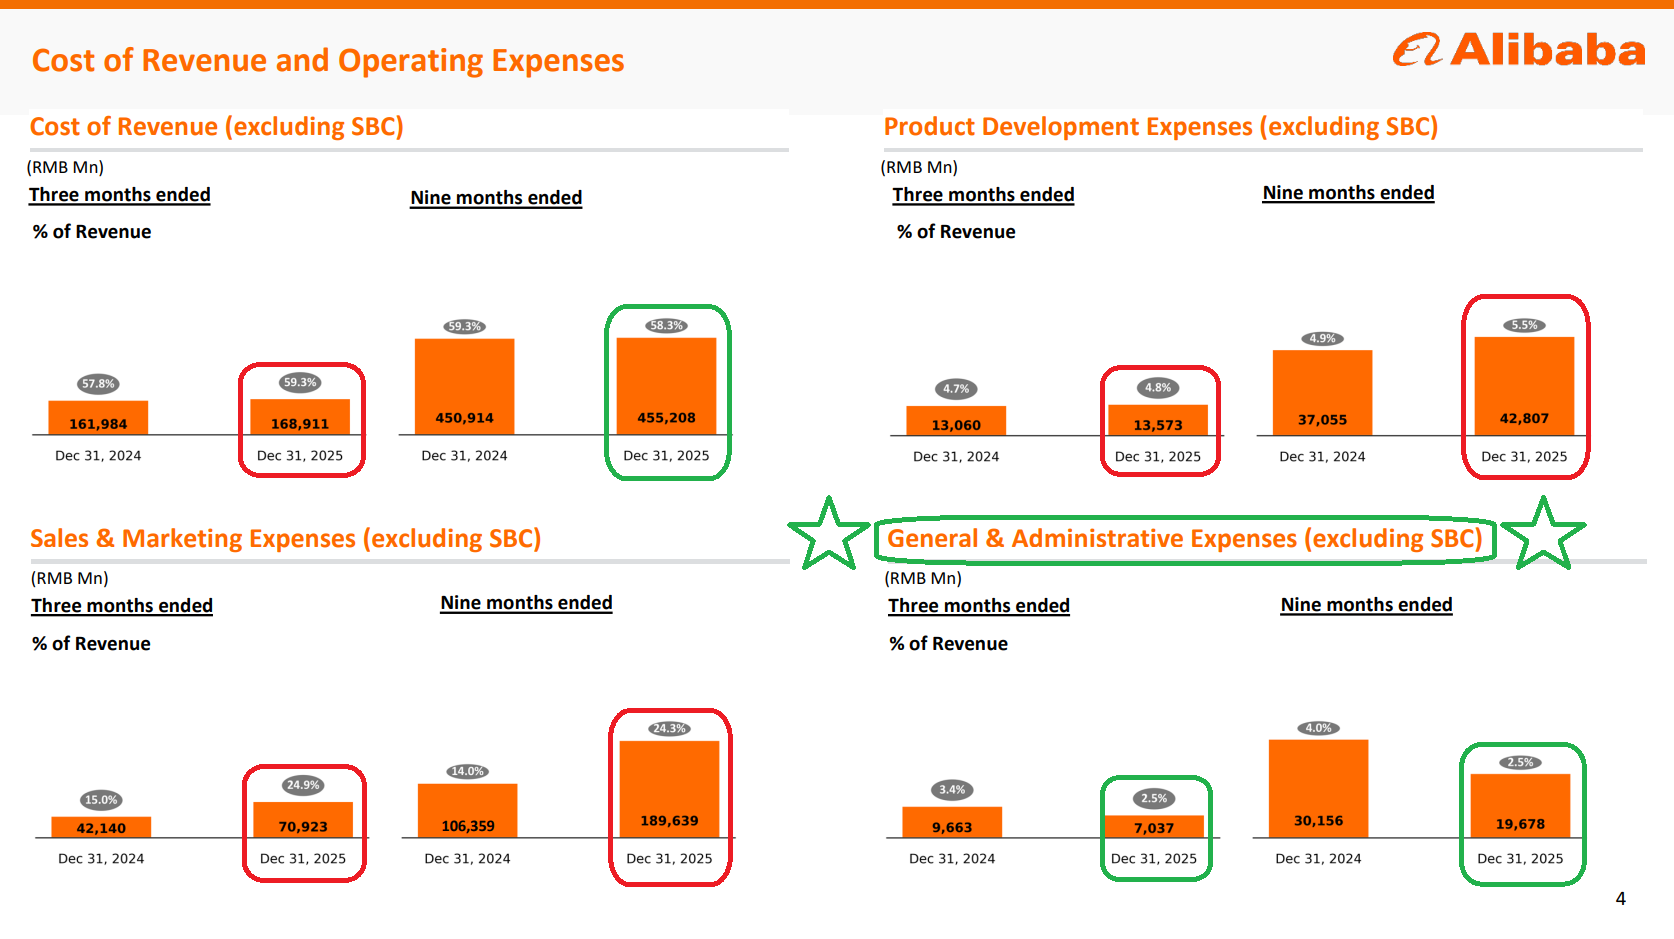
7) Profitability remained under pressure, with adjusted EBITA -57% Y/Y to $3.35B and margins falling to 8% from 20% in the prior year period. Increased investment in quick commerce continues to be a short-term drag, with sales and marketing expenses as a percentage of revenue climbing to 24.9% from 15% last year. On the positive side, G&A expense has declined to 2.5% from 3.4%. Management expects adjusted EBITA to continue to fluctuate near-term as investments remain elevated amid intense competition.
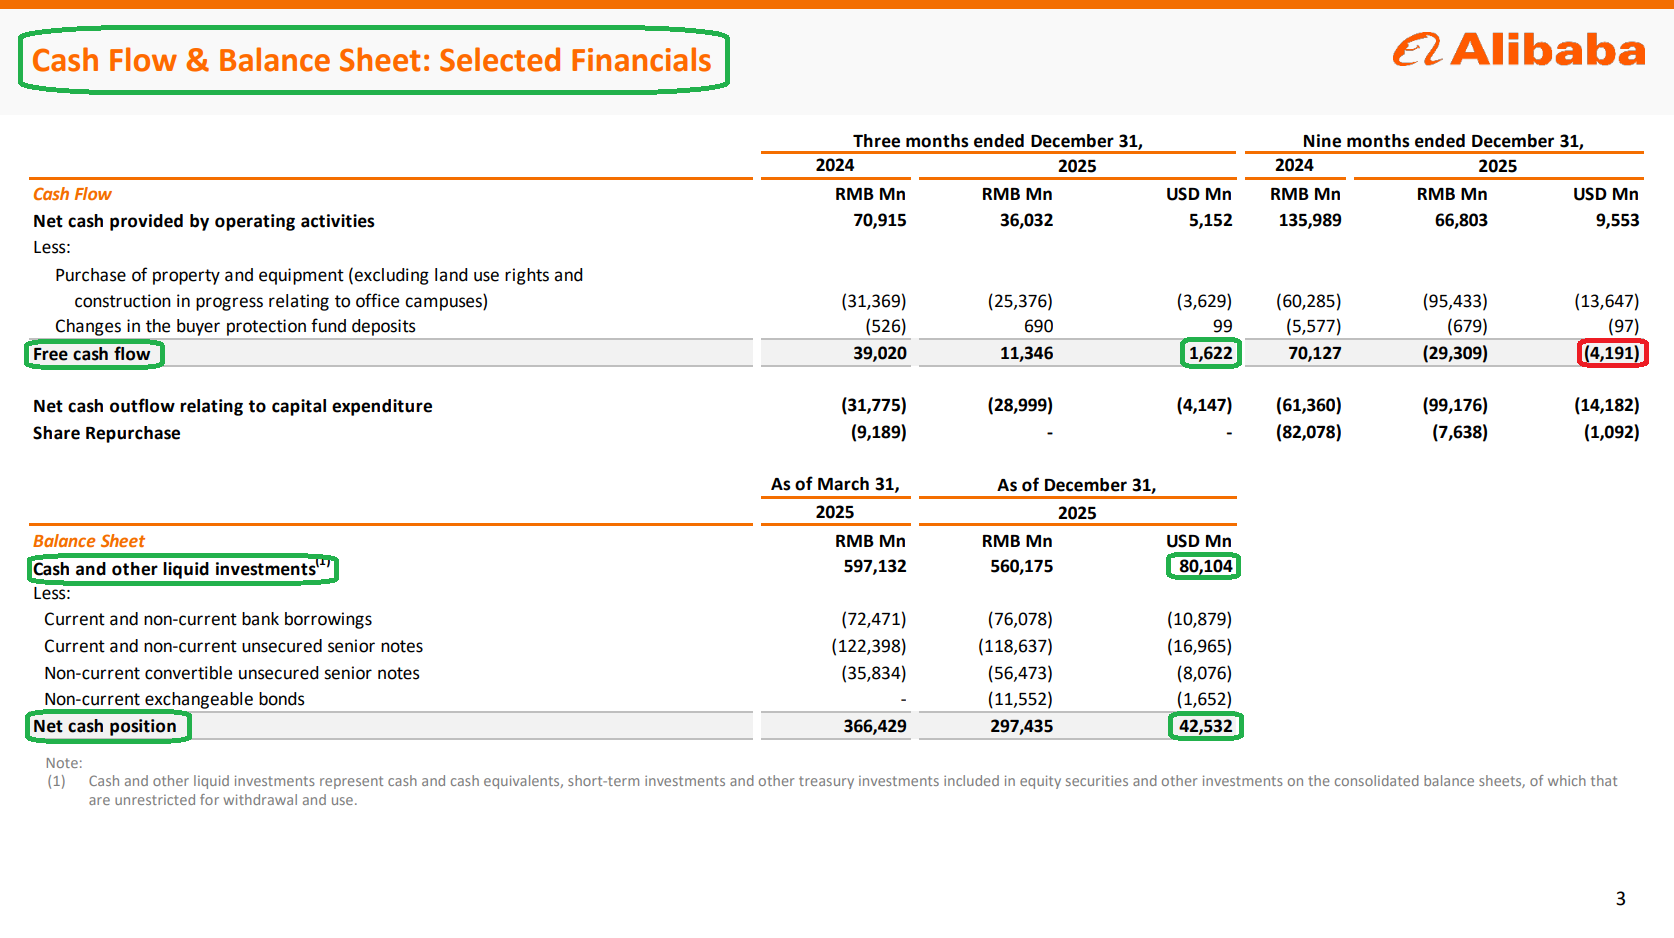
8) Free cash flow inflected positive to $1.62B after two consecutive quarters of outflows (-$2.63B in June, -$3.1B in September), even while reinvesting aggressively in AI/Cloud and Quick Commerce. While FCF is still -71% Y/Y and YTD outflow stands at -$4.19B, the turn to positive is an encouraging sign, with the fortress balance sheet giving us plenty of comfort with the heavy investment cycle.
9) Alibaba’s balance sheet remains in great shape, with cash and liquid investments of $80.1B and a net cash position of $42.5B, representing ~14% of the company’s total market cap. Excluding debt maturities beyond five years, the net position stands north of $60B.
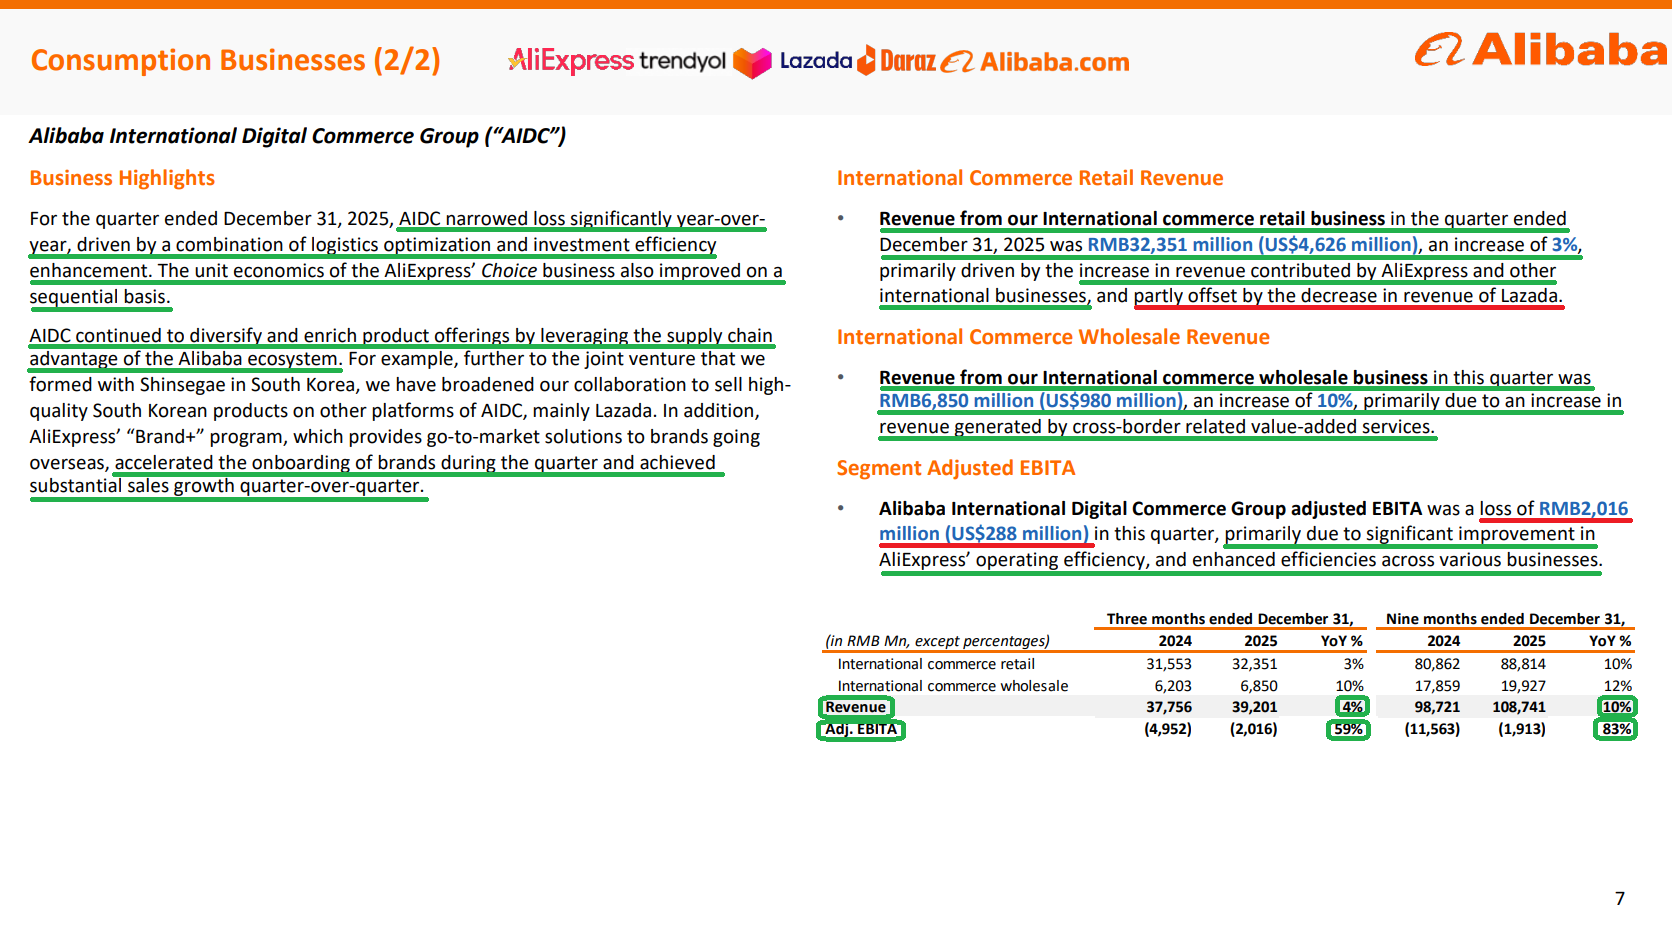
10) Alibaba International (AIDC) revenue grew +4% Y/Y to $5.61B, with international retail +3% to $4.63B and wholesale +10% to $980M. The segment continued to see losses narrow, with adjusted EBITA loss coming in at just $288M, driven by logistics optimization, investment efficiency, and improving unit economics in the AliExpress Choice business. Management expects further profitability improvement going forward.
Earnings Call Highlights
Morningstar Analyst Note
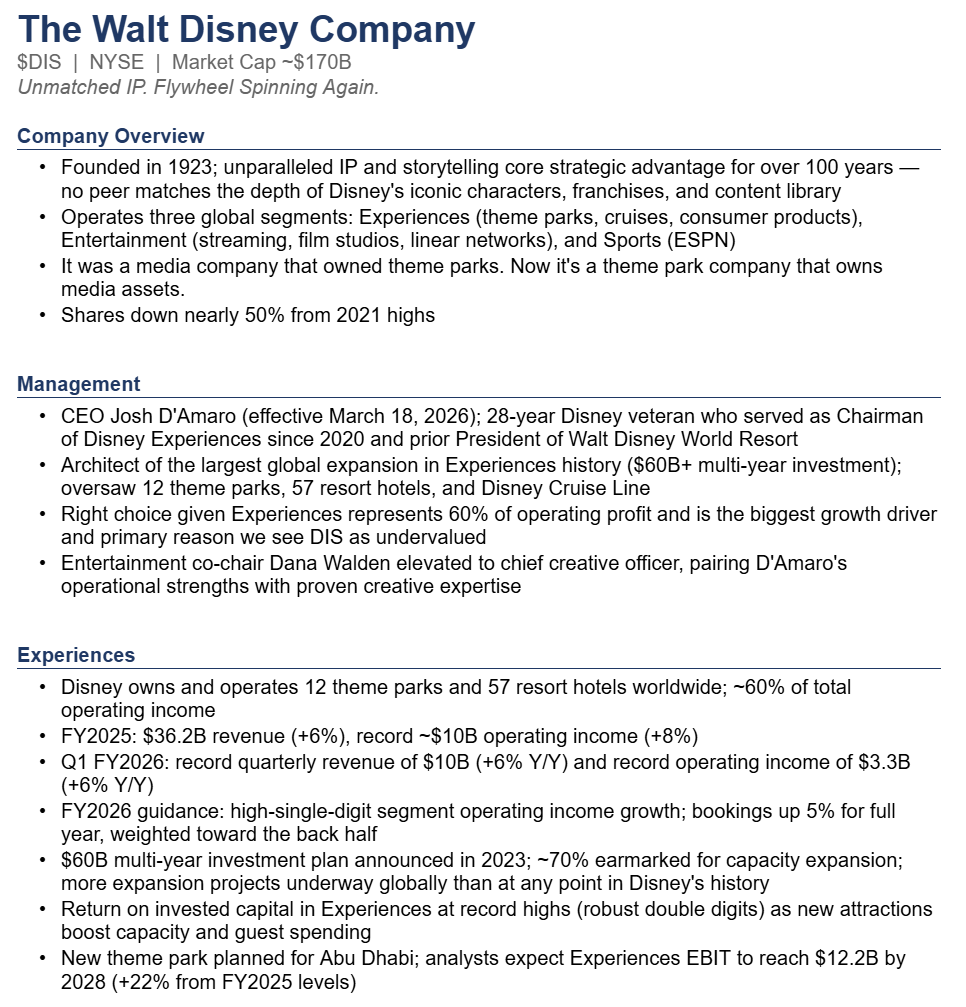
Disney Update
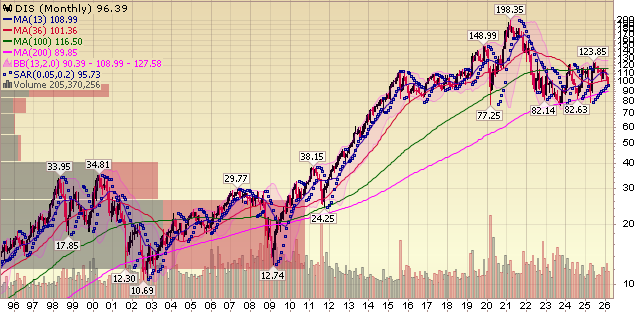
For newer readers, here’s a quick overview of the key drivers behind our thesis on Disney, once a media company that owned theme parks and now a theme park company that owns media assets:
Q1 Earnings Breakdown
10 Key Points
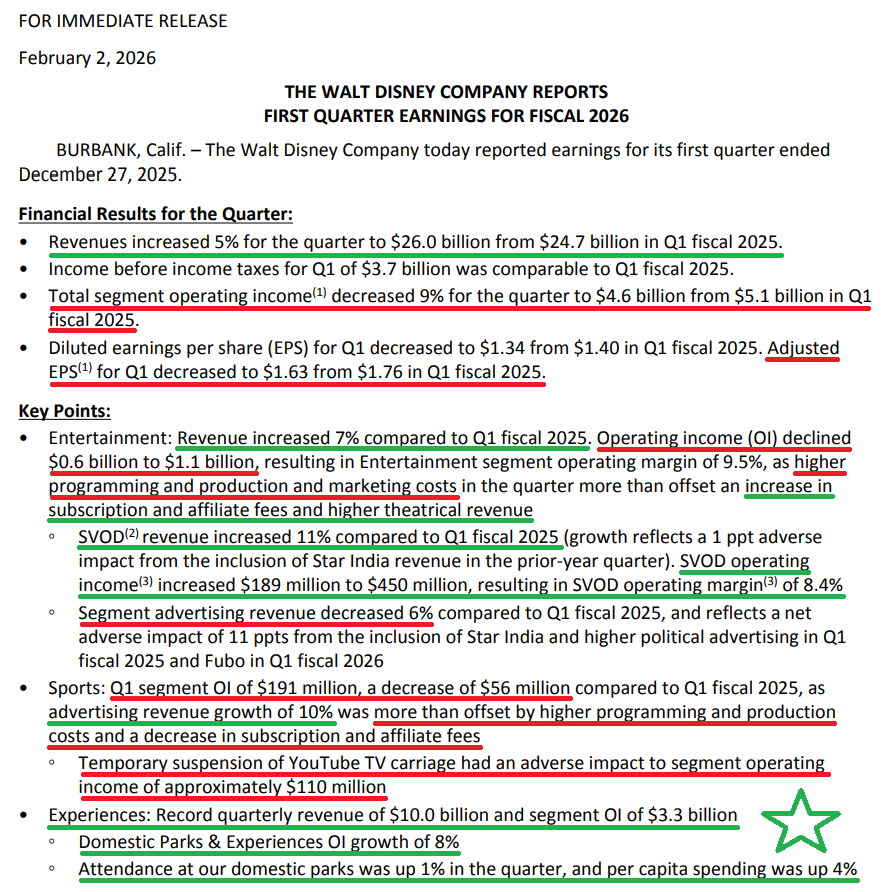
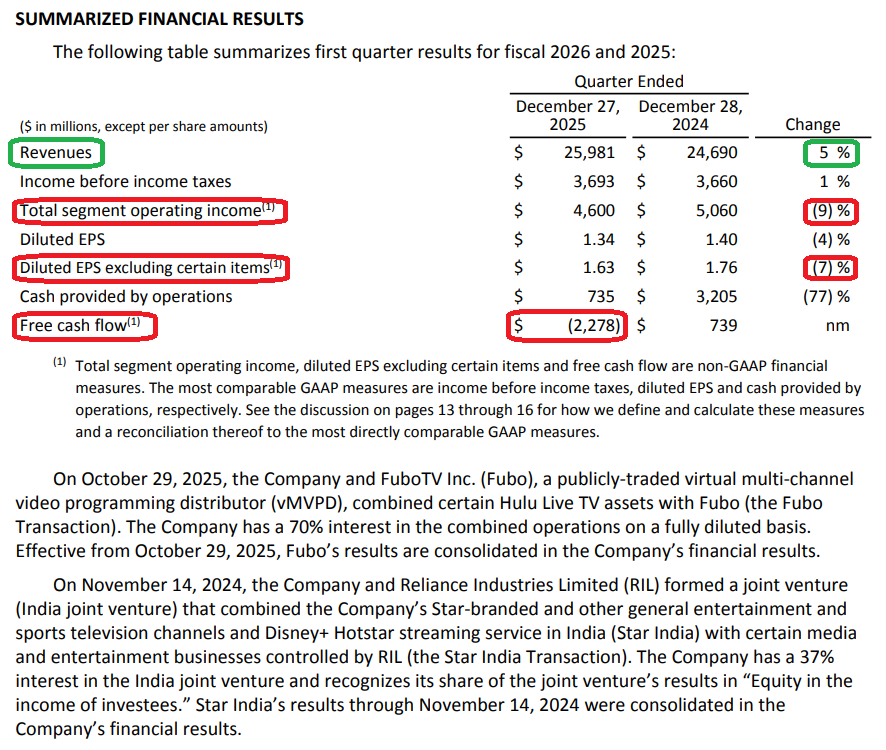
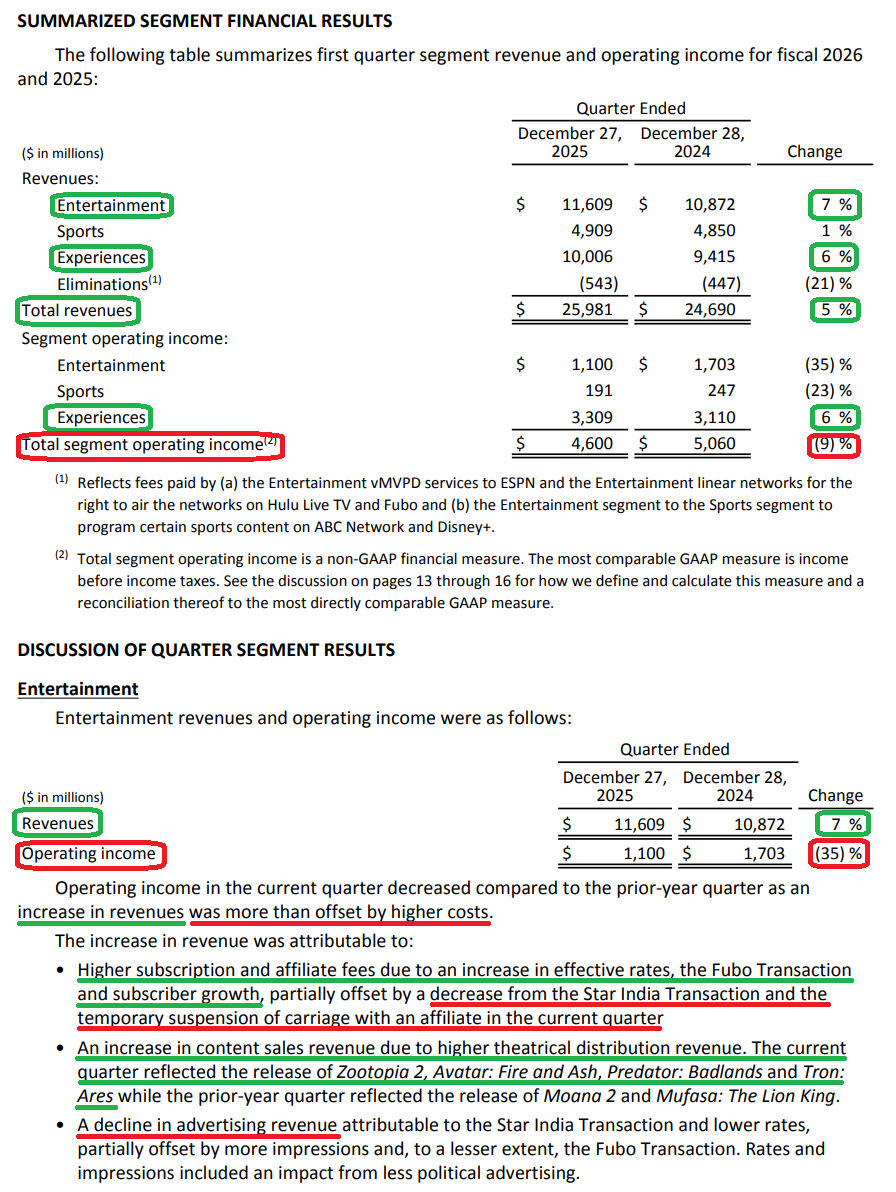
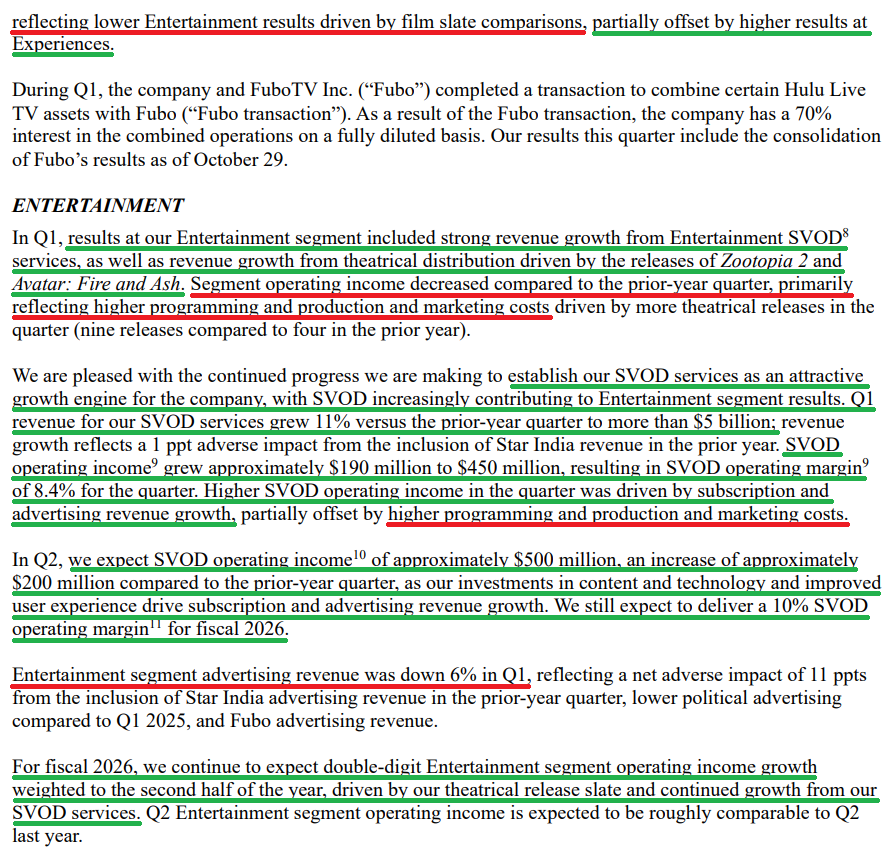
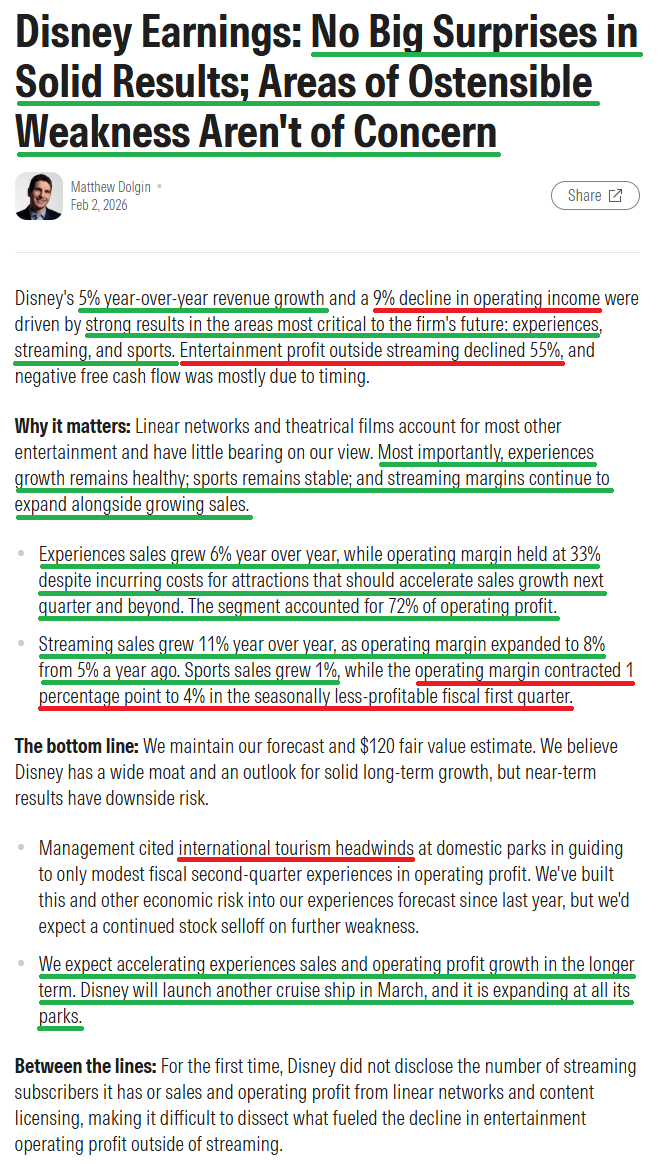
1) Revenue came in at $25.98B (+5% Y/Y), beating consensus $25.74B. Adjusted EPS of $1.63 (-7% Y/Y) beat consensus $1.57, with the Y/Y decline reflecting lower Entertainment results driven by film slate comps.
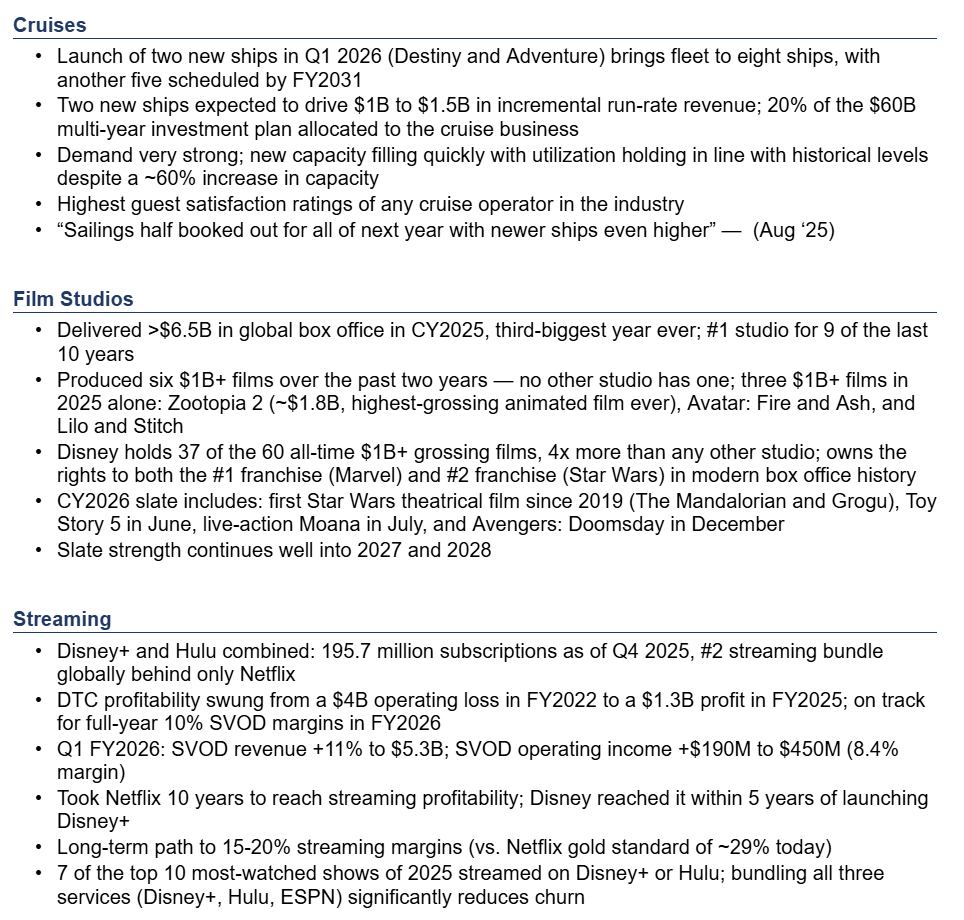
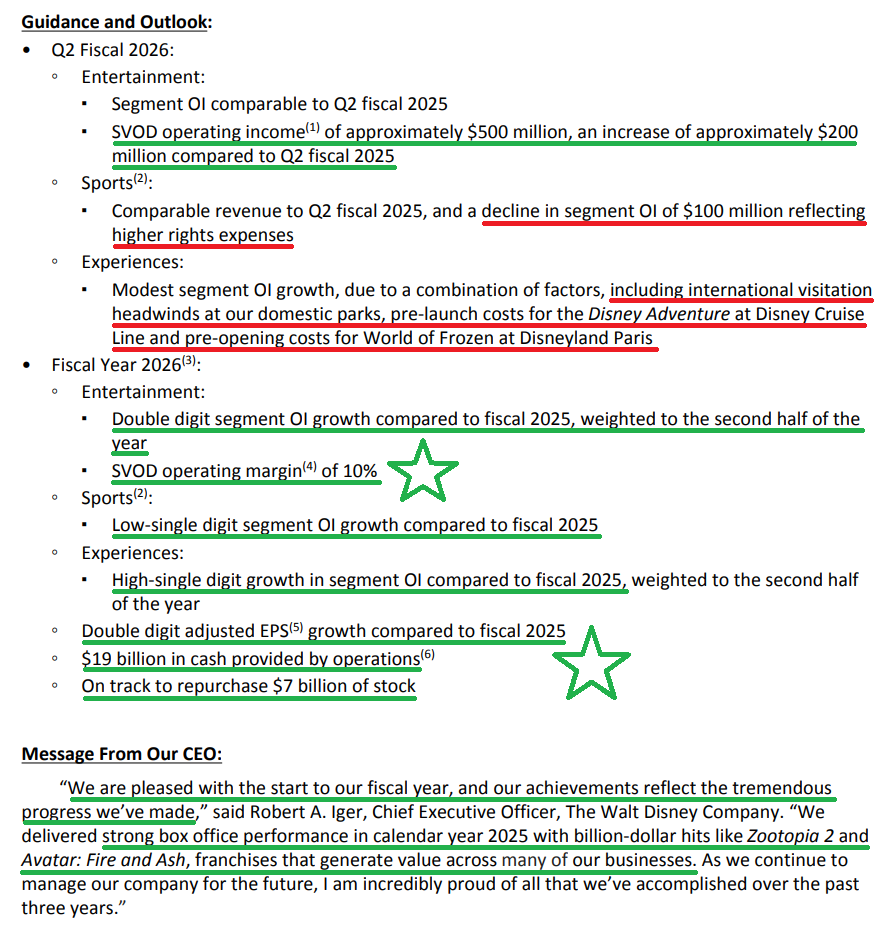
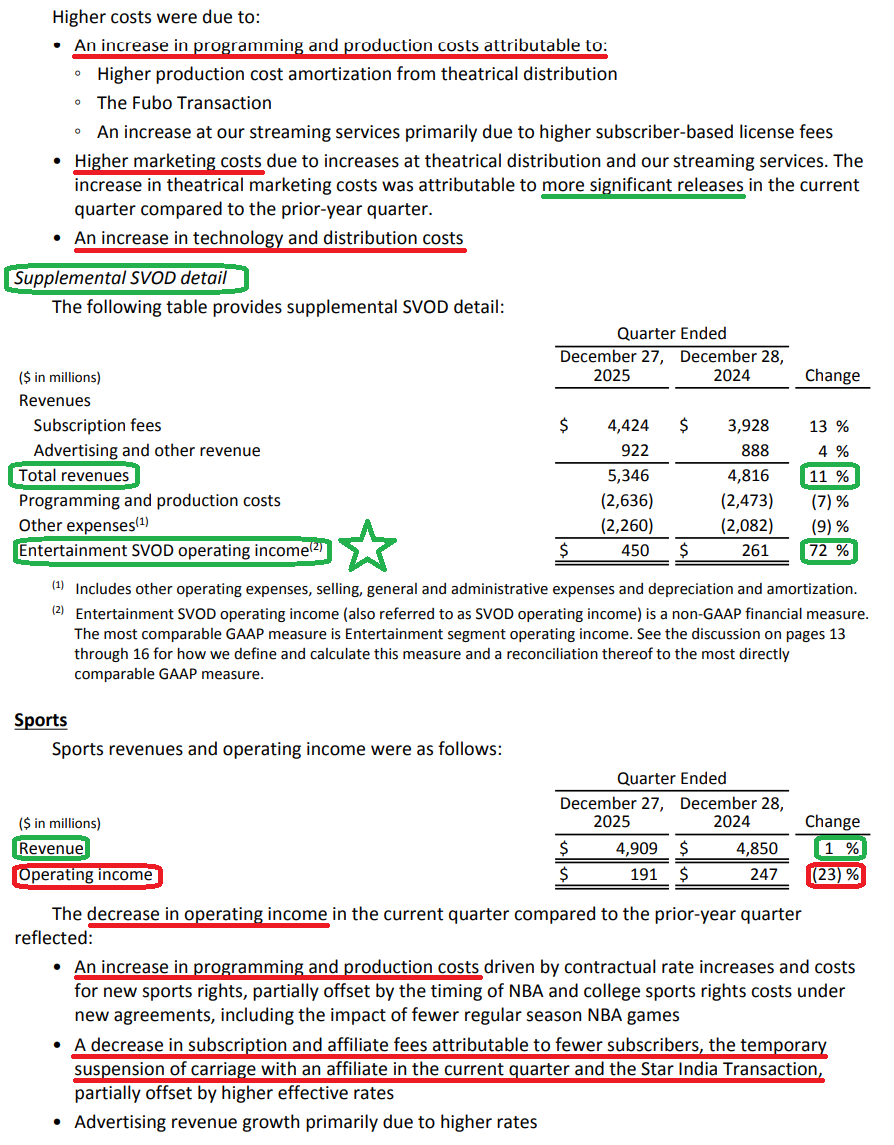
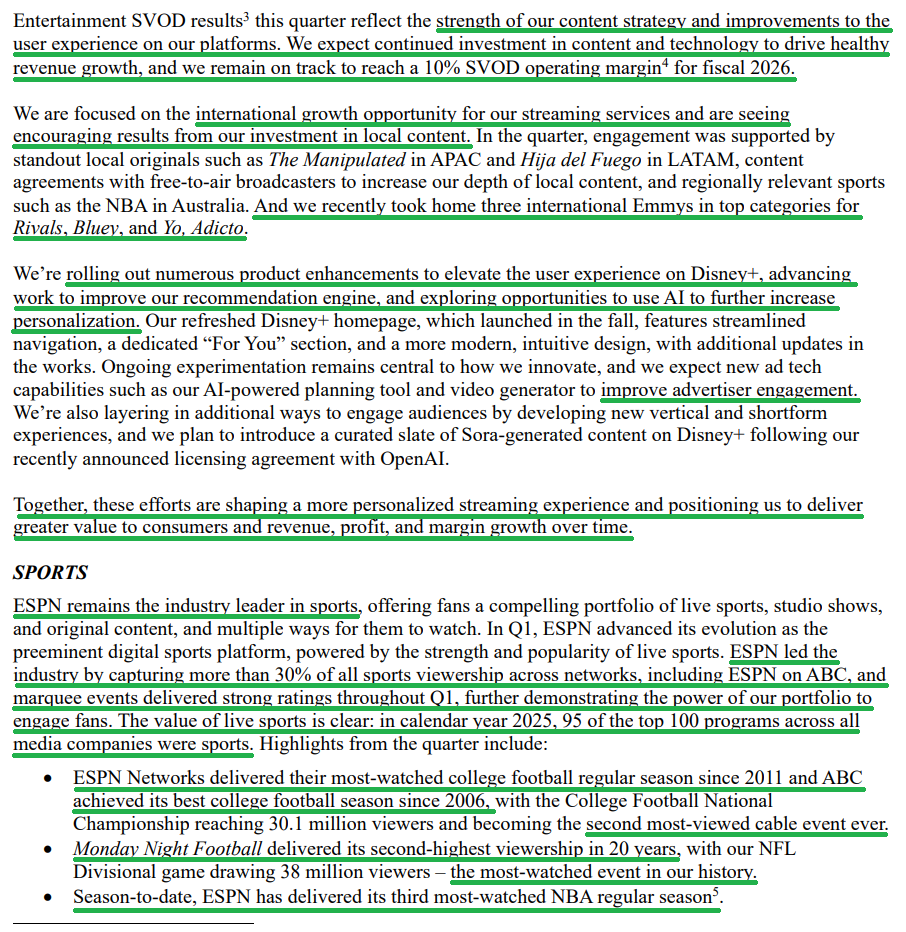
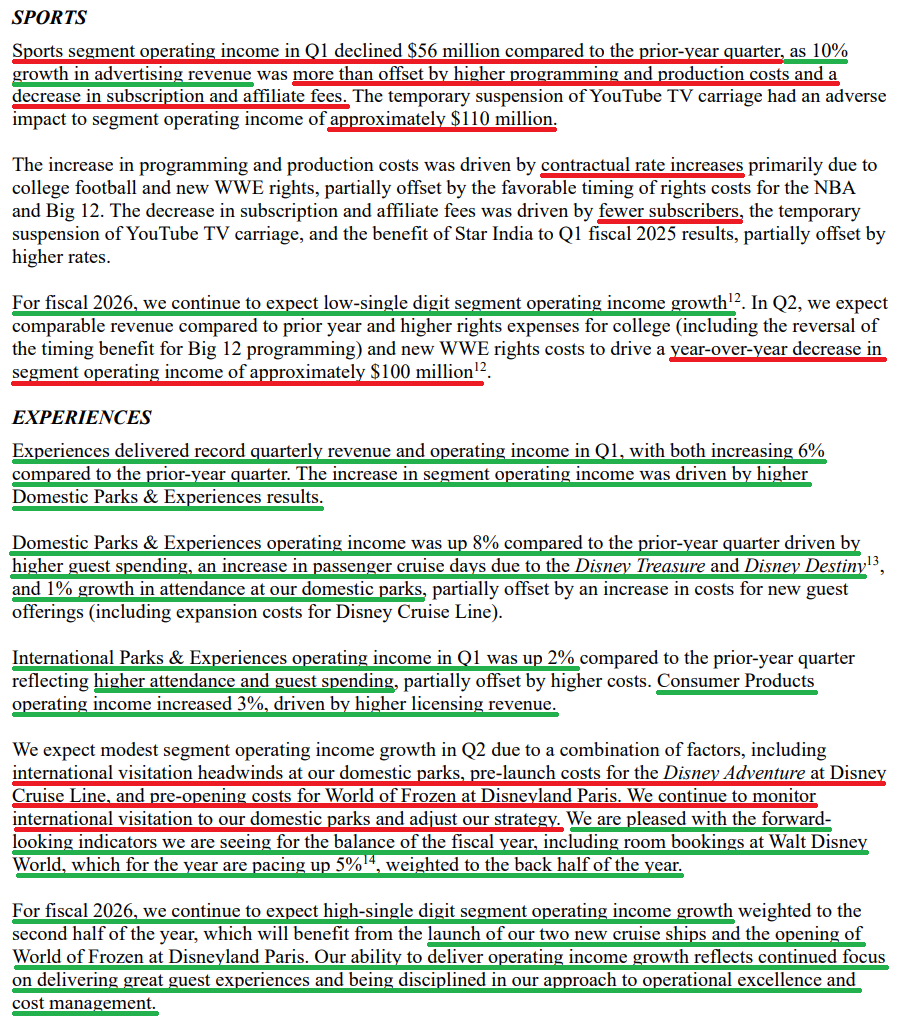
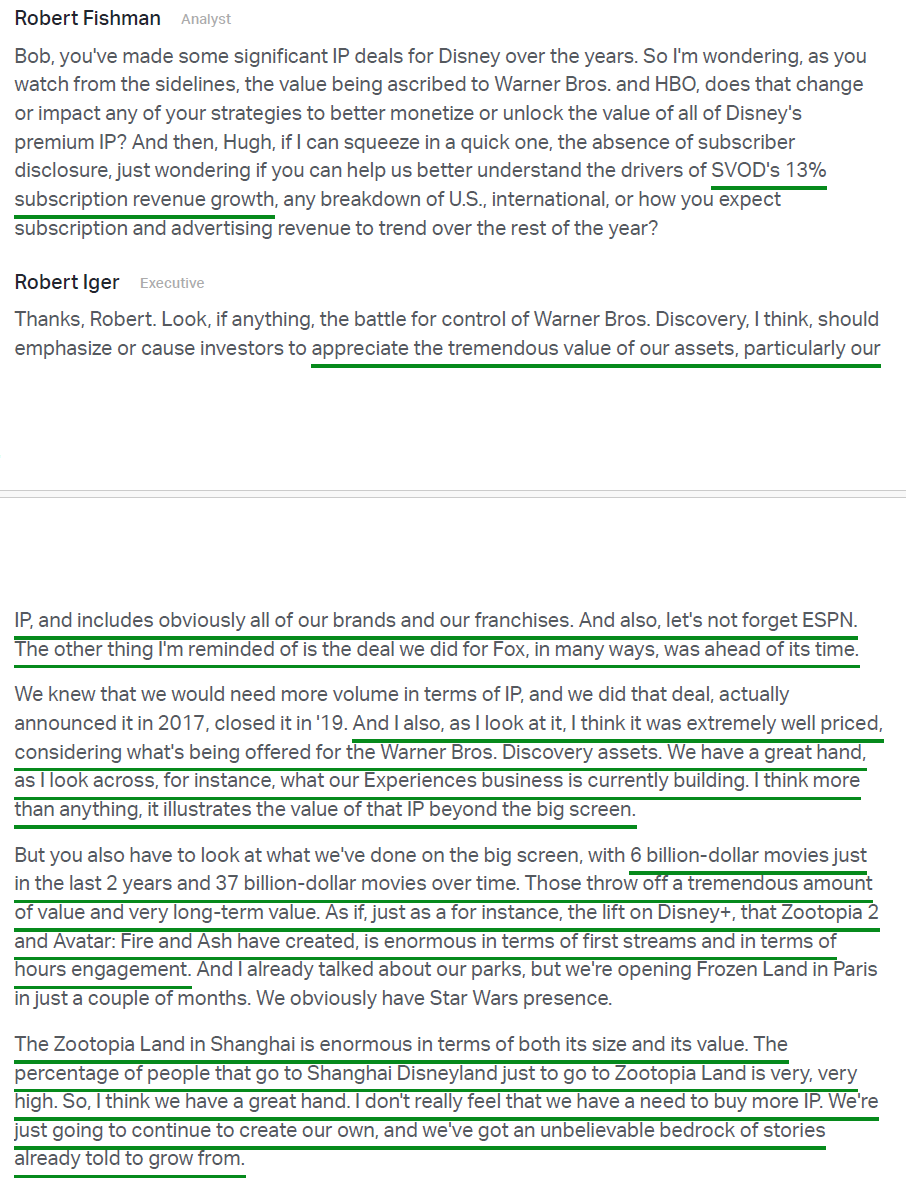
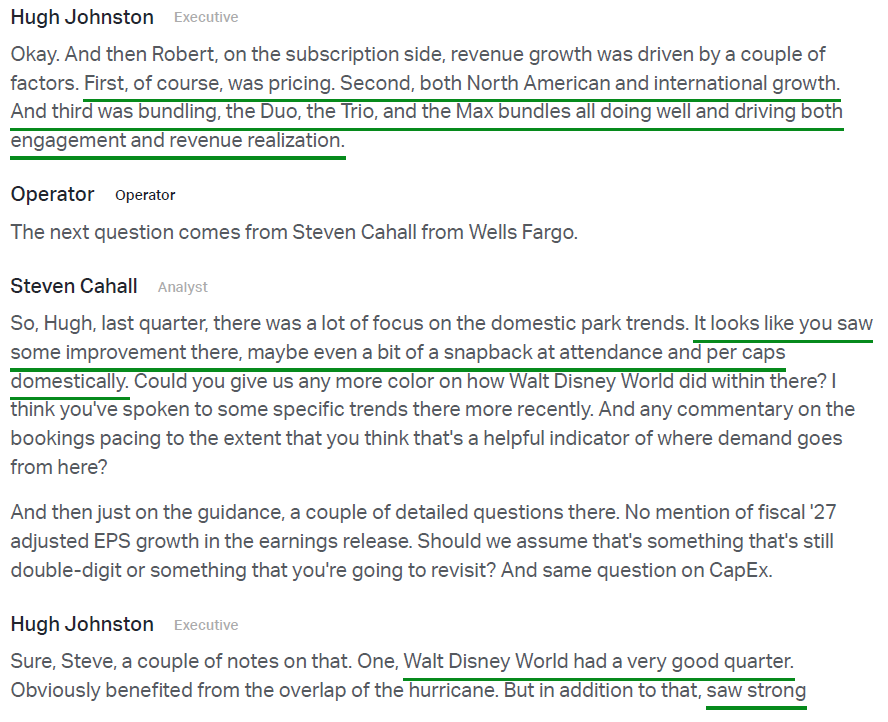
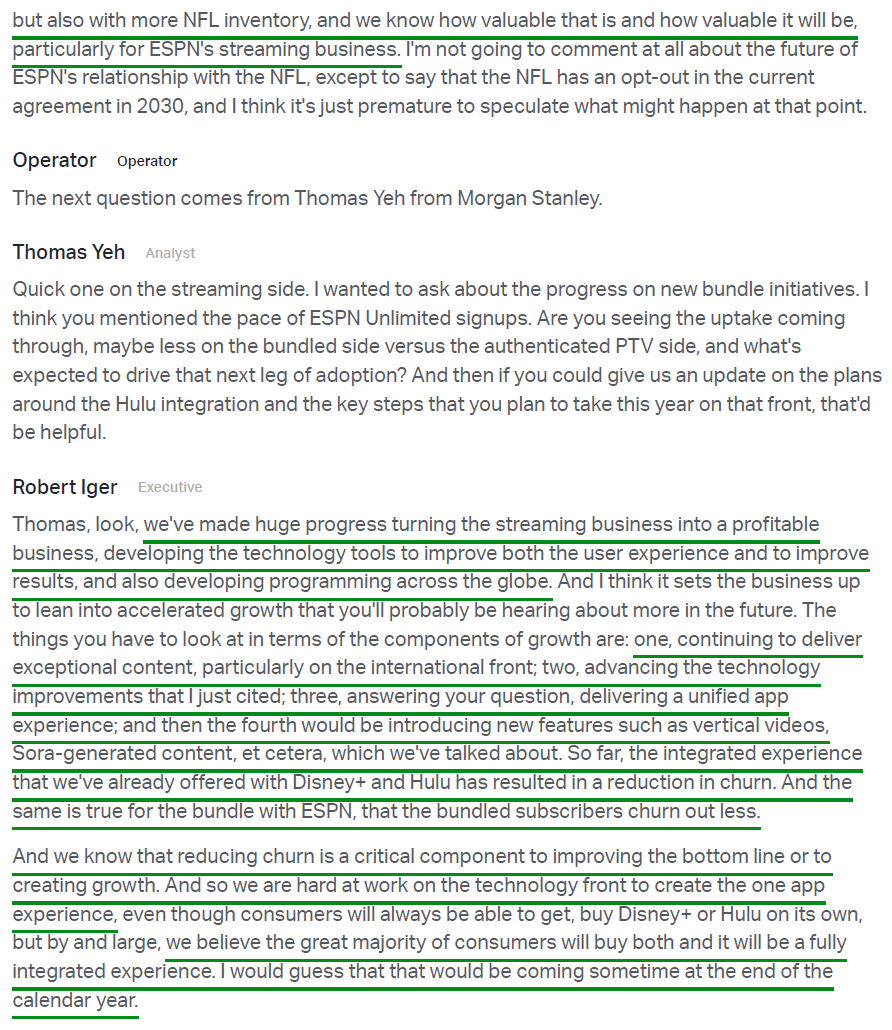
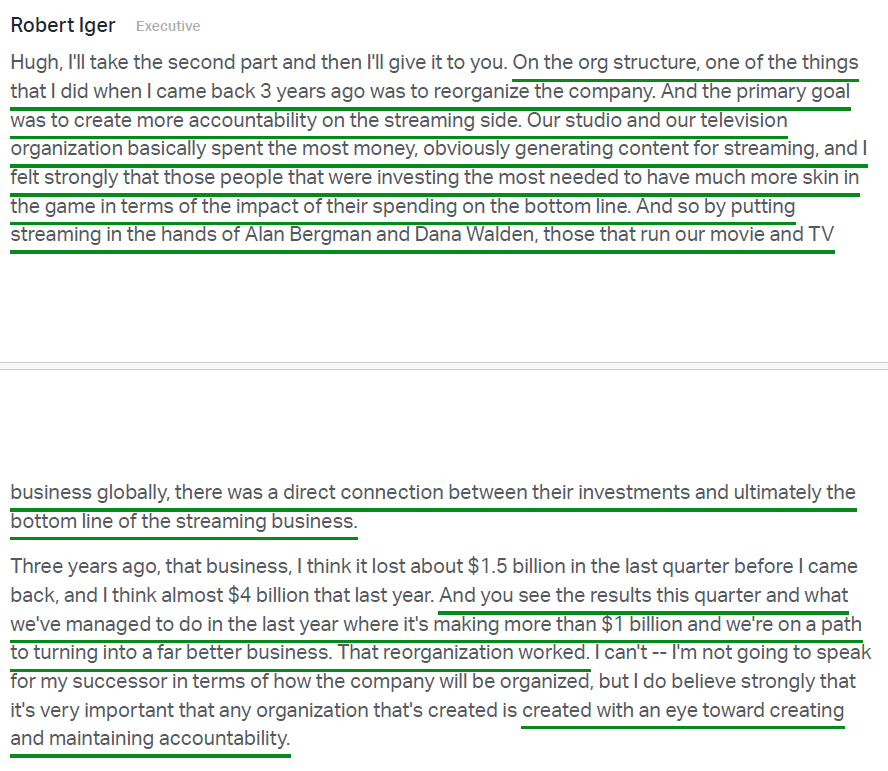
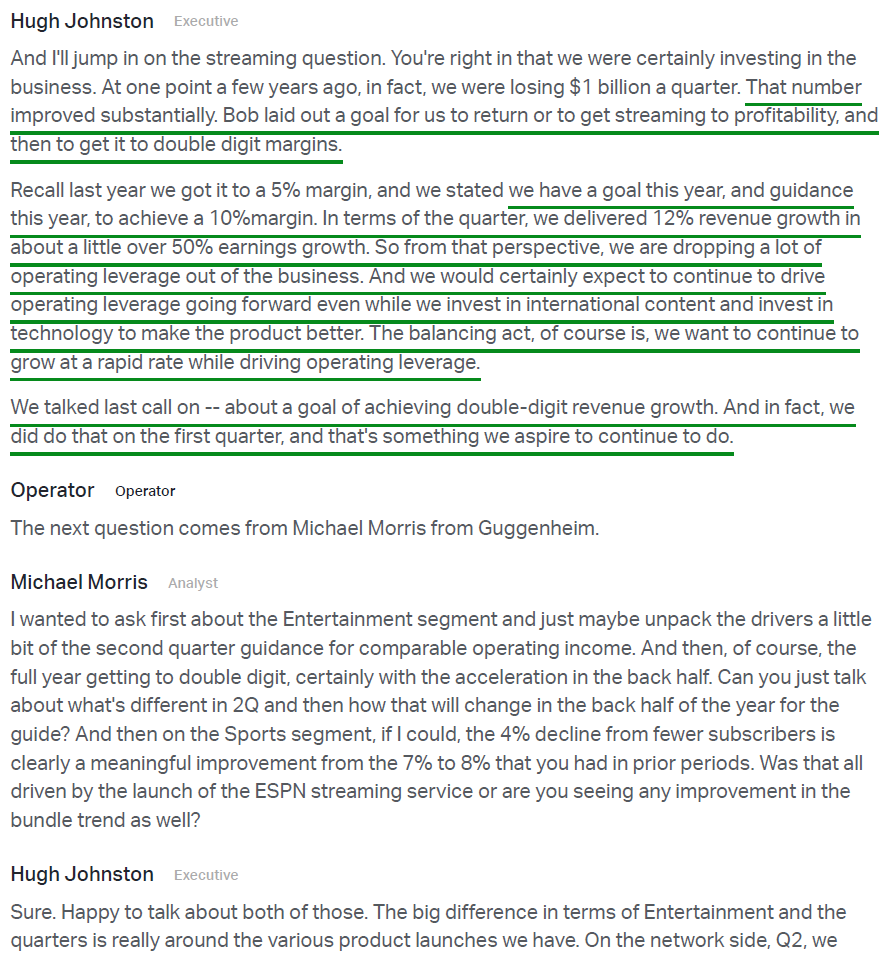
2) Streaming posted another strong quarter, with revenue +11% Y/Y to $5.35B and operating income +72% Y/Y to $450M, well ahead of street estimates and prior guidance of ~$375M, with margins reaching 8.4% vs. 5.4% in the prior year. Strength during the quarter was driven by a 13% increase in subscription fees to $4.42B and 4% growth in advertising and other revenue to $922M. Q2 operating income is guided to ~$500M (+$200M Y/Y), with management reiterating confidence in hitting 10% SVOD margins for the full year as streaming continues to take the baton from Linear Networks as Disney’s next growth engine. Management also expects to roll out an integrated app experience combining Disney+ and Hulu before year end, with the bundling strategy continuing to reduce churn and drive engagement.
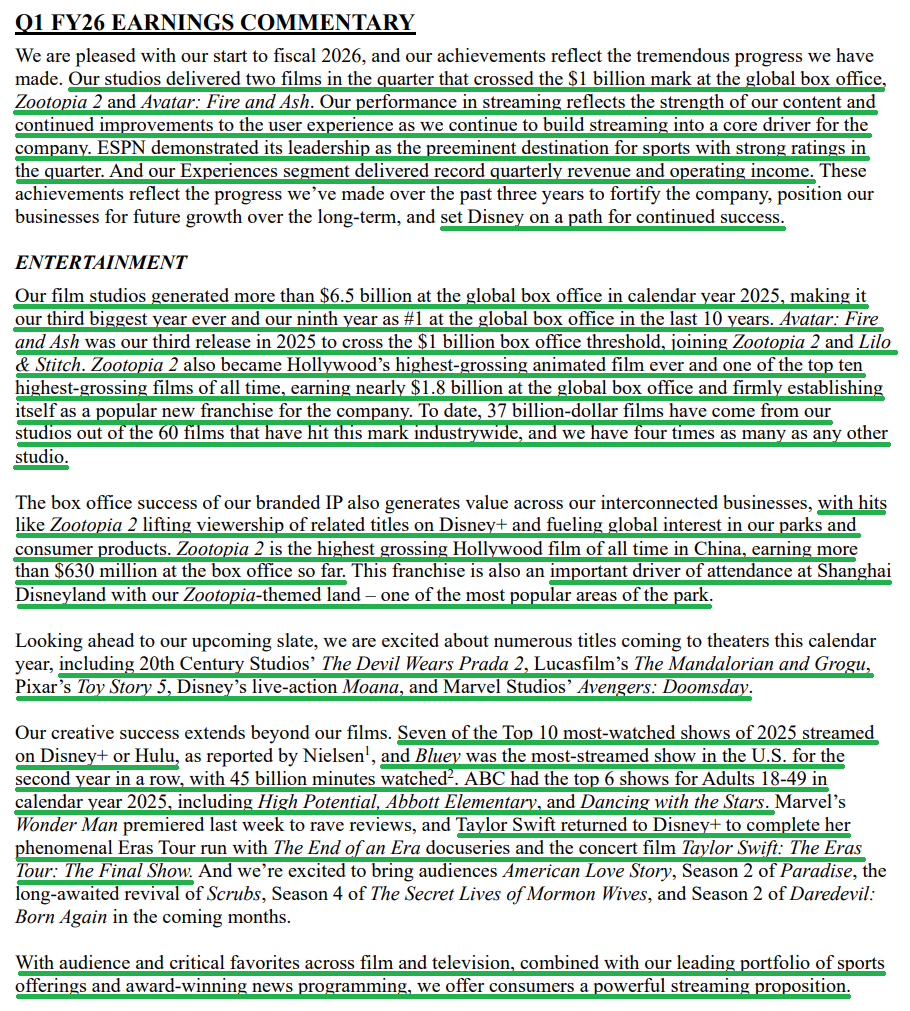
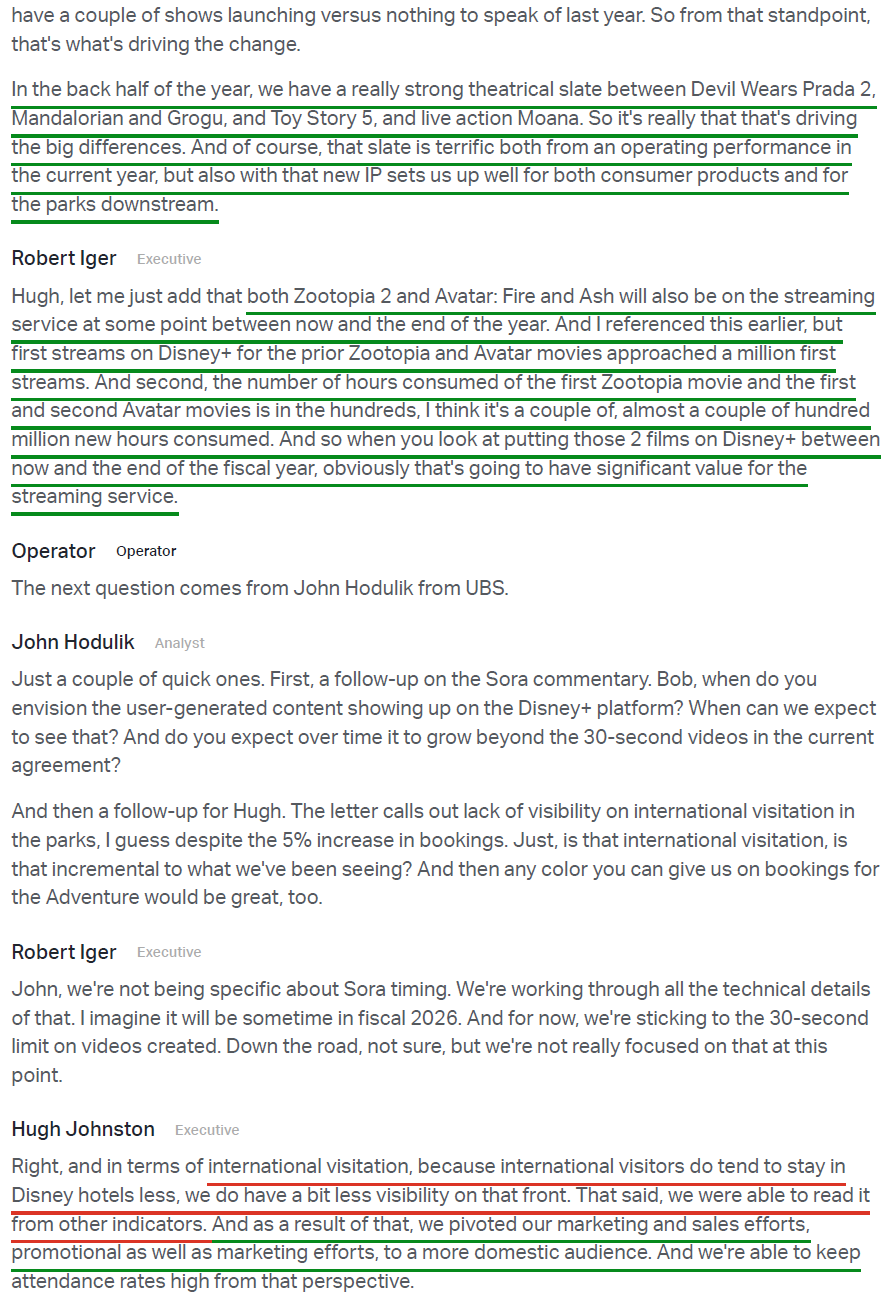
3) Disney’s film studios delivered a landmark year in calendar 2025, generating >$6.5B at the global box office, marking the third-biggest year ever and the ninth time in the last decade Disney has ranked #1. Three films crossed the $1B threshold, led by Zootopia 2 (~$1.8B), which set the record as Hollywood’s highest-grossing animated film ever and ranks among the top 10 highest-grossing films of all time. To date, Disney holds 37 of the 60 films in industry history to cross $1B, 4x any other studio. The upcoming slate is as strong as it has ever been, with The Devil Wears Prada 2, The Mandalorian and Grogu, Toy Story 5, live-action Moana, and Avengers: Doomsday all on deck.
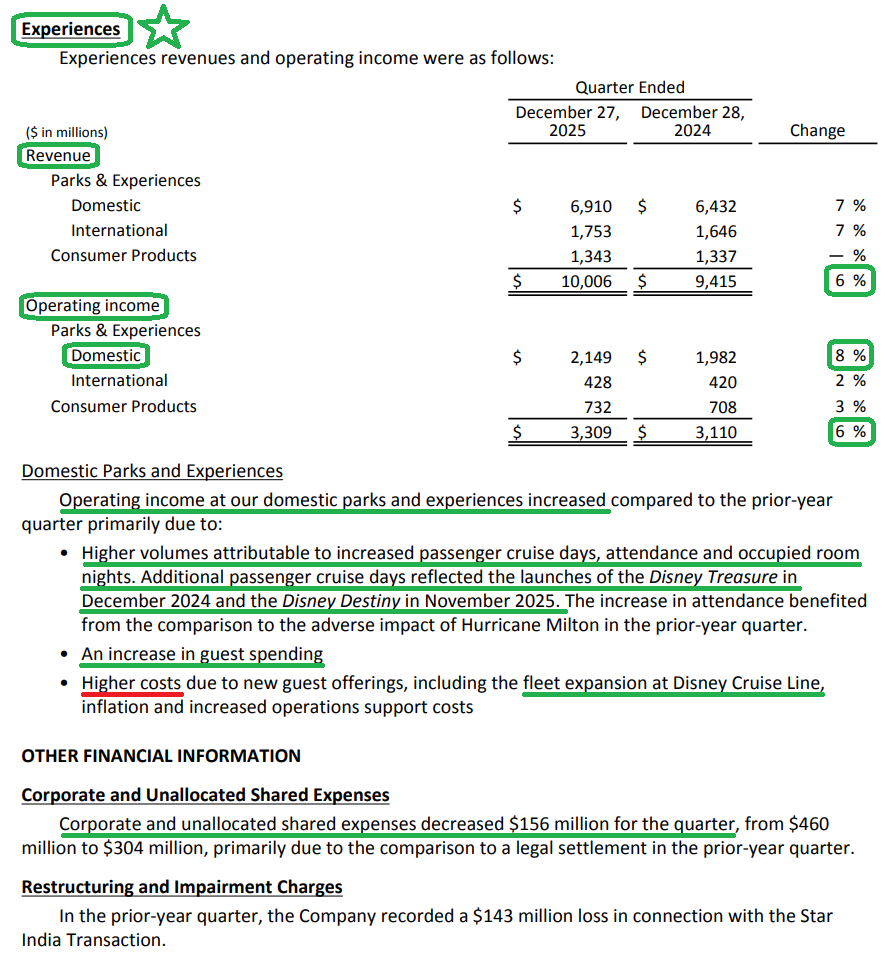
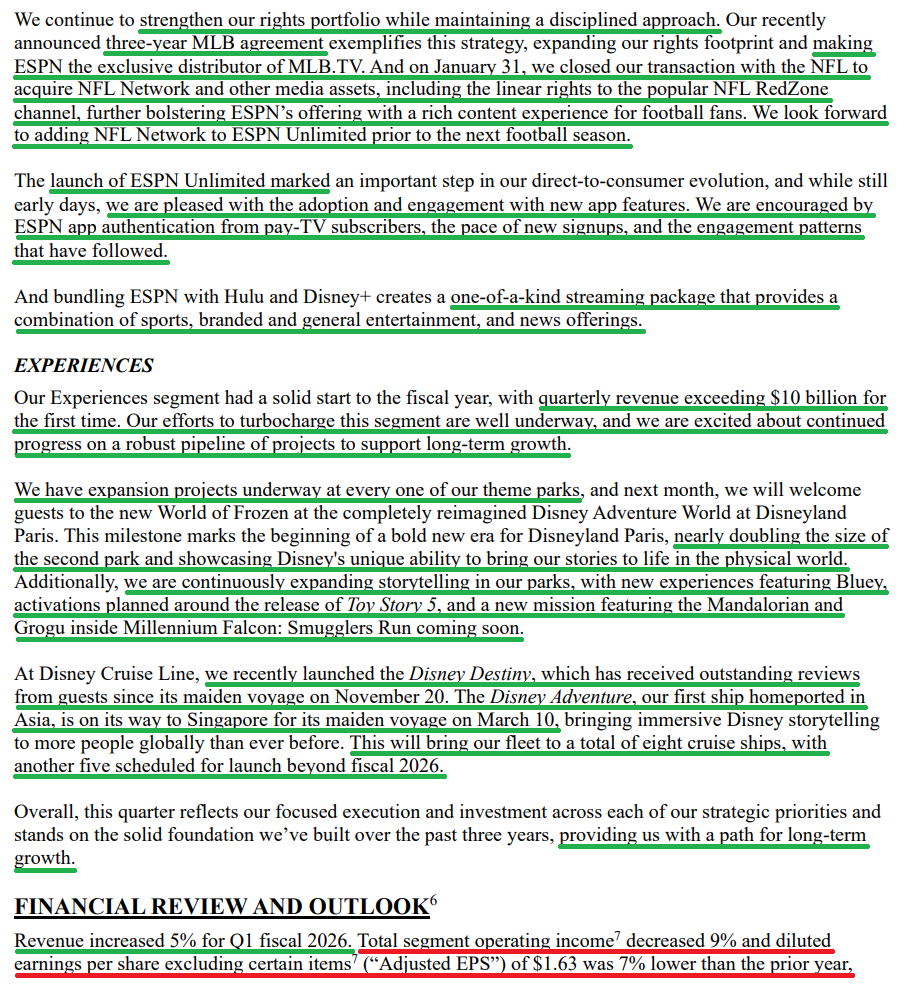
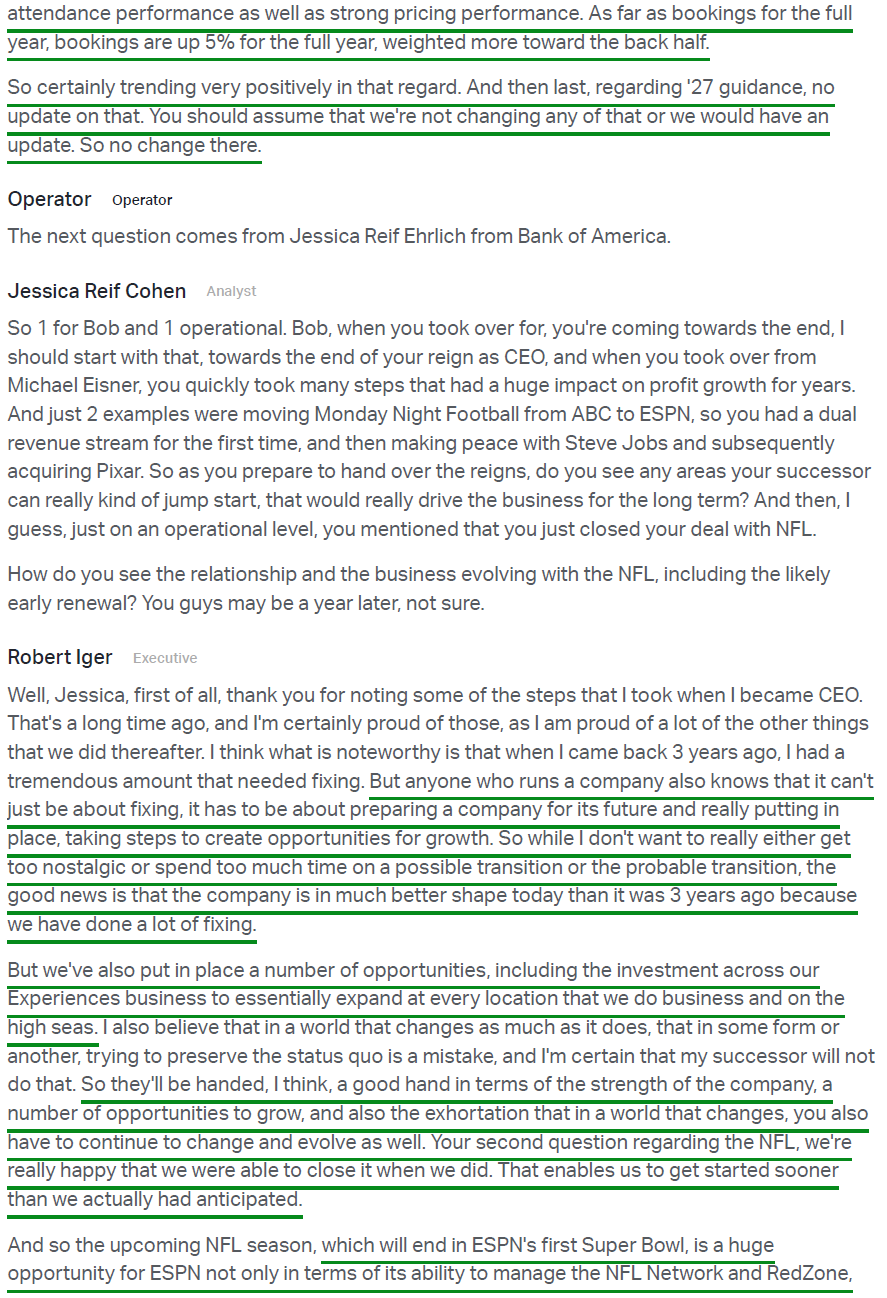
4) The Experiences segment delivered record quarterly revenue of $10.01B (+6% Y/Y) and record operating income of $3.3B (+6% Y/Y), ahead of expectations. Domestic parks, the bread and butter of our core thesis, saw revenue of ~$6.9B (+7%) with operating income up 8%, driven by attendance up 1% and per capita spending up 4%. Forward-looking indicators remain strong, with Walt Disney World room bookings pacing +5% weighted toward the back half. Management expects “modest” Q2 operating income growth due in part to “international visitor headwinds,” which looks like nothing more than cyclical noise to us, with full-year operating income growth still tracking high single digits.
5) Disney’s cruise expansion continues to pay off, with the Disney Destiny launching during the quarter to strong demand and outstanding guest reviews, followed by the more recent launch of Disney Adventure, bringing the total fleet to 8 ships. Five additional ships are scheduled beyond FY2026, setting up cruises as a meaningful contributor to Experiences growth for years to come. While management doesn’t break out the segment separately, they continue to highlight its highly attractive margins and the highest guest satisfaction scores across the entire company, which translates directly into significant pricing power.
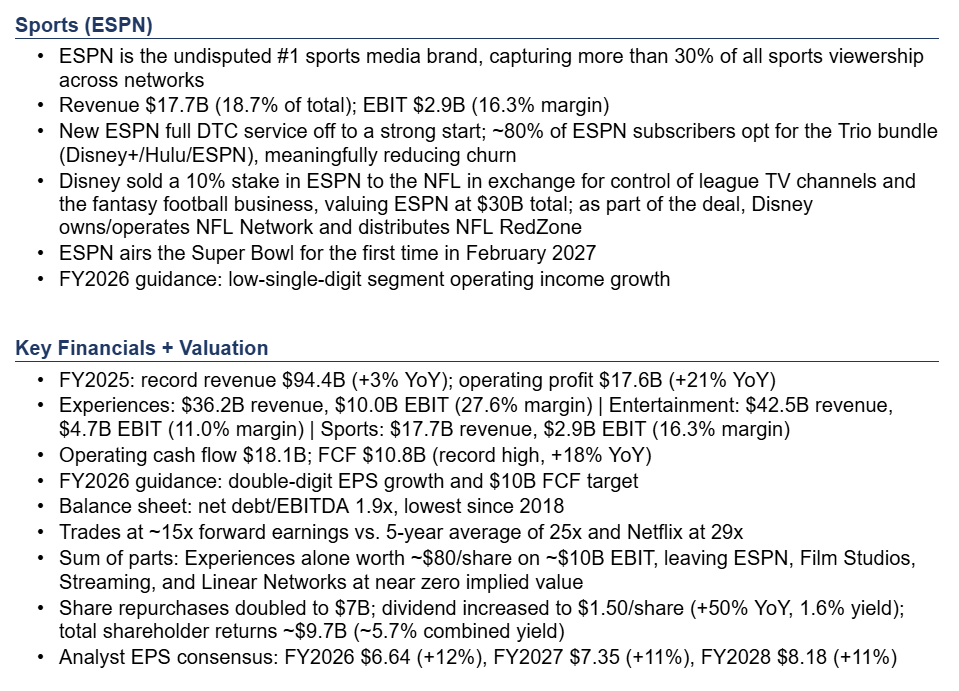
6) ESPN remains the industry leader in sports, capturing >30% of all sports viewership across all networks in Q1. Sports revenue came in at $4.91B (+1% Y/Y), with operating income of $191M (-23% Y/Y), impacted by a $110M hit from a 15-day YouTube TV blackout. The launch of ESPN Unlimited is off to a strong start, with management encouraged by app authentication rates from pay-TV subscribers, the pace of new signups, and engagement patterns. Disney also closed its acquisition of NFL Network, including RedZone and other NFL media assets, with the NFL’s 10% stake in ESPN valued at $3B. The upcoming NFL season will also end in ESPN’s first-ever Super Bowl broadcast, seen as a massive opportunity.
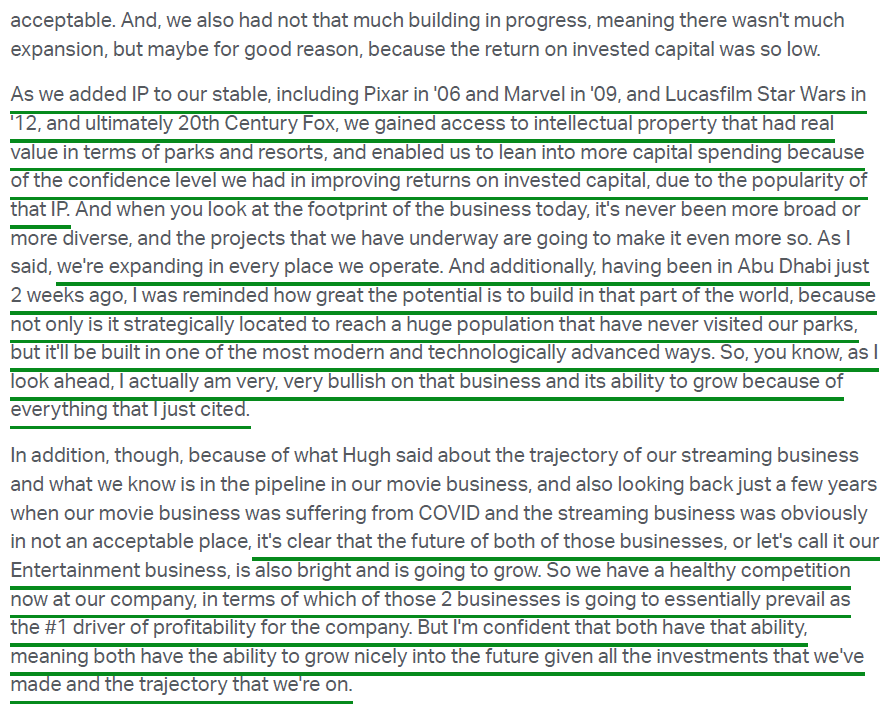
7) Capex during the quarter totaled $3.01B vs. $2.47B last year, with >70% attributable to the domestic Experiences segment. Full-year capex remains on track at $9B for FY2026, driven primarily by cruise ship fleet expansion and new theme park attractions, with expansion projects currently underway at every theme park globally. Returns on invested capital for the Experiences segment remain highly attractive, leading the company across all segments.
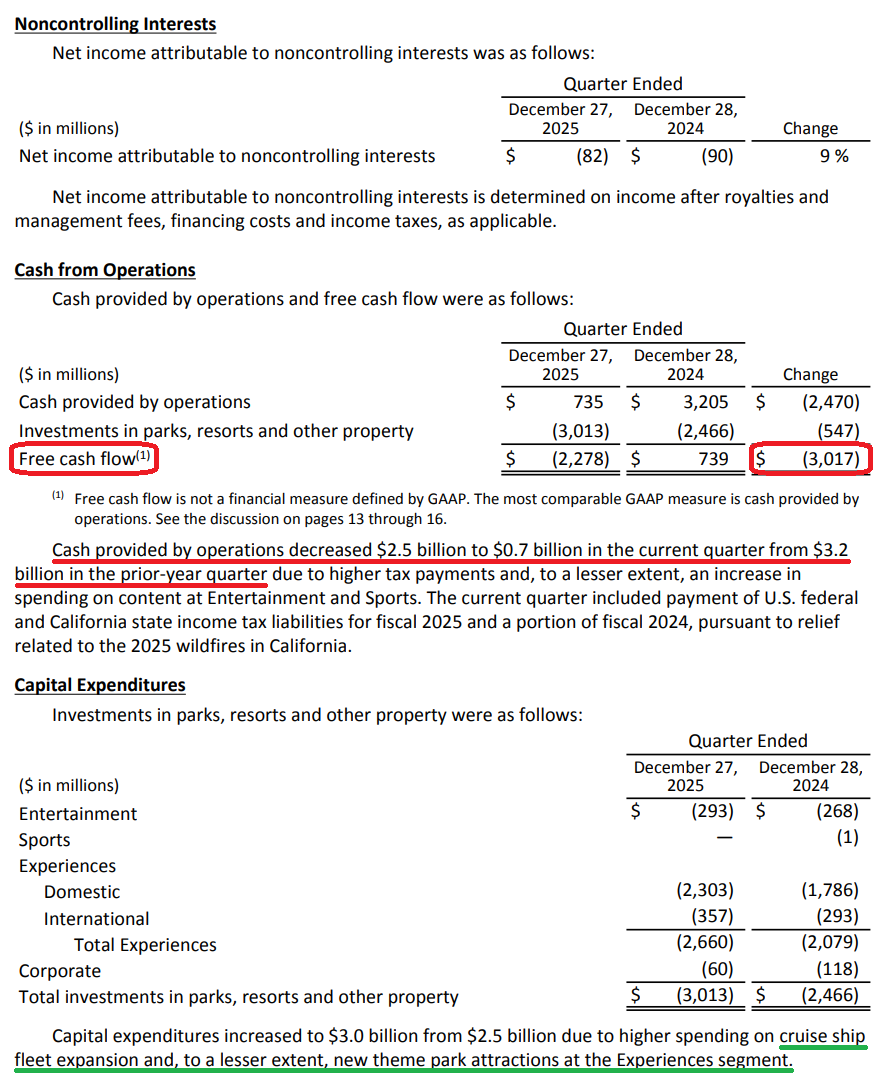
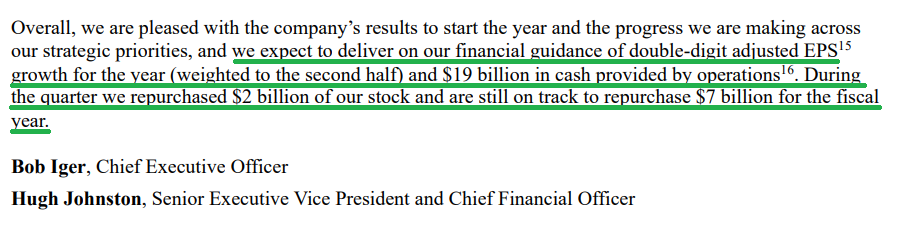
8) Free cash flow was an outflow of $2.28B vs. an inflow of $739M in the prior year period, driven almost entirely by timing-related tax payments relating to CA wildfire relief deferrals. Most importantly, management continues to expect $19B in operating cash flow and ~$10B in FCF for the full year.
9) Management is on track to repurchase $7B worth of stock for the full year (4.1% of market cap), having already bought back $2B during the first quarter. Combined with a dividend of $1.50 per share (~1.6% yield at current prices), total shareholder yield stands at ~5.7%.
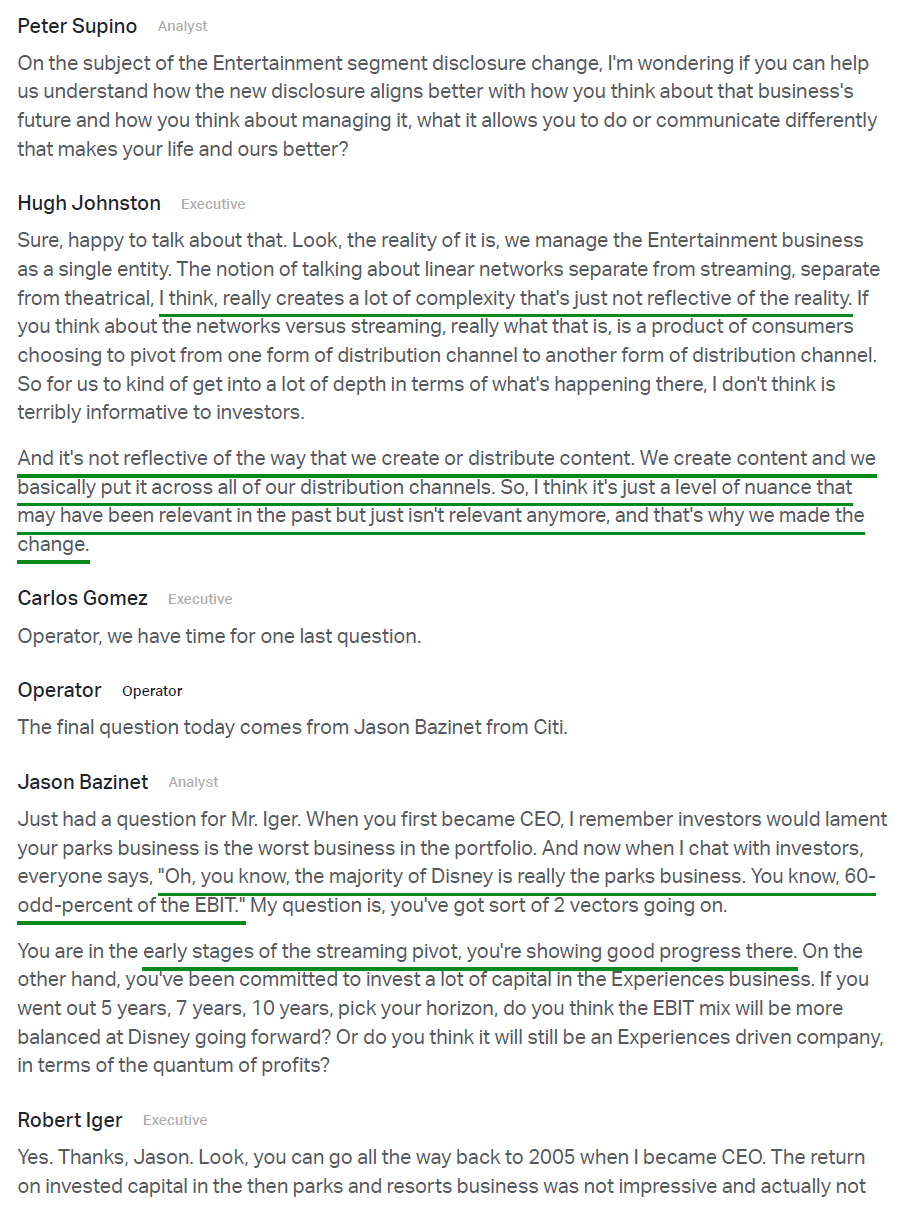
10) Management reiterated confidence in double-digit adjusted EPS growth for FY2026, weighted to the back half of the year, driven by Entertainment operating income growth in the double-digit range, Sports up low single digits, and Experiences up high single digits. The all-important double-digit EPS growth target for FY2027 also remains firmly on track.
Earnings Call Highlights
Morningstar Analyst Note
General Market
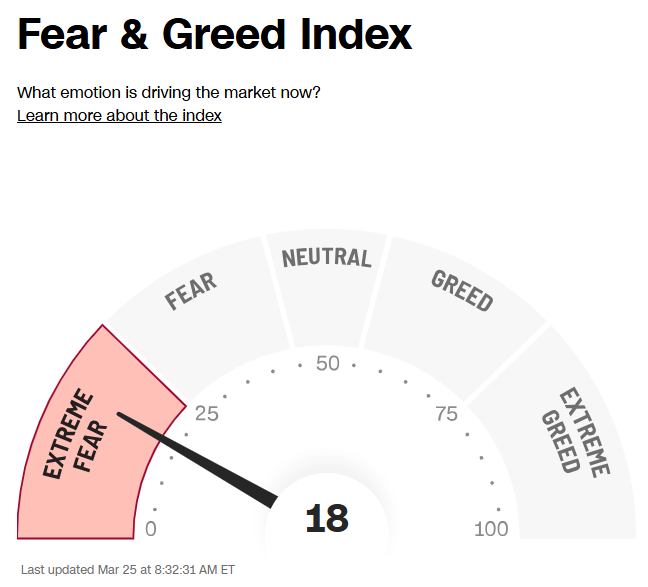
The CNN “Fear and Greed Index” ticked down to 18 this week from 22 last week. You can learn how this indicator is calculated and how it works here: (Video Explanation)
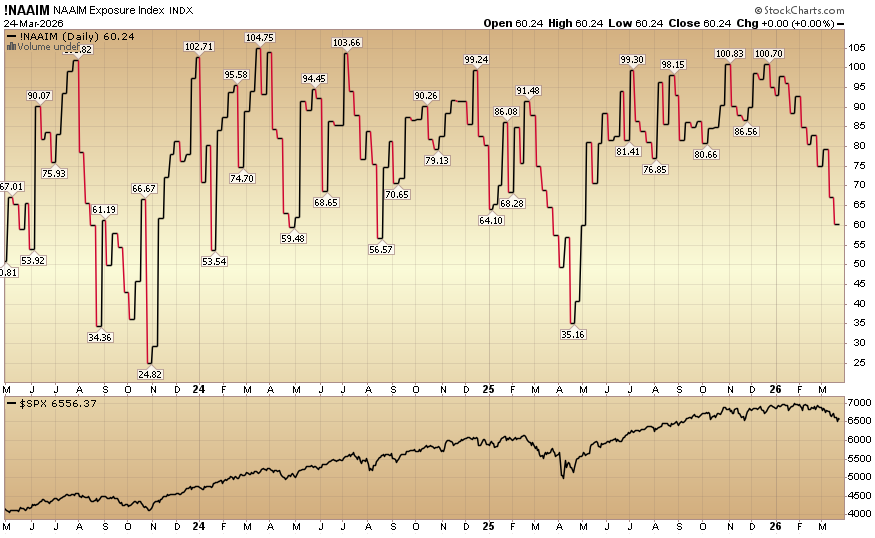
The NAAIM (National Association of Active Investment Managers Index) (Video Explanation) fell to 60.24% equity exposure this week from last week’s 66.99%.
Our podcast|videocast will be out sometime today. We have a lot of great data to cover this week. Each week, we have a segment called “Ask Me Anything (AMA)” where we answer questions sent in by our audience. If you have a question for this week’s episode, please send it in at the contact form here.
Congratulations to all of the new clients that came in intra-quarter (Q1) with larger sized accounts, and to those existing clients who upsized their contributions to their accounts.
We will re-open to smaller accounts $1M+ again starting April 1st.
Those interested in “going-live” on April 1 can begin the on-boarding and application process ahead of time.
To see if you qualify and to take advantage of this opening click here, or go to GreatHillCapital.com for more details. Larger accounts $5-10M+ can access bespoke service anytime here.
Not a solicitation.
*Opinion, Not Advice. See Terms


