

Stanley Black & Decker Update
For newer readers, here’s a brief overview of the key drivers behind our Stanley Black & Decker thesis, the world’s #1 tools company turning the page on a multi-year restructuring and a levered way to play the long-awaited housing recovery:
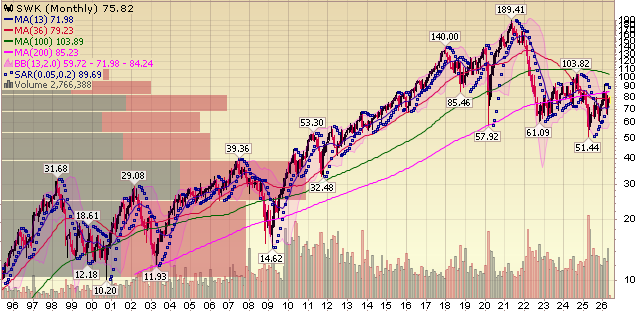
After four years of fixing, SWK is back to building, with the final chapter of its multi-year restructuring now officially closed.
Like several other high-quality names in our portfolio, SWK was caught offsides in the post-pandemic destock-restock cycle, left with bloated inventories and an overleveraged balance sheet just as rates ripped higher and the housing market ground to a halt. Gross margins (the #1 metric in the turnaround story) collapsed to 19.5% in Q4 2022, far below the historical mid-30% range, while net leverage peaked at 5.9x following an ill-timed acquisition heading into the slowdown.
In response, management has spent the past several years playing defense, executing a $2B Global Cost Reduction Program launched in mid-2022, complemented by a steady stream of non-core divestitures to repair the balance sheet. Four years later, the heavy lifting is complete. The cost program closed out at $2.1B in run-rate pre-tax savings (well over $13/share), and the final major step came on April 6 with the $1.8B sale of Consolidated Aerospace Manufacturing (CAM) to Howmet Aerospace. The all-cash deal closed ahead of the original H1 2026 timeline, generating ~$1.57B in net proceeds, with the vast majority already applied to debt reduction in Q2 and putting SWK well on track to finish the year at a comfortable ~2.5x net leverage.
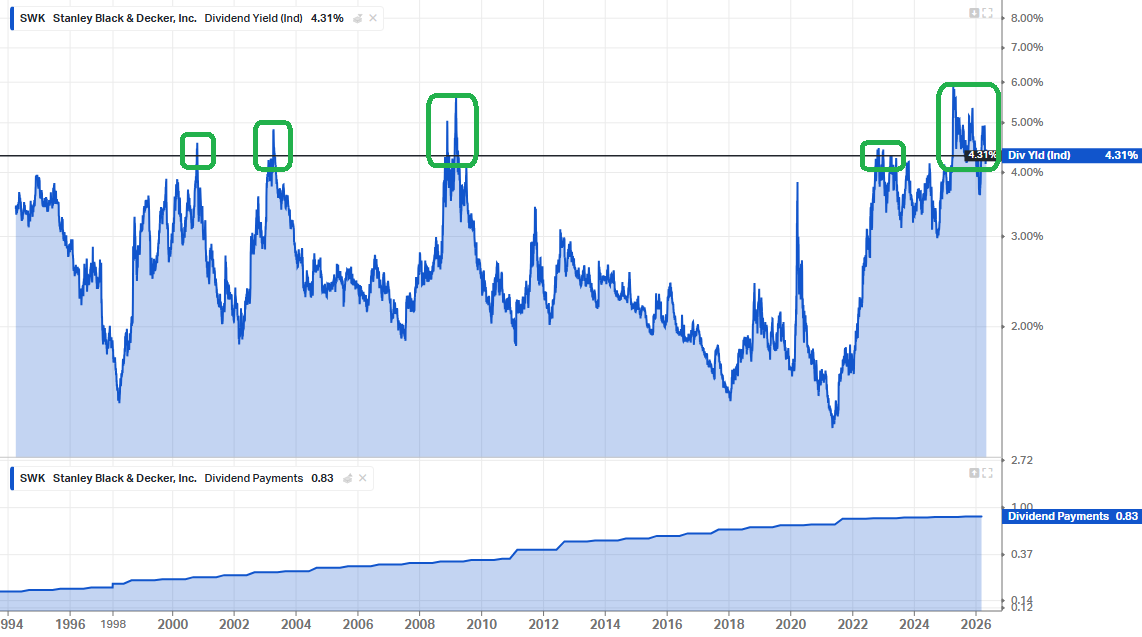
Now that the balance sheet overhang is in the rearview mirror, management wasted no time rewarding shareholders and pivoting back to retiring cheap shares. The Board authorized a new $500M share repurchase program (~4% of market cap), with capital allocation now firmly biased toward buybacks going forward. On top of that is a forward dividend yield of ~4.3%, a level shareholders have only had the opportunity to lock in on four other occasions over the past 30+ years. The dividend itself has been paid for 149 consecutive years (the longest streak of any industrial company on the NYSE) and raised in each of the past 58. Add it all up and shareholders are being paid handsomely to wait, and that’s before any share price appreciation, which we expect plenty of over time.
With the foundation repaired, the focus shifts back to where it should be: margin expansion and accelerating organic growth, both of which remain on track to inflect higher through 2026.
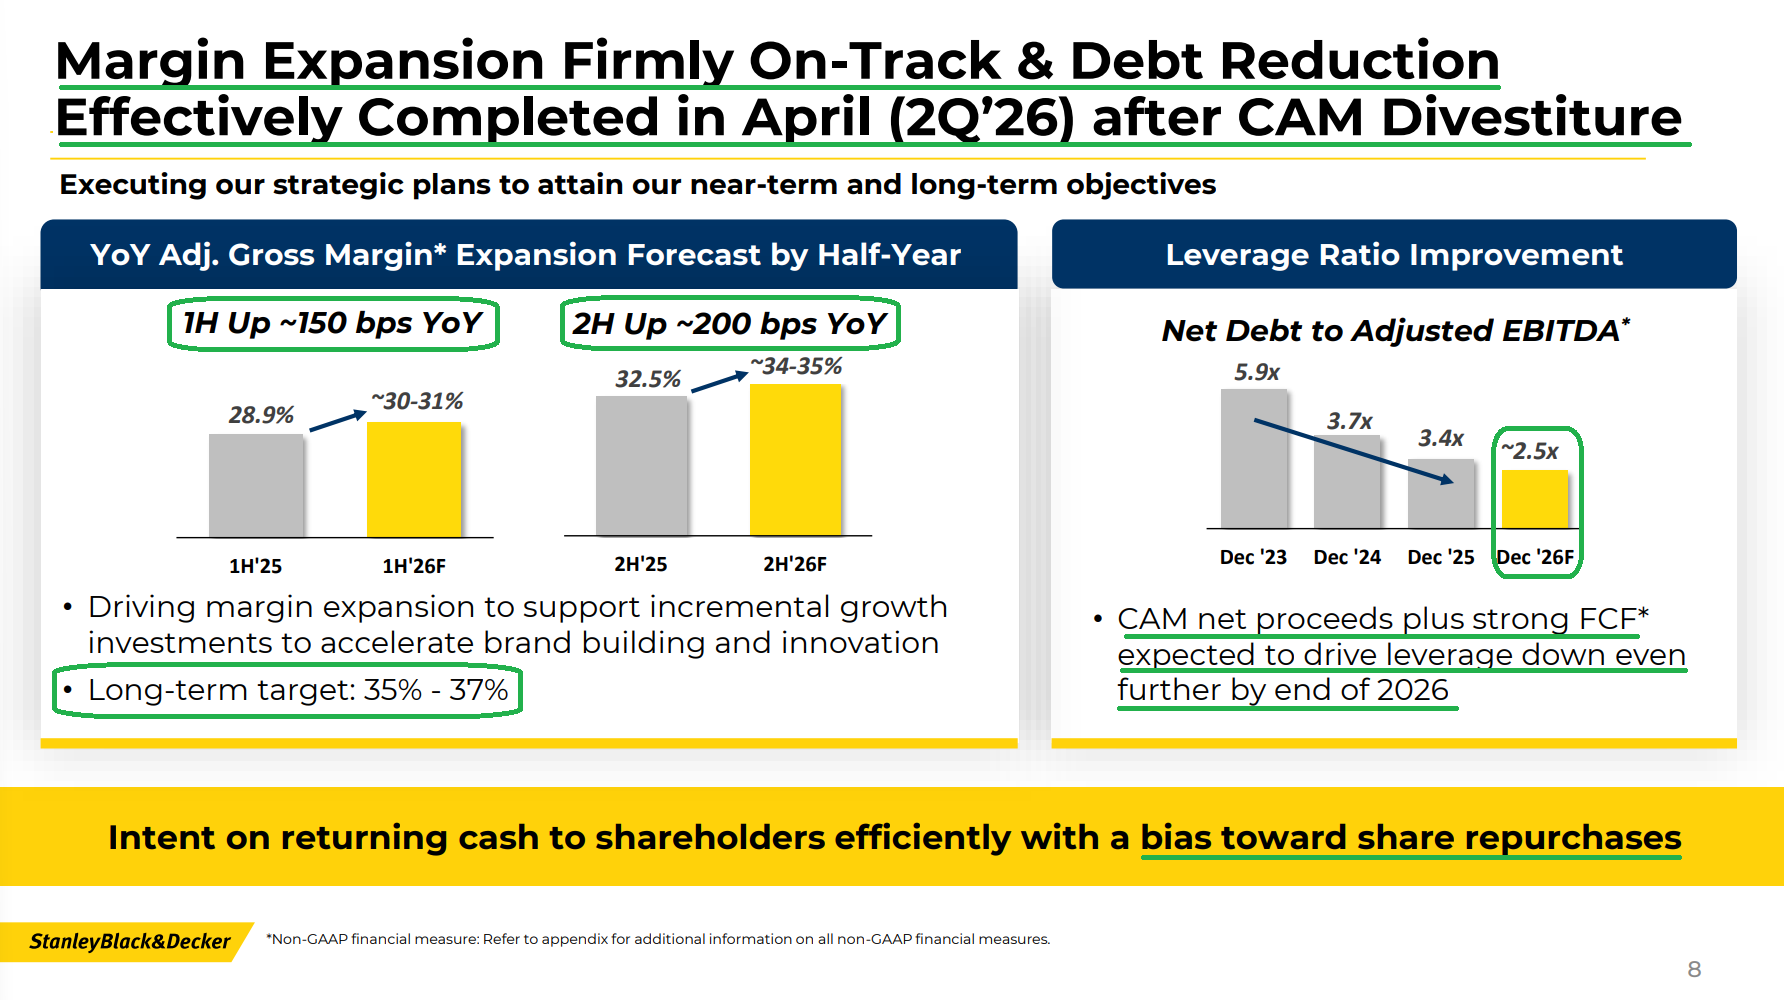
Q1 adjusted gross margin of 30.2% came in line with expectations, with management guiding to ~150 bps of Y/Y expansion in 1H and ~200 bps in 2H, keeping the path to a 35%+ run rate by year end and the 35-37% long-term target by 2028 firmly intact. For context, the last time this business posted gross margins north of 35% was 2018, when EPS was $8.15 and the stock traded above $150.
On the top line, management continues to expect FY2026 organic growth in the low single digits. That would mark the first full year of positive organic growth since 2021, despite an end market that is still expected to be flat to slightly down. In plain English, that means taking share.
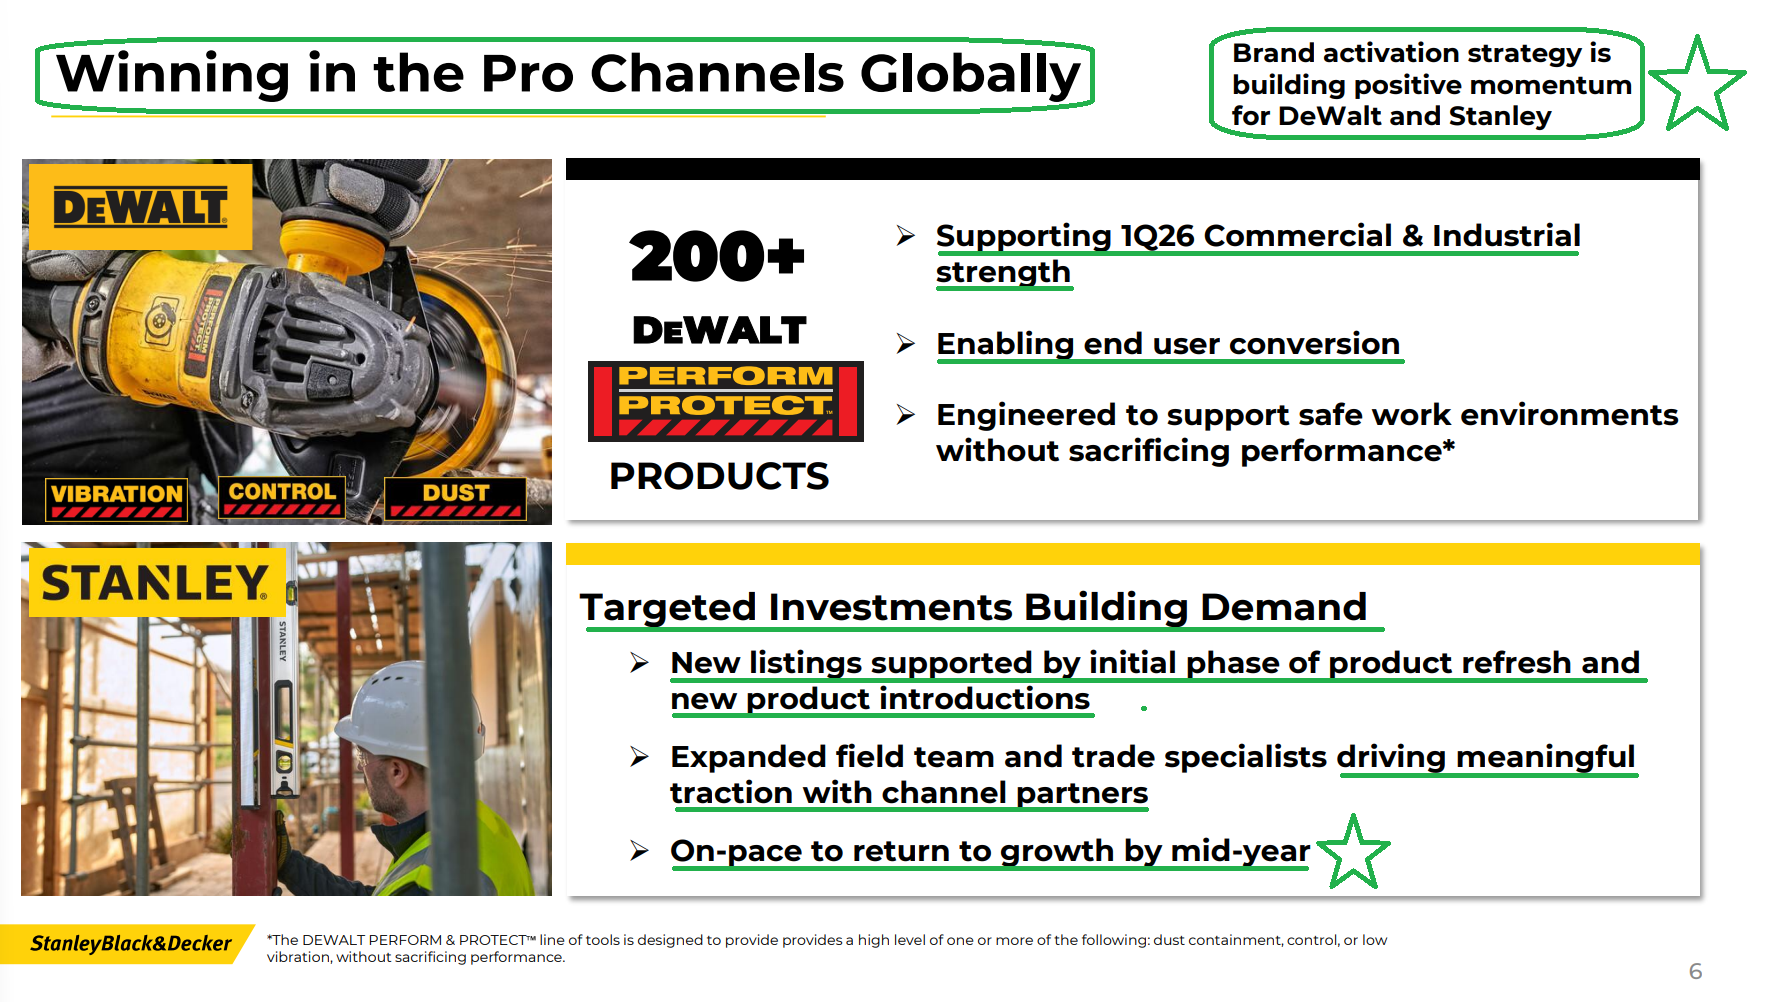
The engine driving the inflection is DEWALT, the $7B+ pro-focused franchise that once again delivered in Q1 and helped drive high-single-digit organic growth in the commercial and industrial channel. Meanwhile, the long-awaited inflection in STANLEY remains on track to turn positive by mid-year, while DIY-focused CRAFTSMAN is set to benefit from momentum around its largest product launch cycle since SWK acquired the brand in 2017.
The kicker is that all of this growth and margin expansion is unfolding before the housing cycle even turns, a testament to world-class execution in a tough operating environment.
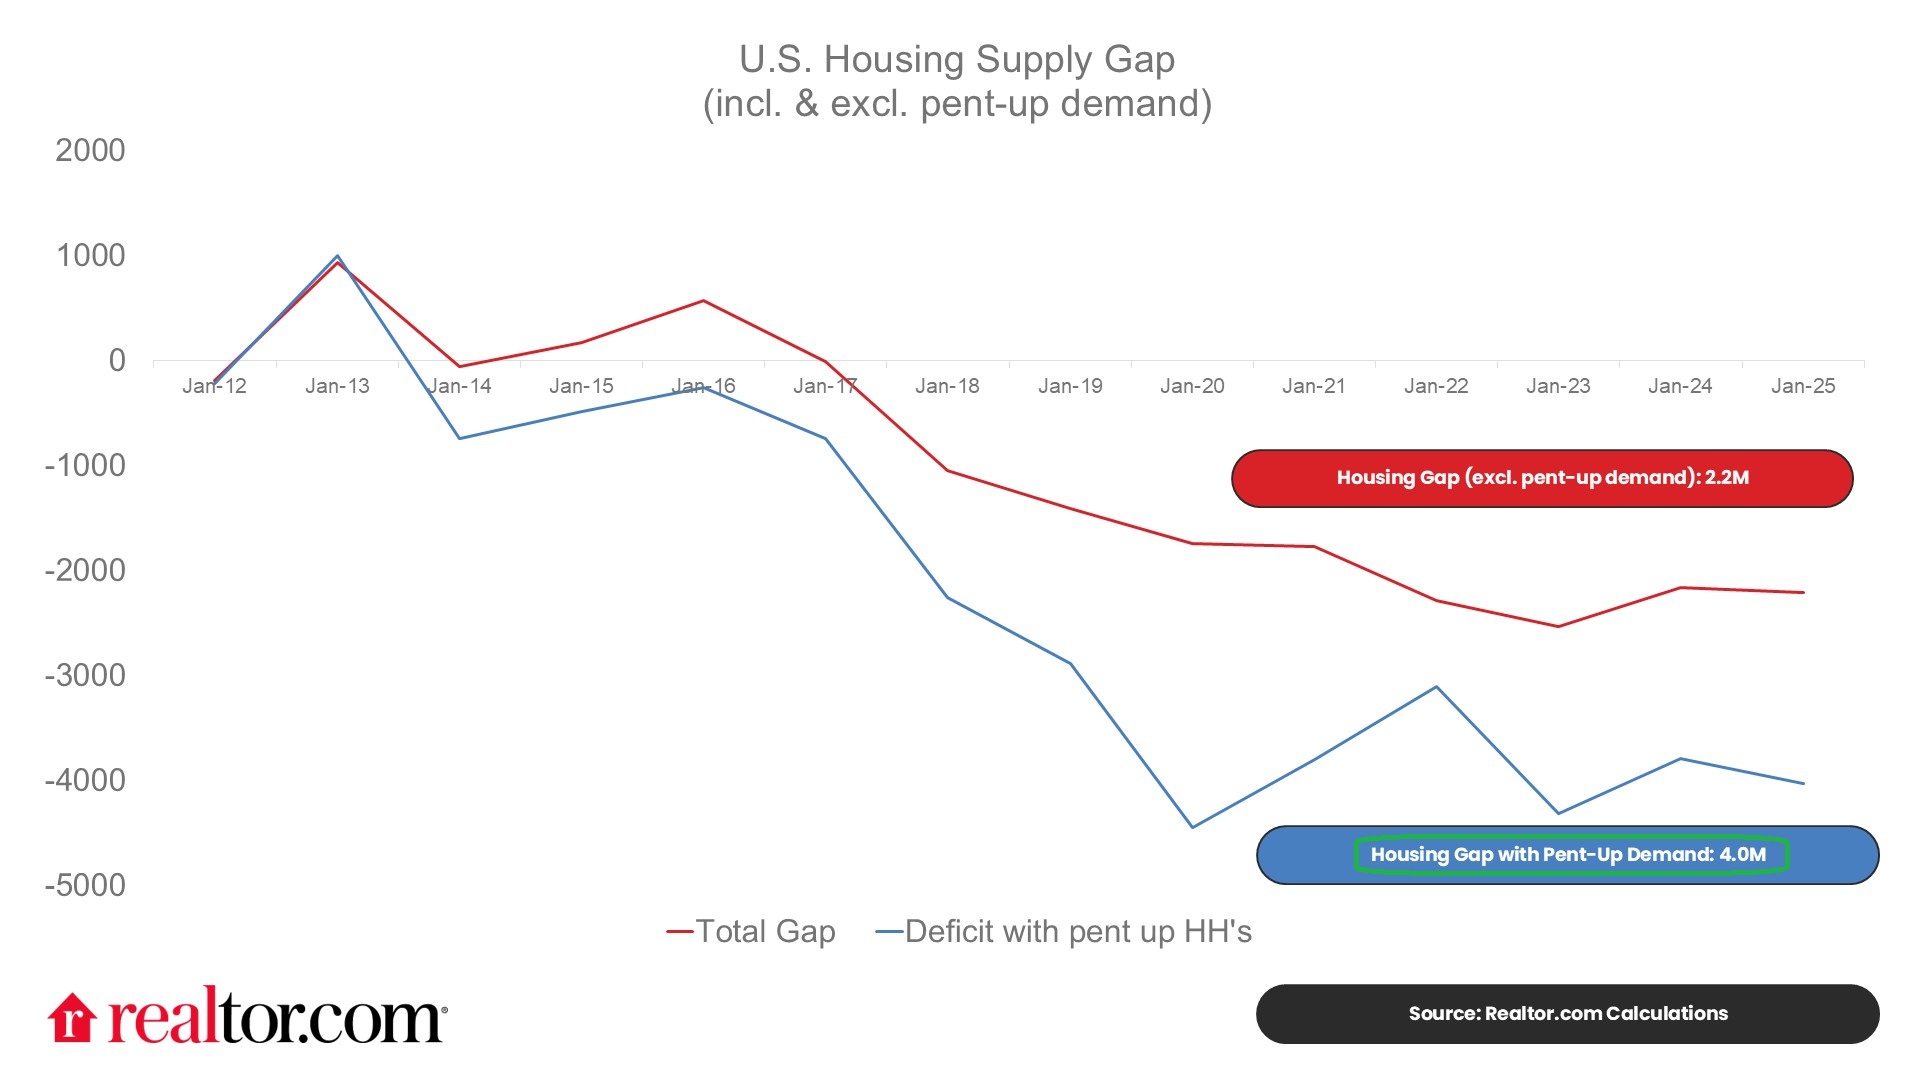
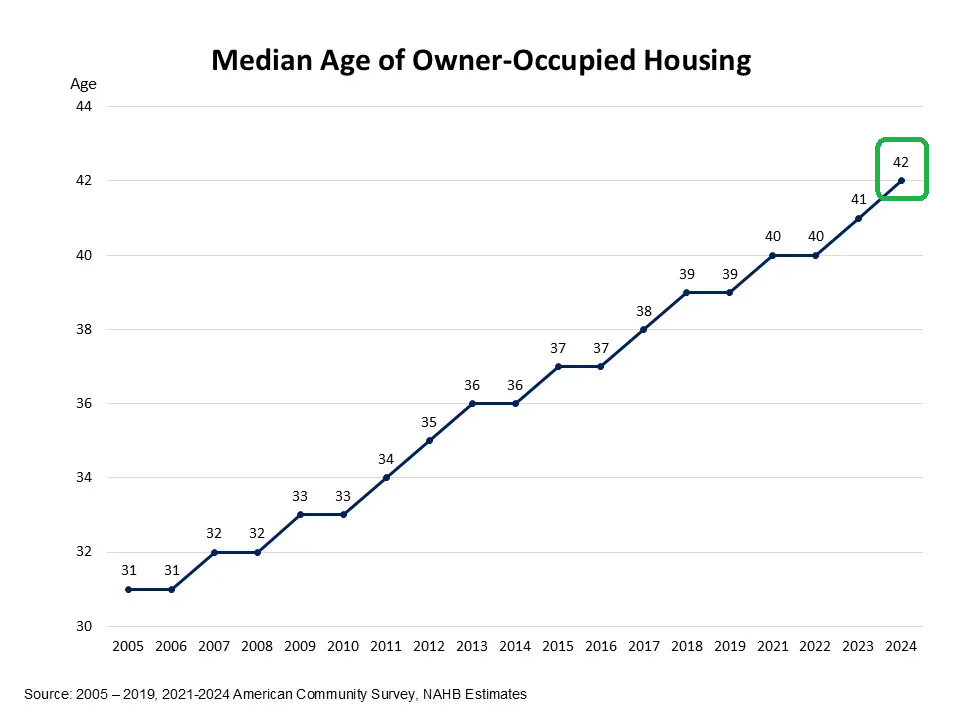
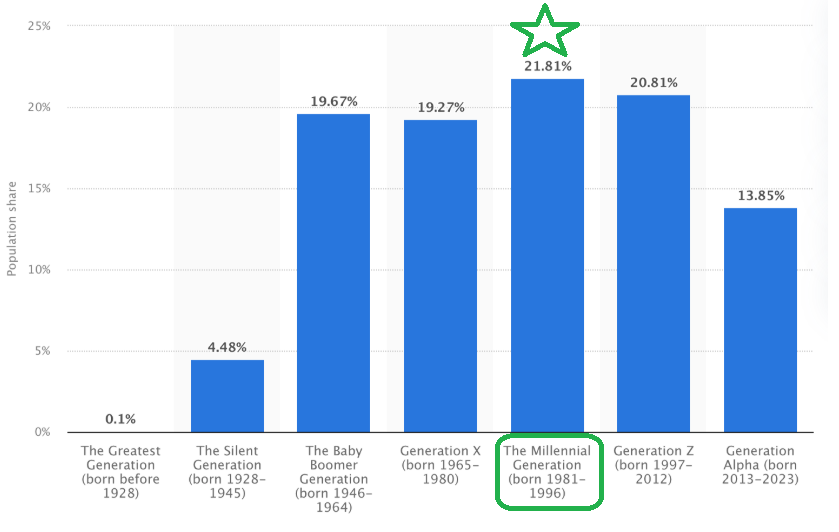
Once the cycle does turn, SWK is sitting on a coiled spring of operating leverage, with upwards of ~45% of total company sales tied directly to residential construction. With shares still down ~60% from 2021 highs and trading at just ~12x forward earnings versus a 20-year average of ~18x, the market continues to overlook what we view as a beach ball of pent-up housing demand waiting to break free. When rates eventually come down and the structural tailwinds we’ve consistently pointed to (~4M unit housing shortage, significantly aged housing stock >40 years, 70M+ millennials entering peak family formation years) finally materialize, SWK should emerge as one of the biggest arms dealer beneficiaries.
Until then, SWK remains one of our favorite overlooked ways to play the theme. After four years of fixing the foundation, the world’s #1 tools company is finally back to building.
Q1 Earnings Breakdown
10 Key Points
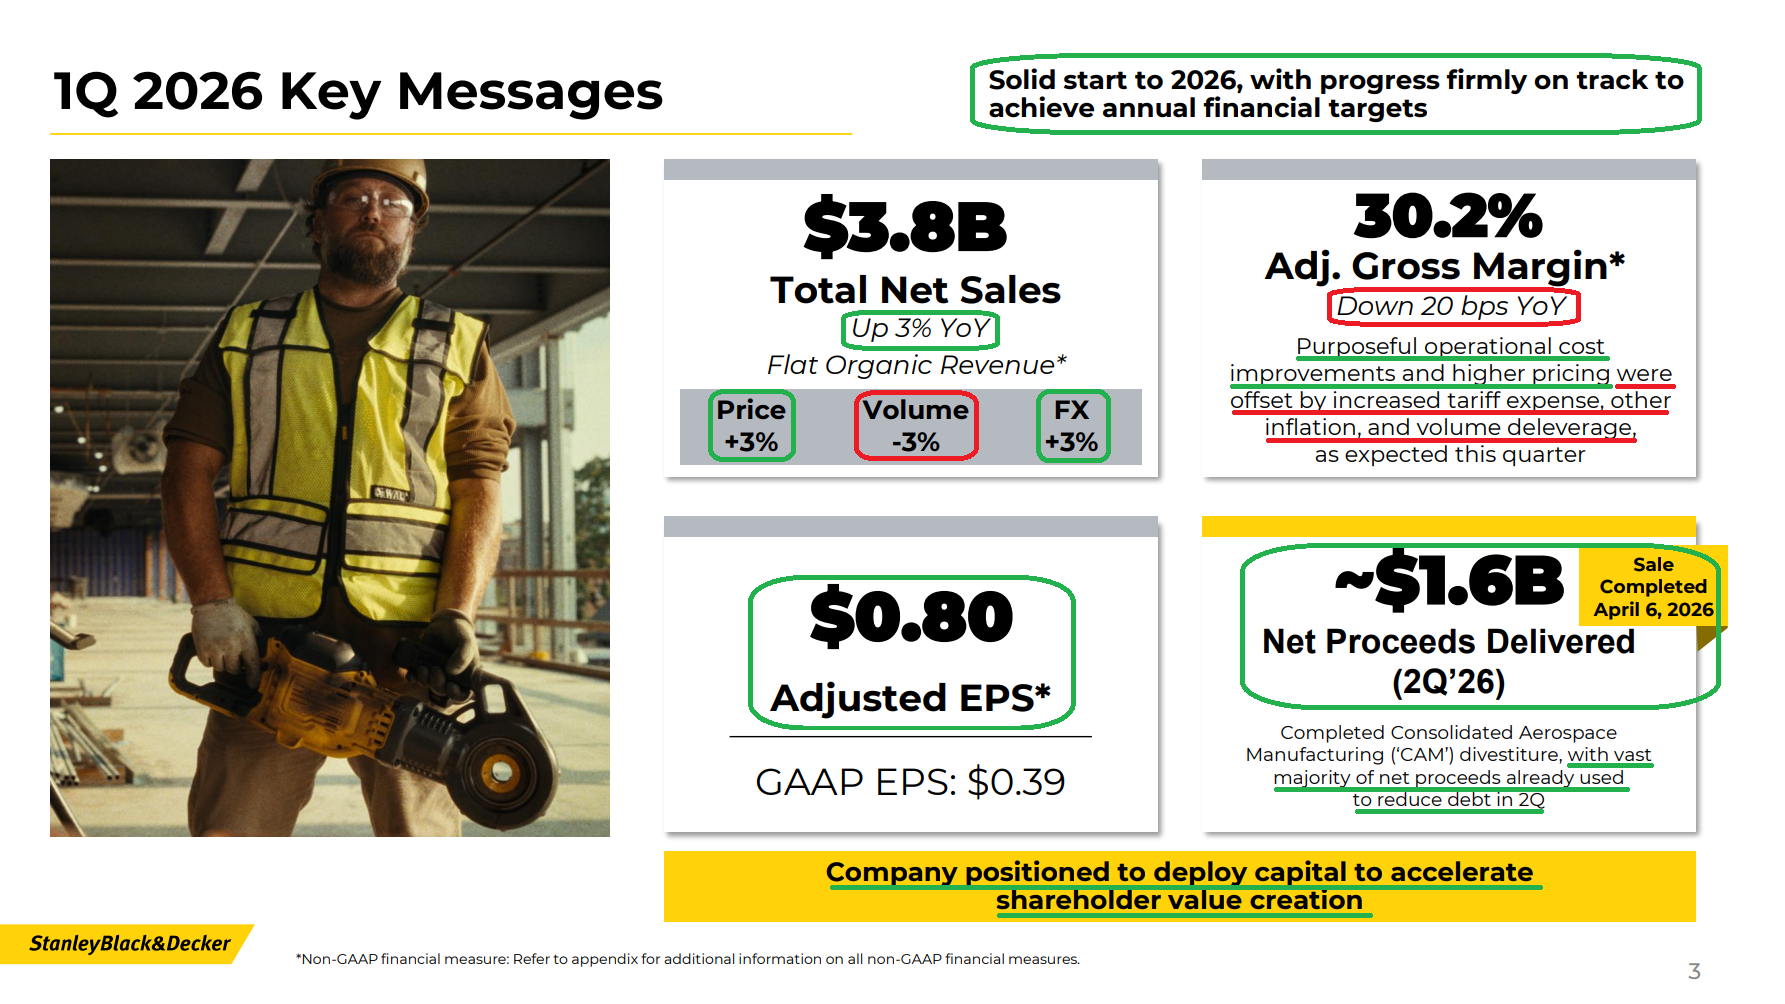
1) SWK reported Q1 revenue of $3.85B (+2.9% reported, flat organic), beating consensus of $3.75B by ~$100M, as higher pricing (+3%) and currency tailwinds (+3%) offset volume declines (-3%) driven primarily by retail softness in North America. Adjusted EPS of $0.80 came in well ahead of consensus of $0.59 and $0.20 above the high end of prior Q1 guidance of $0.55 to $0.60, with roughly half of the outperformance driven by above-the-line operating strength (led by Outdoor) and the remainder from below-the-line items (mainly tax timing).
2) Adjusted gross margin (the #1 metric in the SWK turnaround) came in at 30.2% in Q1, down 20 bps Y/Y and in line with expectations, as operational cost improvements and higher pricing were largely offset by increased tariff expense, volume deleverage, and other inflation. Management expects ~150 bps of Y/Y expansion in 1H and ~200 bps in 2H, implying 2H adjusted gross margins of 34 to 35% and maintaining a clear path to a 35%+ exit rate by Q4 2026. The long-term target of 35 to 37% by the end of 2028 remains unchanged.
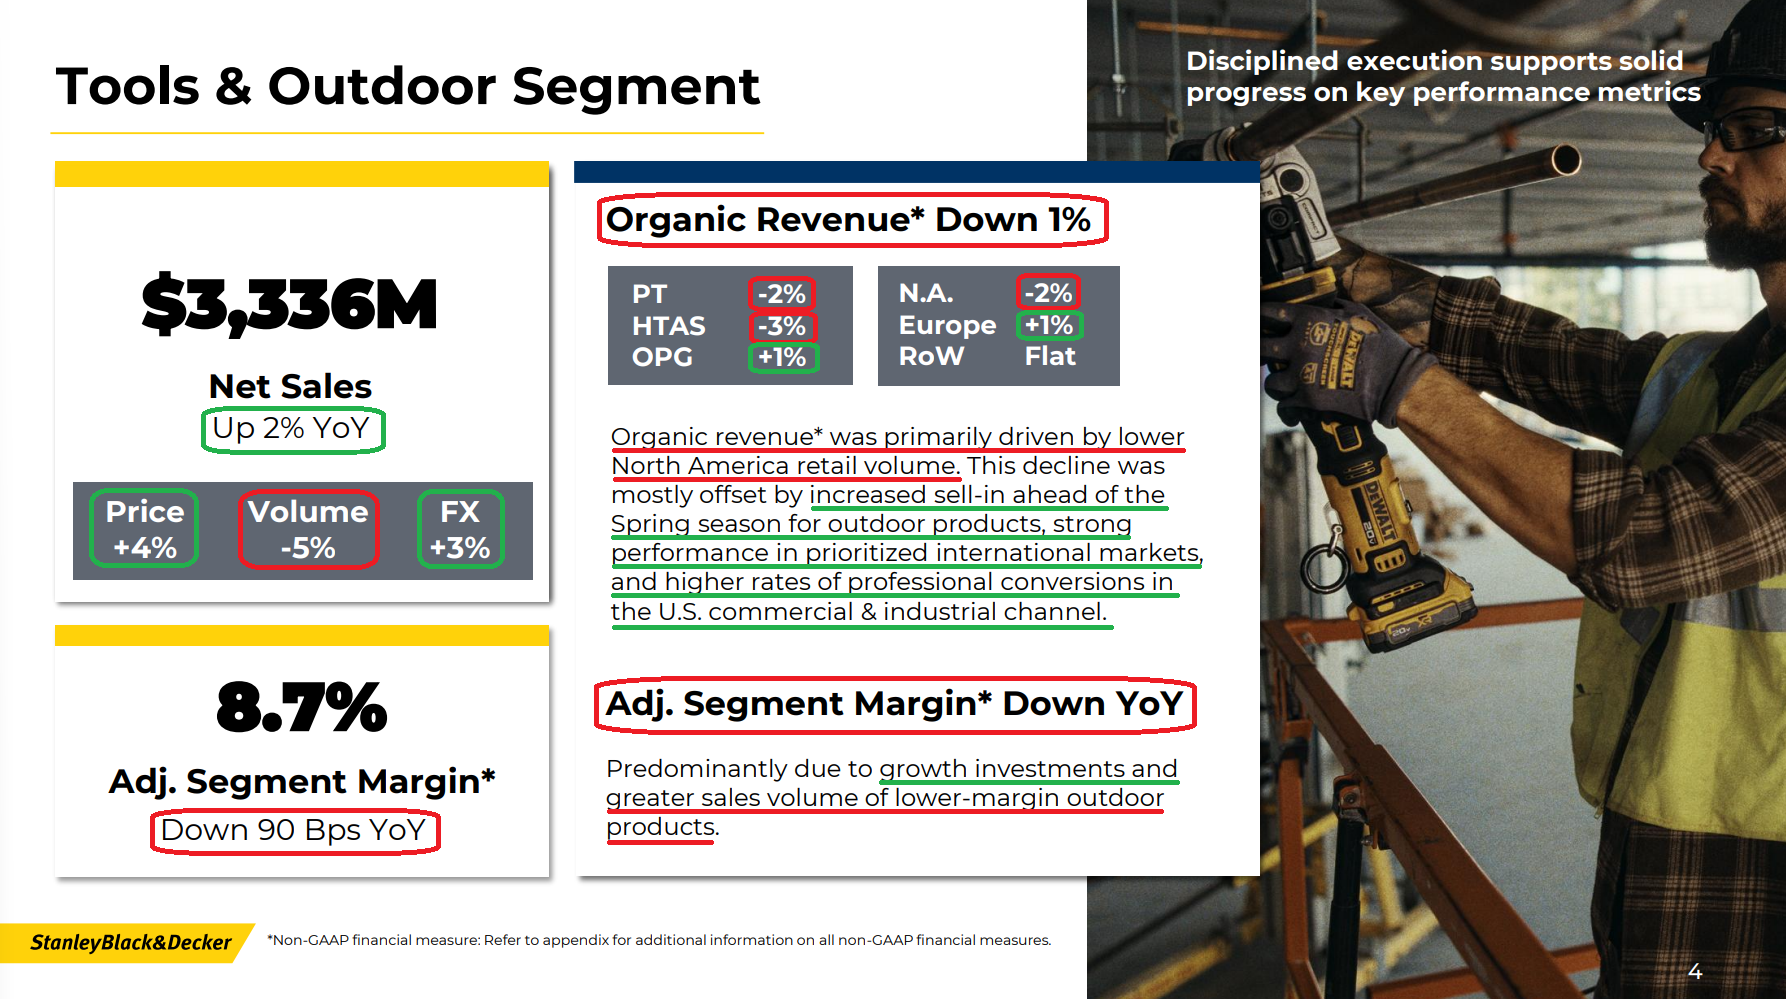
3) The Tools & Outdoor segment (87% of total sales) posted Q1 net sales of $3.34B (+2% reported, -1% organic), as higher pricing (+4%) and currency tailwinds (+3%) were partially offset by volume declines (-5%). North America organic declined 2%, Europe grew 1%, and Rest of World was flat. By category, Outdoor organic grew 1% on encouraging spring preseason sell-in, while Power Tools declined 2% and hand tools, storage, and accessories declined 3%. The U.S. commercial and industrial channel remained a bright spot, delivering high-single-digit organic growth driven by DEWALT brand investments and strength with professional end users. STANLEY remains on pace to inflect to growth by mid-year, while the CRAFTSMAN relaunch, the largest since SWK acquired the brand in 2017, is expected to build momentum through year-end and into 2027. Adjusted segment margin of 8.7% declined 90 bps Y/Y but came in line with expectations, reflecting growth investments and a higher mix of lower-margin outdoor products.
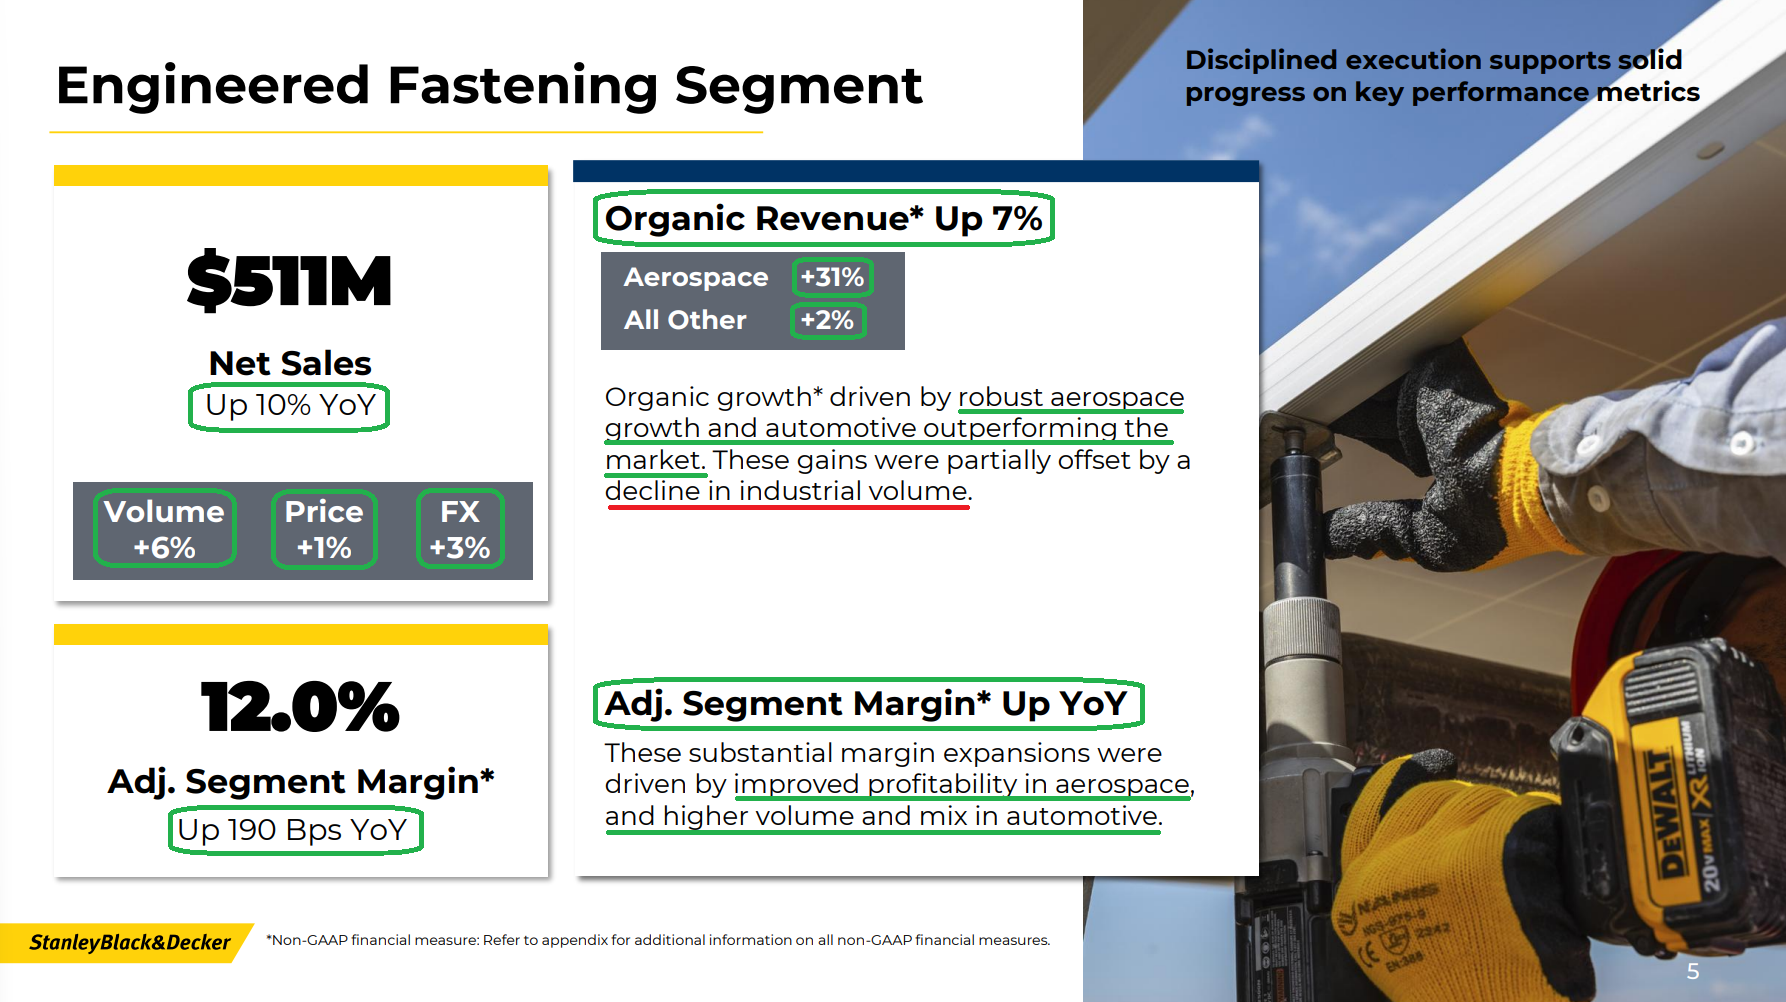
4) The Engineered Fastening segment (13% of total sales) posted Q1 net sales of $511M (+10% reported, +7% organic), driven by higher volume (+6%), pricing (+1%), and currency tailwinds (+3%). Aerospace led with organic growth of +31%, while automotive grew +4% (outpacing the market) on strong North American demand and global fastener systems for auto OEMs, partially offset by a low-single-digit decline in general industrial. Adjusted segment margin of 12.0% (+190 bps Y/Y) was driven by improved aerospace profitability and favorable automotive volume and mix. For FY26, management now expects low to mid-single-digit organic growth, slightly below prior guidance due to just one quarter of CAM contribution rather than two.
5) SWK closed the $1.8B sale of Consolidated Aerospace Manufacturing (CAM) to Howmet Aerospace on April 6, ahead of the prior H1 2026 timeline, generating ~$1.57B in net proceeds. The majority of proceeds have already been applied to debt reduction in Q2, marking the final phase of the multi-year restructuring and shifting focus toward returning cash to shareholders.
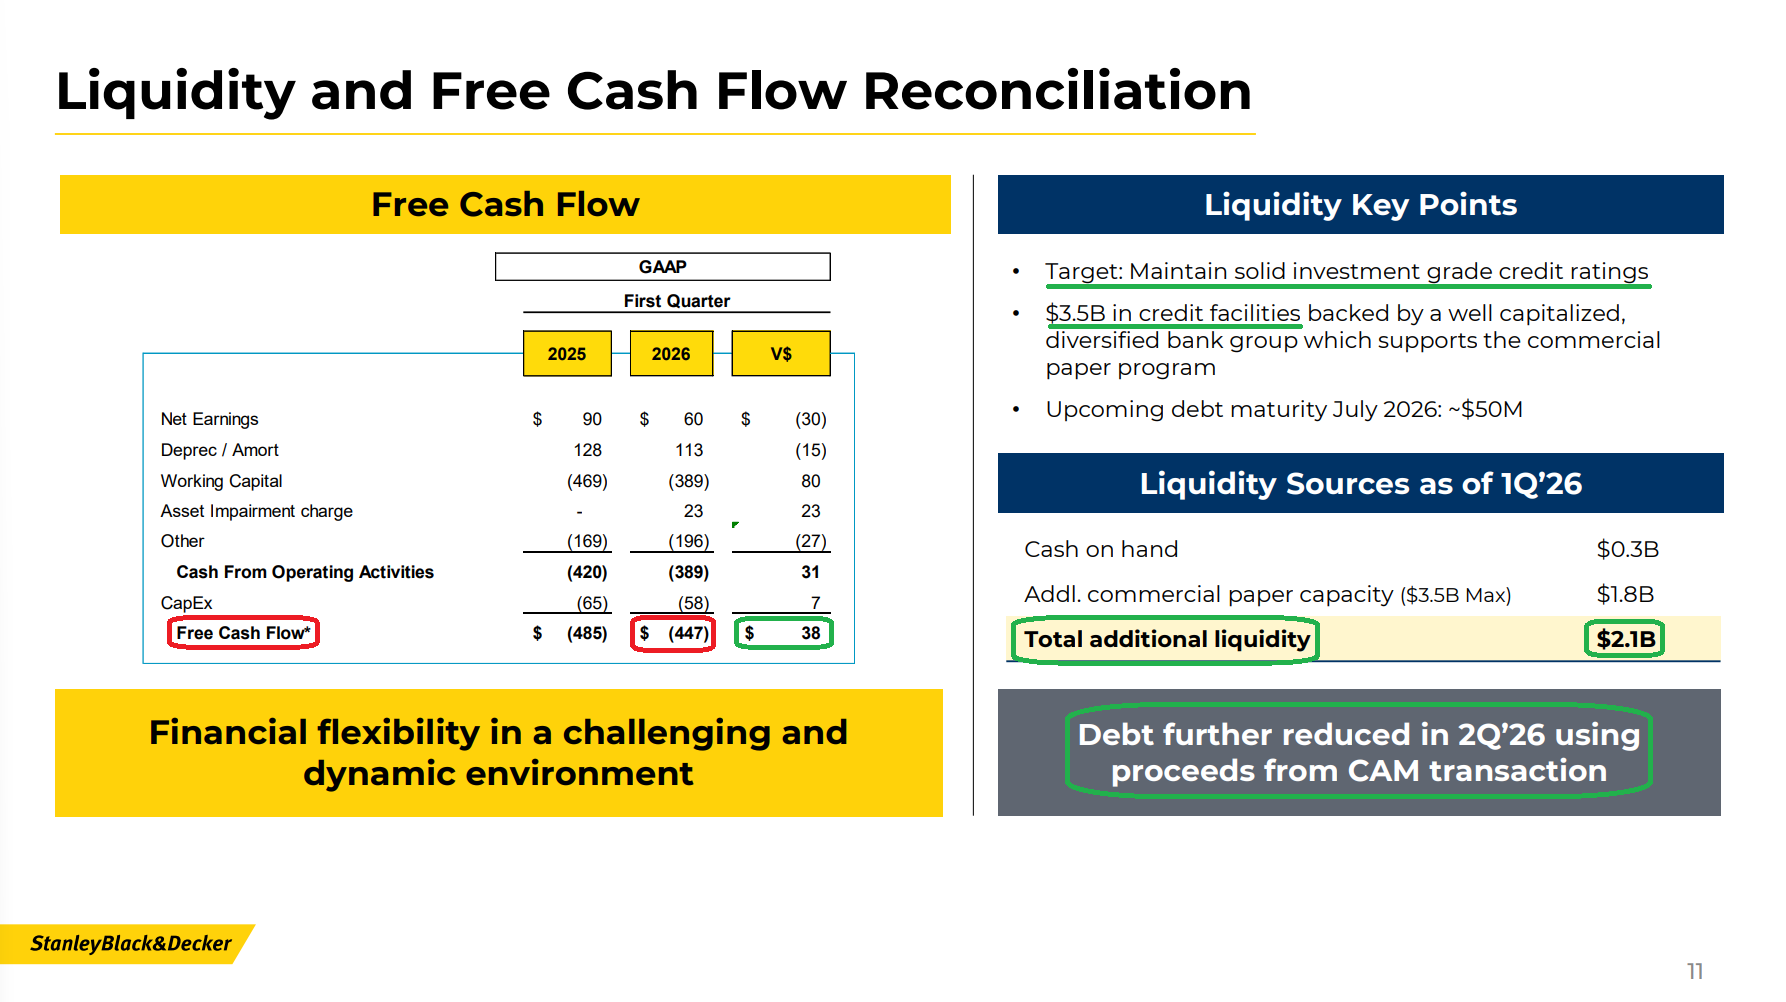
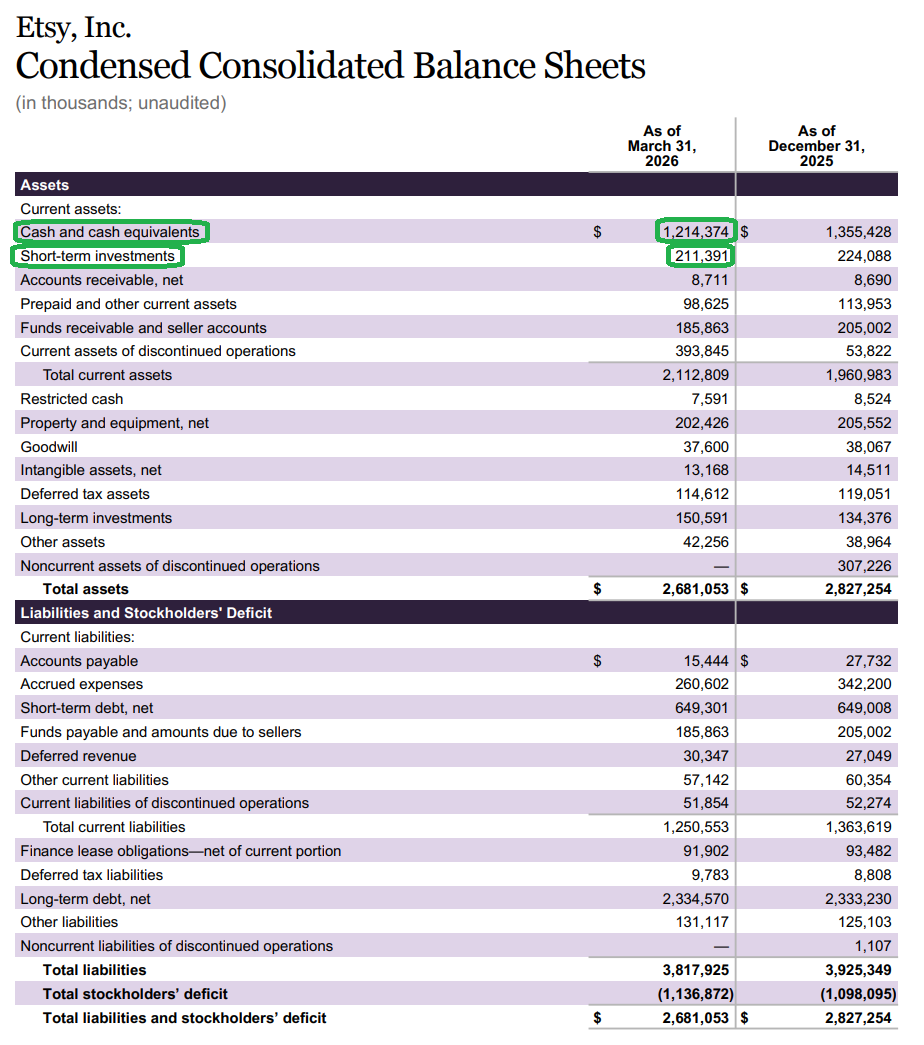
6) Management continues to make progress on the balance sheet, with SWK on track to finish the year at ~2.5x net debt to adjusted EBITDA, down from 5.9x at the end of 2023. SWK ended Q1 with $333M in cash, $4.7B in long-term debt, and $2.1B in total liquidity (including $1.8B in additional commercial paper capacity against $3.5B in credit facilities). Maintaining a solid investment-grade credit rating remains a top priority.
7) The Board authorized a new $500M share repurchase program (~4% of market cap), with capital allocation now tilted toward buybacks. Combined with the existing ~4.3% dividend yield, which SWK has paid out for 149 consecutive years (the longest streak of any industrial company on the NYSE) and raised for 58 straight years, shareholders are being paid handsomely to wait.
8) Free cash flow was an outflow of $447M in Q1, an improvement of $38M Y/Y and consistent with normal seasonal patterns. For FY26, management expects $500M to $700M in FCF including CAM-related taxes and fees, or $700M to $900M excluding them (consistent with prior guidance). Improving free cash flow remains a key priority, with the CAM divestiture reducing working capital intensity and continued inventory normalization providing additional tailwinds.
9) Management continues to execute against its tariff mitigation strategy and remains ahead of plan on both USMCA qualification and reducing China sourcing. SWK is on pace to source <5% of U.S. sales from China by year-end (down from ~20%) and to reach at or above industry-average USMCA-qualified import mix, positioning the company at parity to slightly advantaged versus competitors. Recent policy changes are expected to create a gross tariff tailwind in FY26 versus prior assumptions, though inflation in resins, freight, battery metals, and tungsten is expected to largely offset the benefit on a net basis. The base case assumes new Section 301 tariffs at prior IEEPA levels by August, with incremental Section 232 headwinds limited to ~$15M annualized and <$10M in 2026.
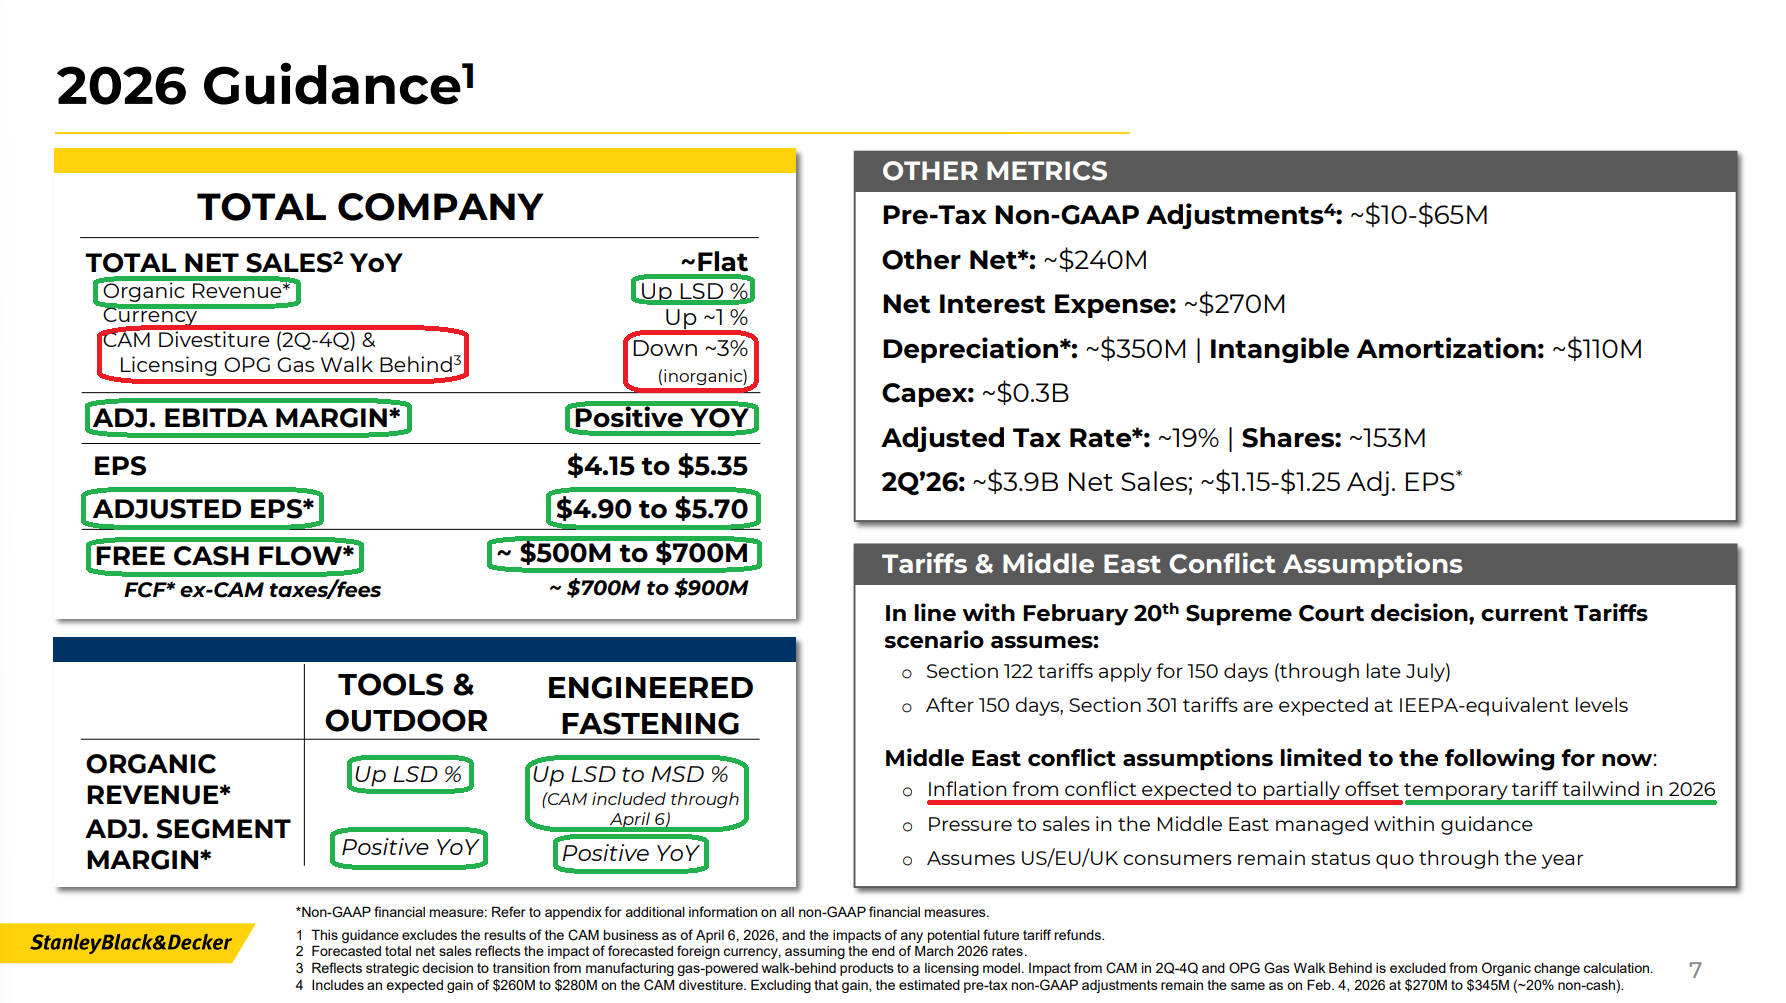
10) SWK reaffirmed FY26 adjusted EPS guidance of $4.90 to $5.70, with the midpoint implying +13% Y/Y growth and ahead of pre-print consensus of $5.21. Total revenue is now expected to be roughly flat Y/Y (slightly below prior due to the early CAM close), with organic revenue still expected to grow low single digits. Adjusted EBITDA margin is expected to improve Y/Y with growth across both segments. Management also reiterated its FY28 medium-term targets from the 2024 Capital Markets Day: mid-single-digit organic growth in a low-single-digit market, adjusted gross margins of 35 to 37%, FCF conversion of ~100% (+/- 10 pts), and CFROI in the low to mid-teens.
Earnings Call Highlights
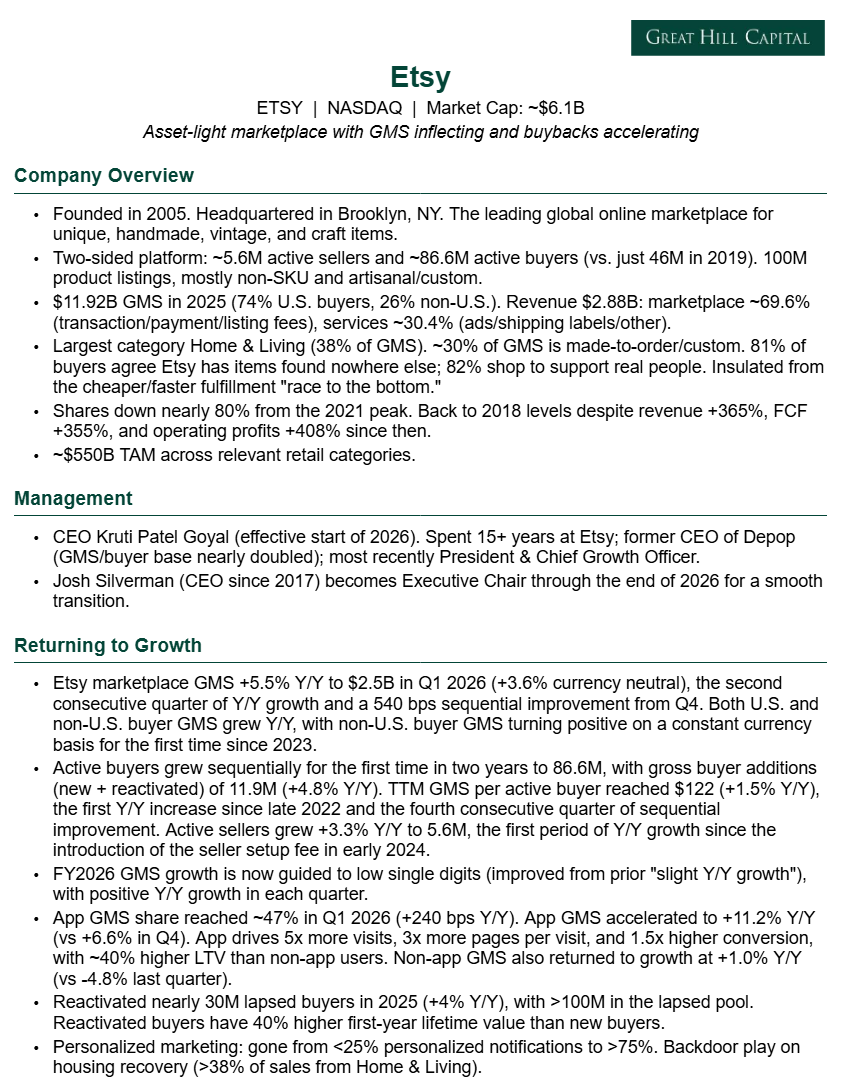
Etsy Update
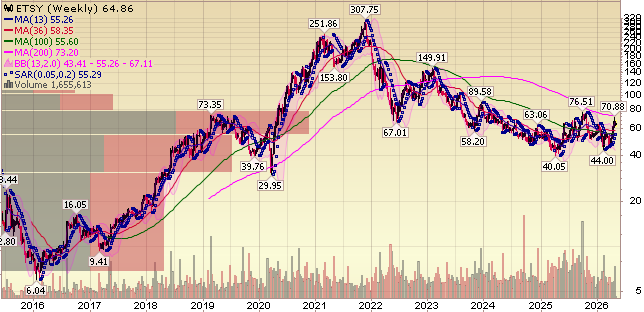
For newer readers, here’s a brief overview of the key drivers behind our Etsy thesis, an asset-light online marketplace inflecting back to growth after digesting the pandemic pull-forward, while aggressively buying back stock along the way:
Q1 Earnings Breakdown
10 Key Points
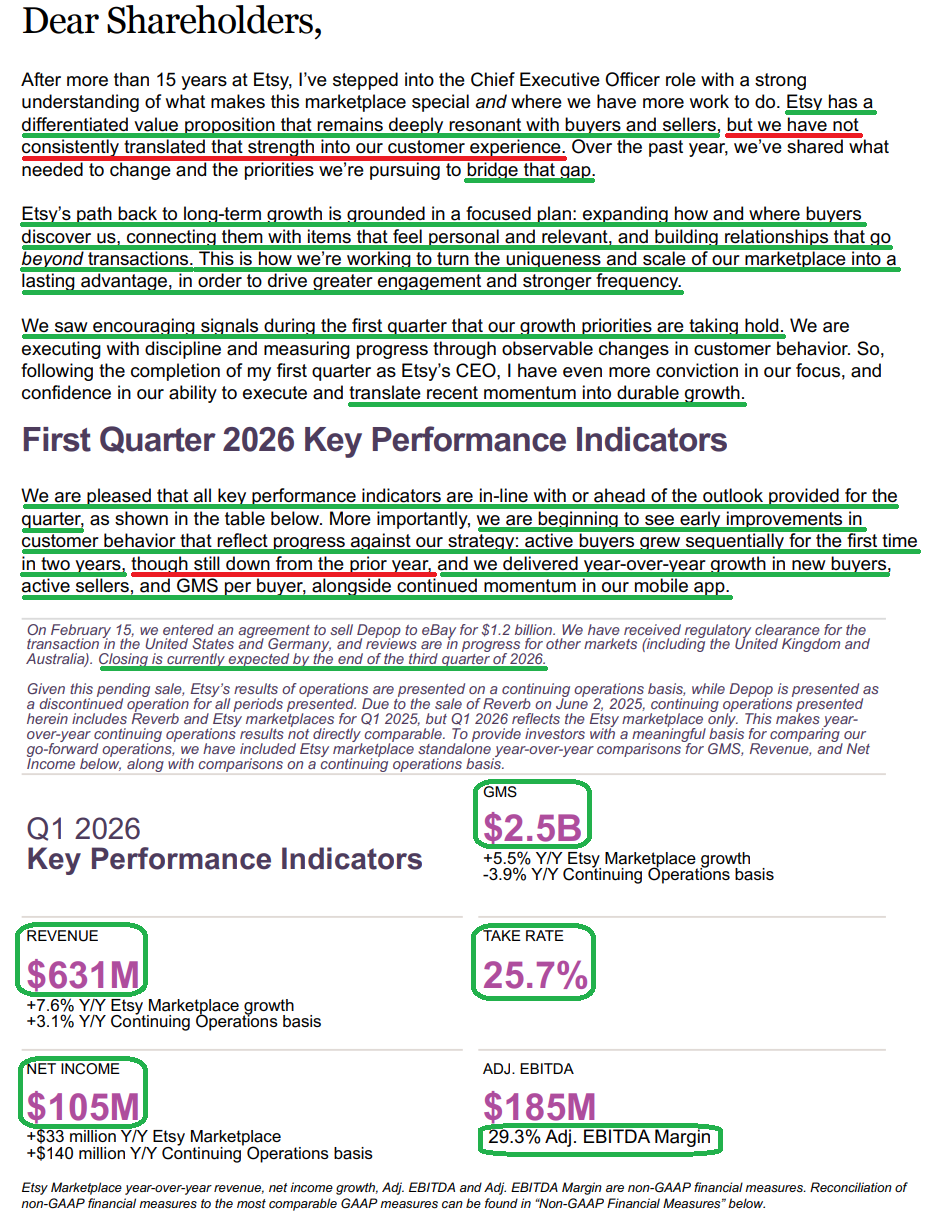
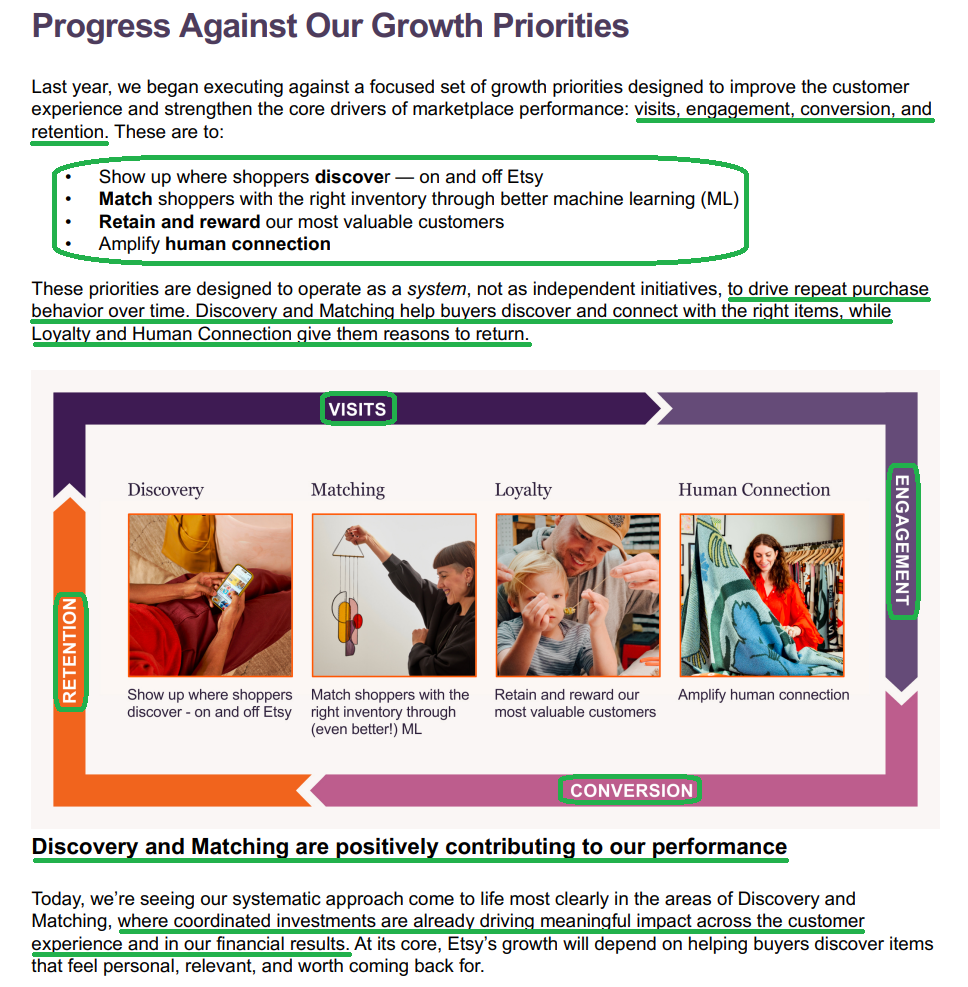
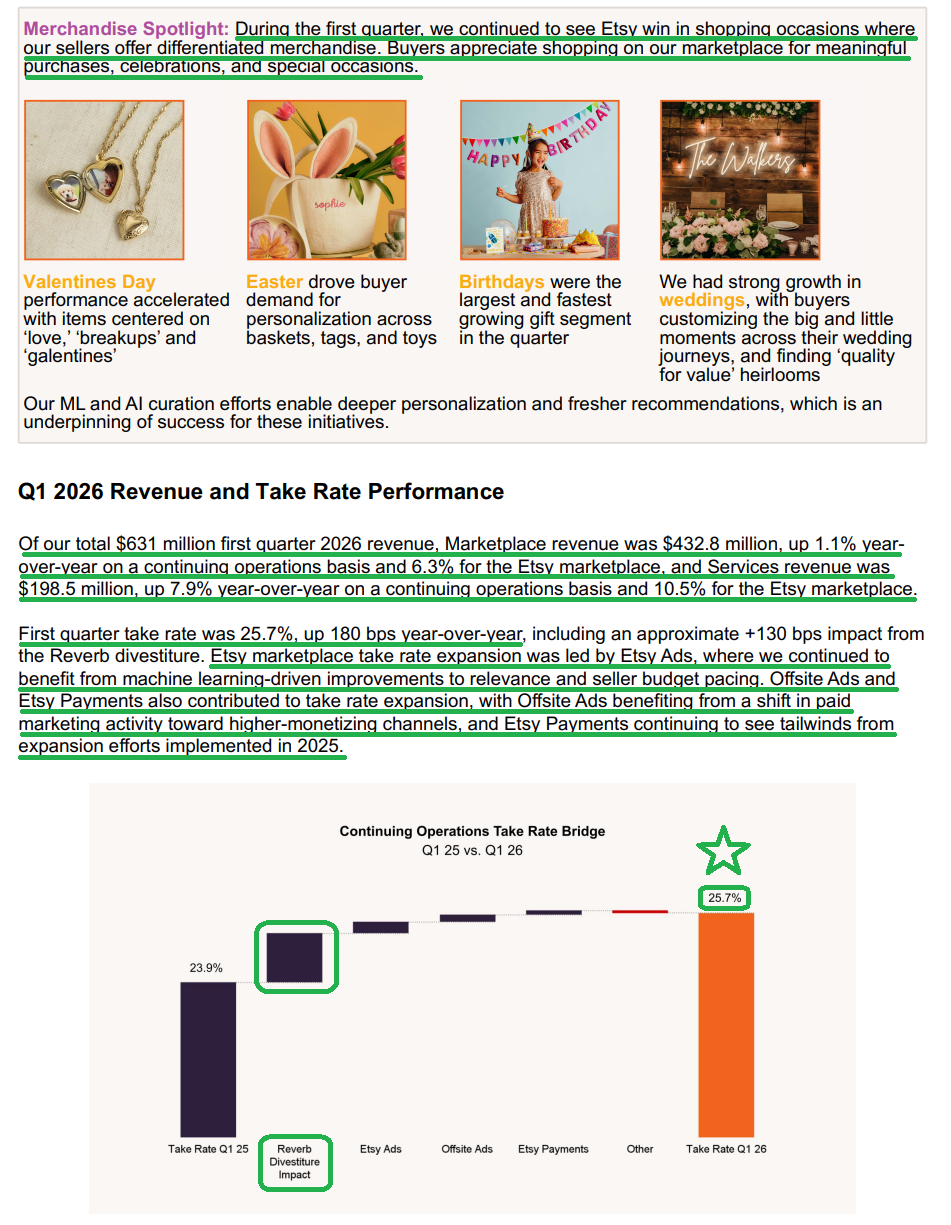
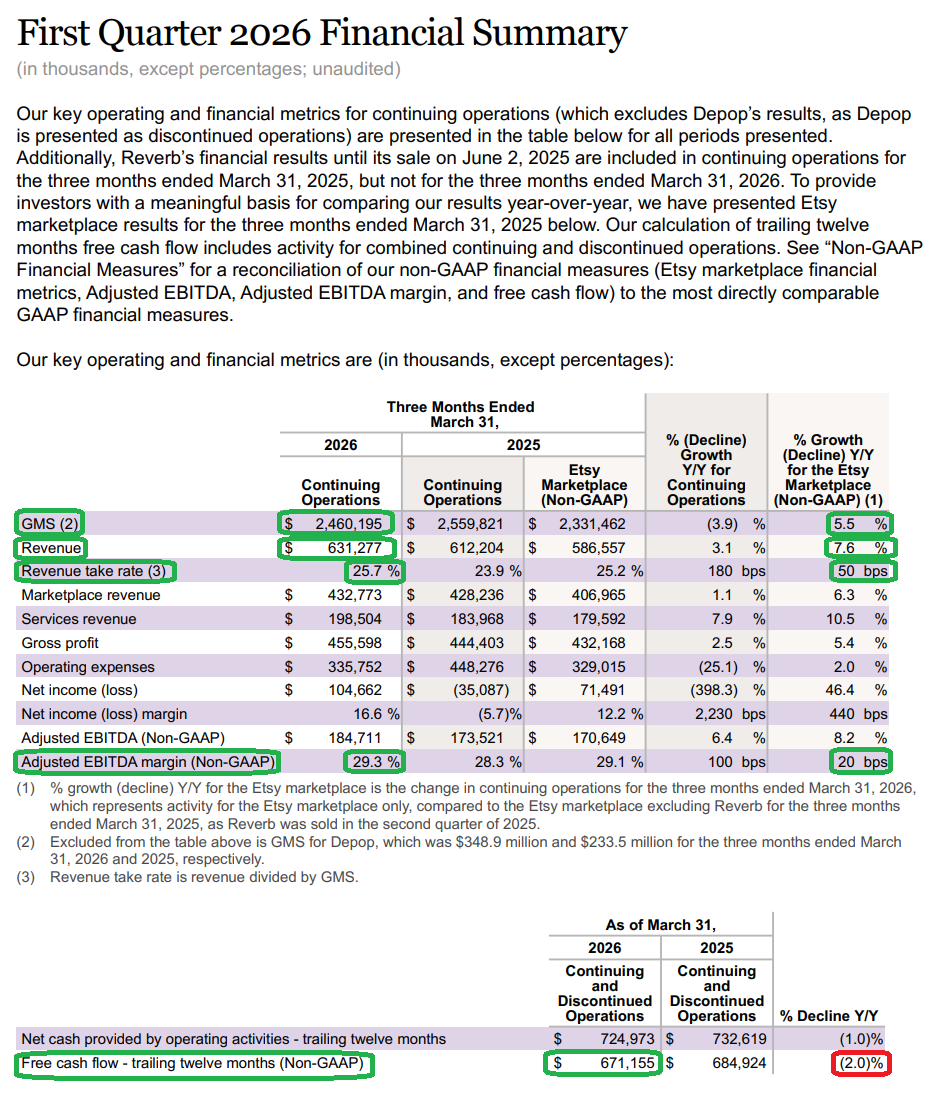
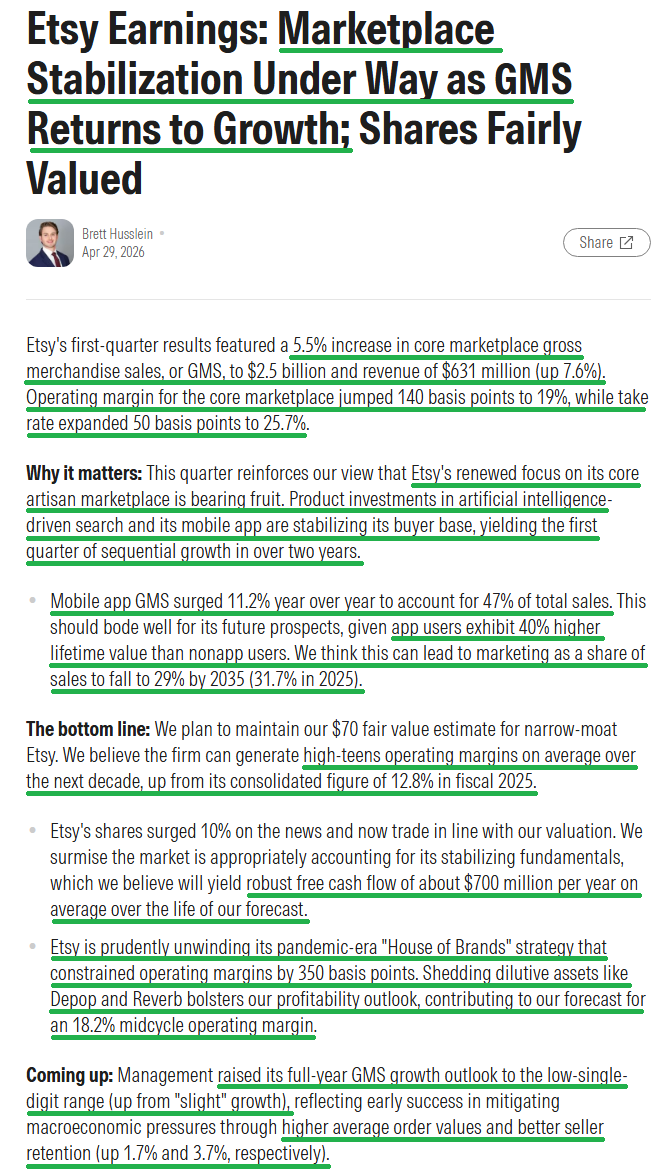
1) Etsy delivered Q1 revenue of $631M (+7.6% Y/Y for the Etsy marketplace, +3.1% Y/Y on a continuing operations basis), ahead of consensus of $617M. Marketplace revenue increased +6.3% to $432.8M, while higher-margin services revenue grew +10.5% to $198.5M.
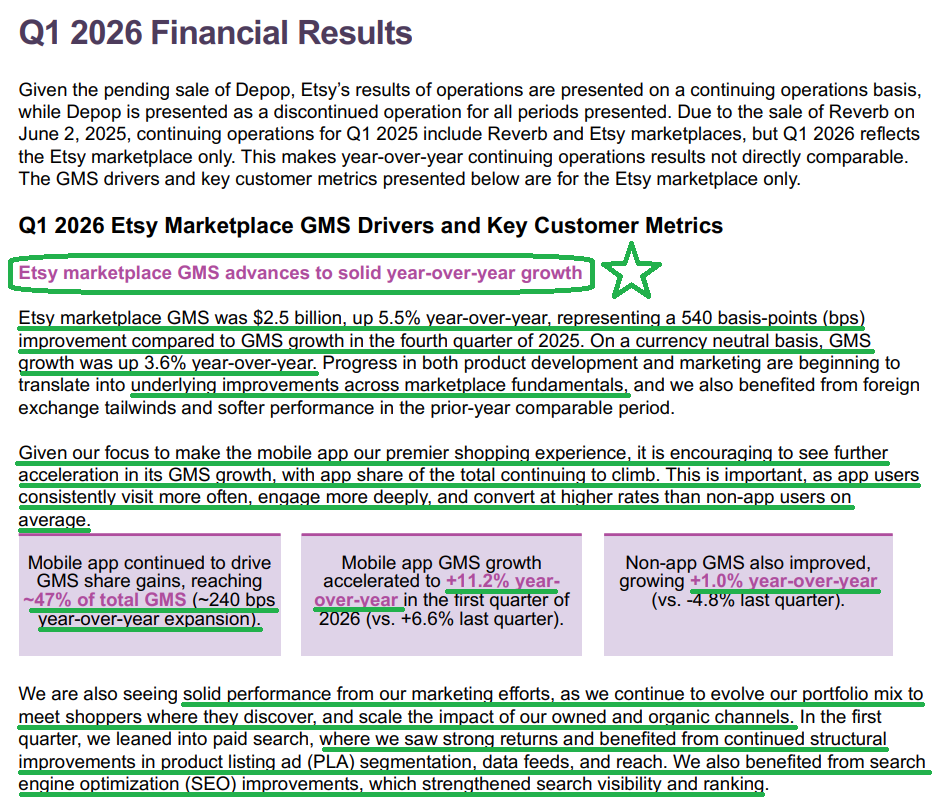
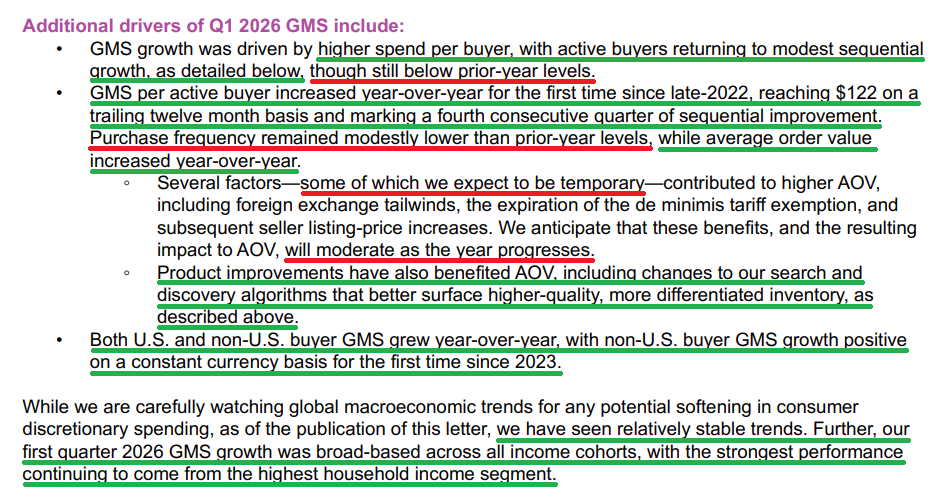
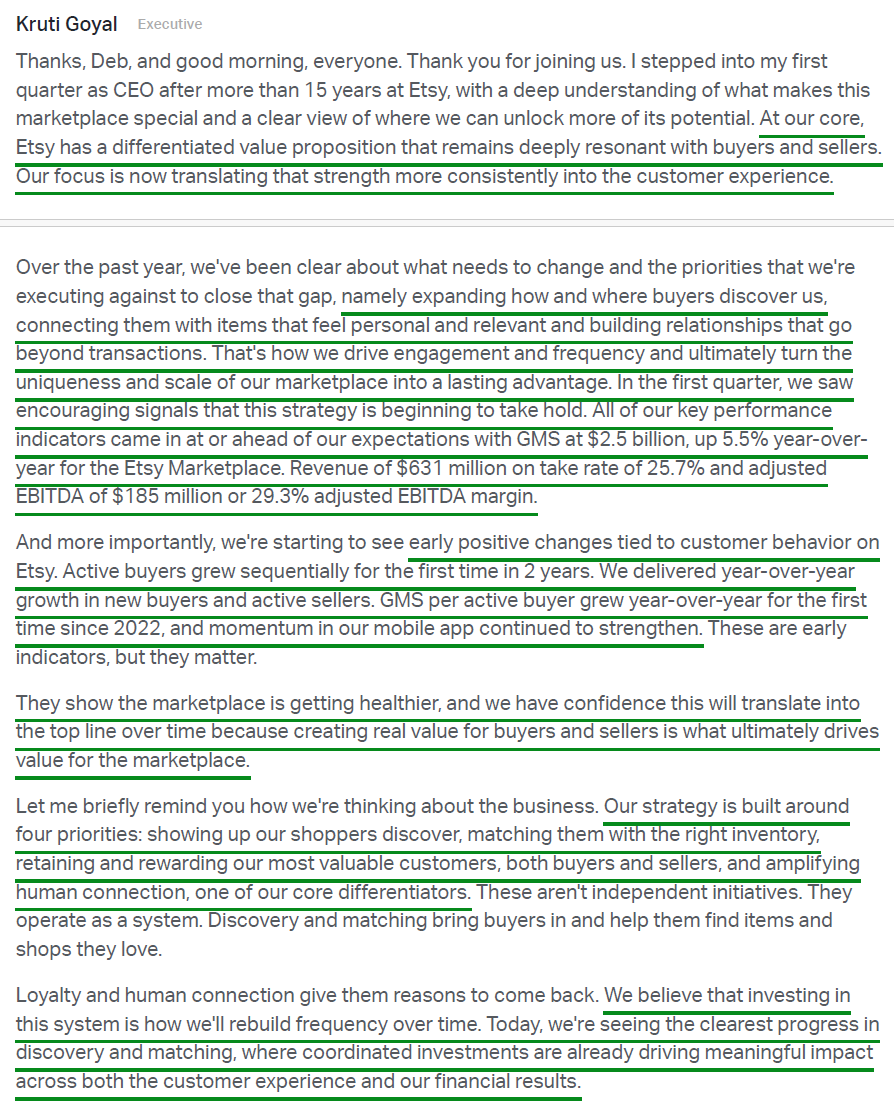
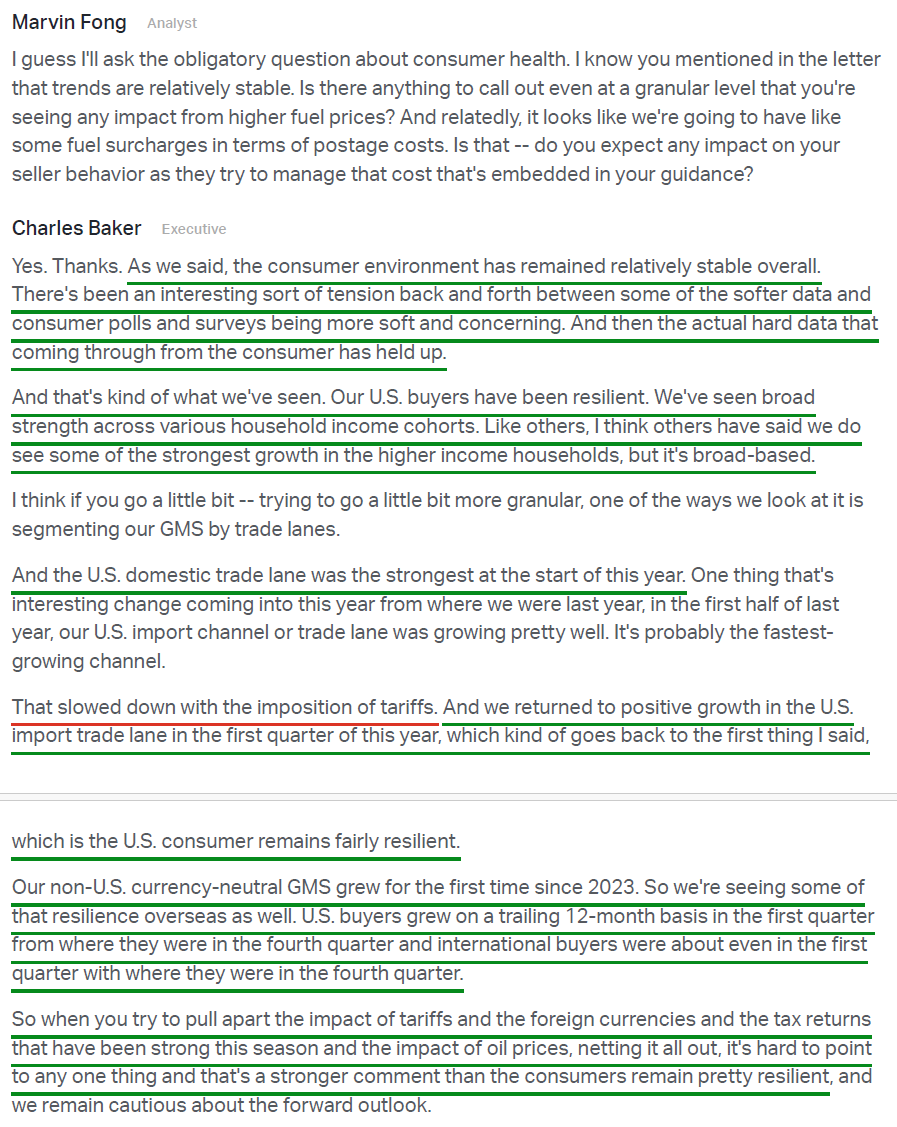
2) Etsy marketplace GMS reached $2.5B (+5.5% Y/Y, +3.6% Y/Y currency-neutral), well ahead of prior guidance of $2.38B to $2.43B (+2% to +4% Y/Y) and representing a 540 bps sequential improvement from Q4. This marks the second consecutive quarter of Y/Y Etsy marketplace GMS growth and the strongest growth print in years. Both U.S. and non-U.S. buyer GMS grew Y/Y, with non-U.S. buyer GMS turning positive on a constant currency basis for the first time since 2023. Management noted growth was broad-based across all income cohorts, with the strongest performance coming from the highest household income segment.
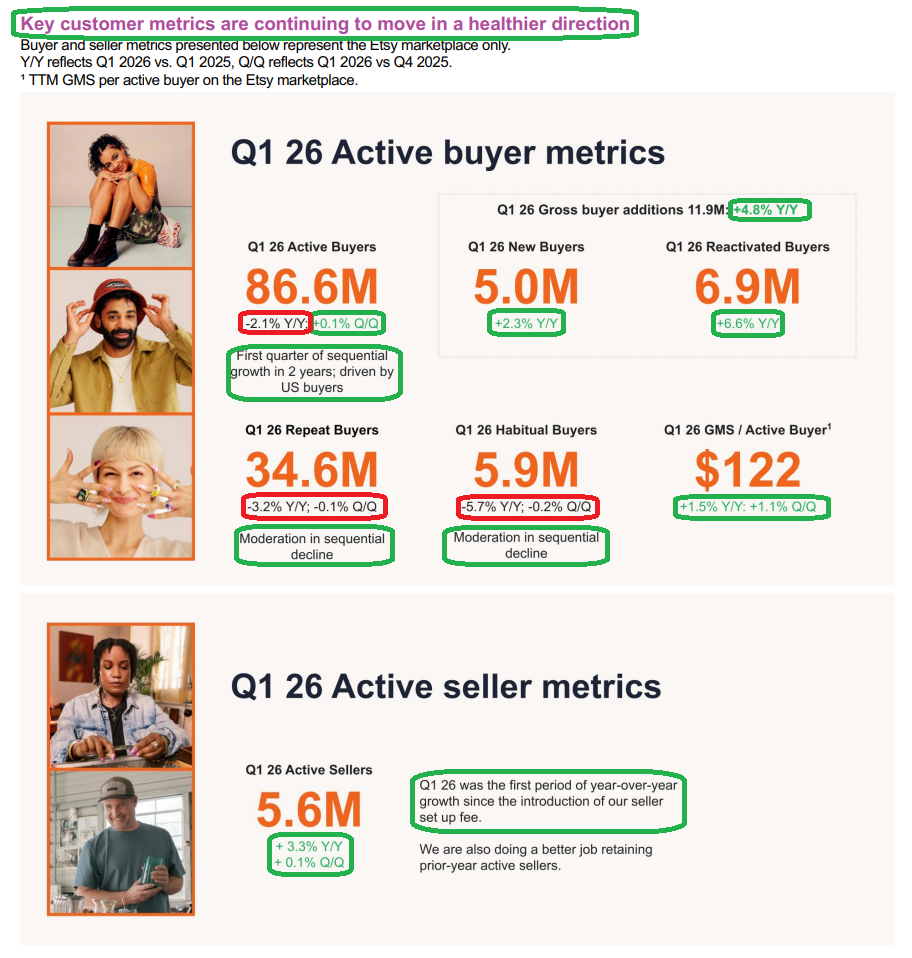
3) Key customer metrics continued to move in a healthier direction across the board. Active buyers grew sequentially for the first time in two years to 86.6M (-2.1% Y/Y, +0.1% Q/Q), with gross buyer additions (new + reactivated) of 11.9M (+4.8% Y/Y). TTM GMS per active buyer reached $122 (+1.5% Y/Y, +1.1% Q/Q), marking the first Y/Y increase since late 2022 and the fourth consecutive quarter of sequential improvement. Active sellers grew +3.3% Y/Y to 5.6M, the first period of Y/Y growth since the introduction of the seller setup fee in early 2024. Repeat and habitual buyer counts also continued to stabilize sequentially.
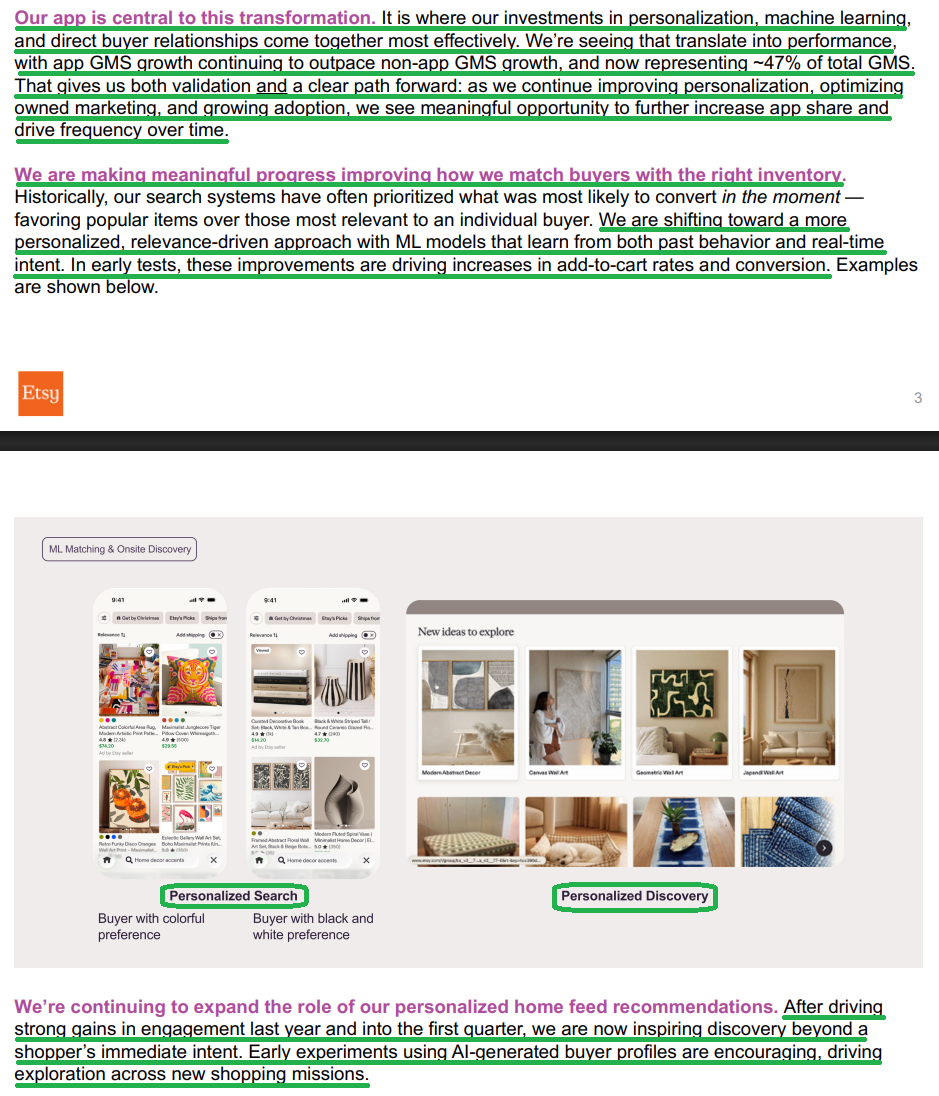
4) The mobile app remains the centerpiece of the growth inflection, with app GMS accelerating to +11.2% Y/Y (vs +6.6% in Q4) and reaching ~47% of total GMS (+240 bps Y/Y). App users continue to deliver ~40% higher LTV than non-app users, driven by more frequent visits, deeper engagement, and higher conversion rates, with management seeing a meaningful opportunity to further increase app share and drive frequency over time. Non-app GMS also returned to growth at +1.0% Y/Y (vs -4.8% last quarter), the first positive print in some time, supported by SEO wins and continued strength in owned channels (push notifications and email driving GMS at double-digit rates).
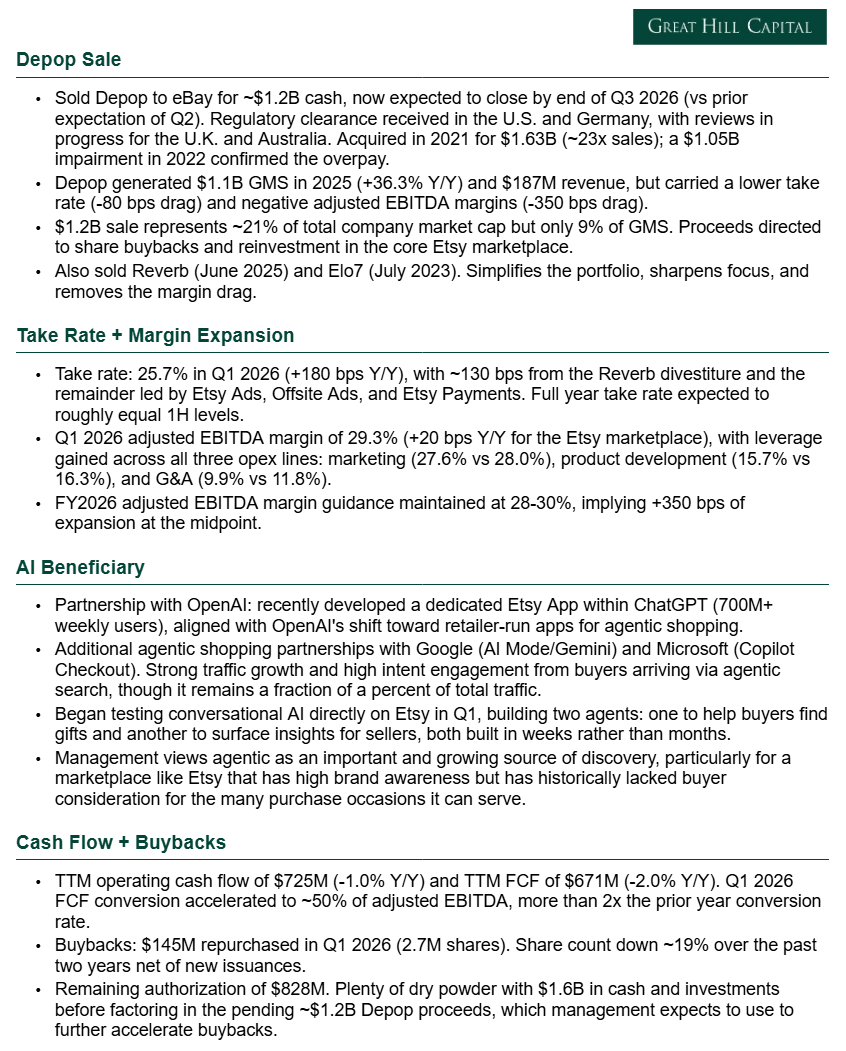
5) Take rate expanded +180 bps Y/Y to 25.7%, ahead of prior guidance of 25.5%, with ~130 bps of the expansion driven by the Reverb divestiture. The remaining ~50 bps was led by Etsy Ads, where management continues to benefit from machine learning-driven improvements to relevance and seller budget pacing. Offsite Ads also contributed, benefiting from a shift in paid marketing activity toward higher-monetizing channels, while Etsy Payments saw continued tailwinds from expansion efforts implemented in 2025.
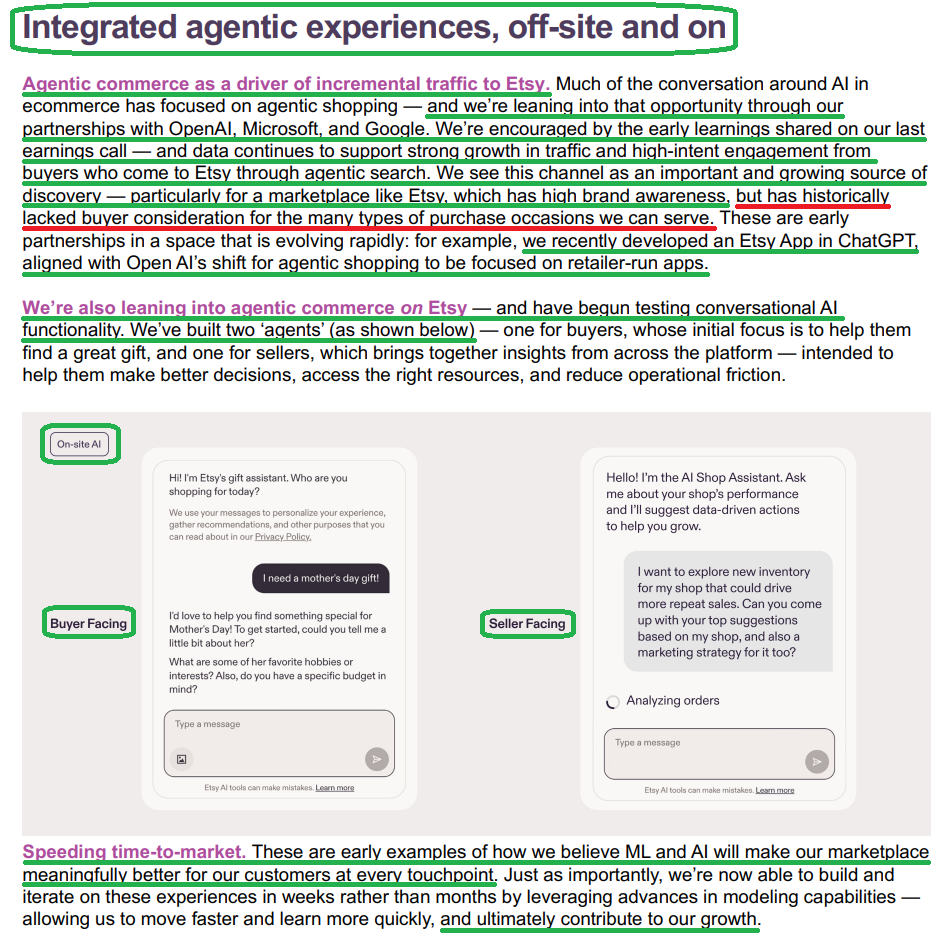
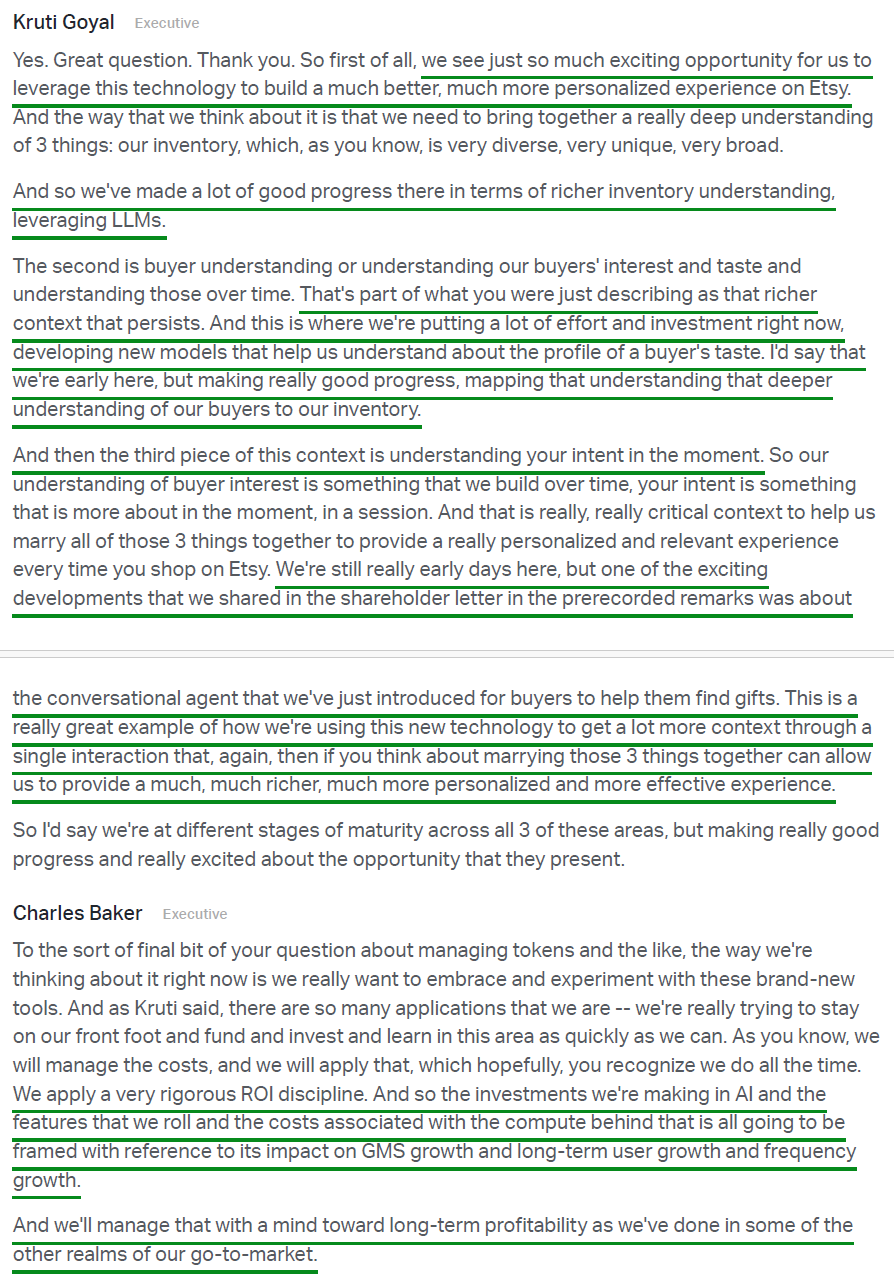
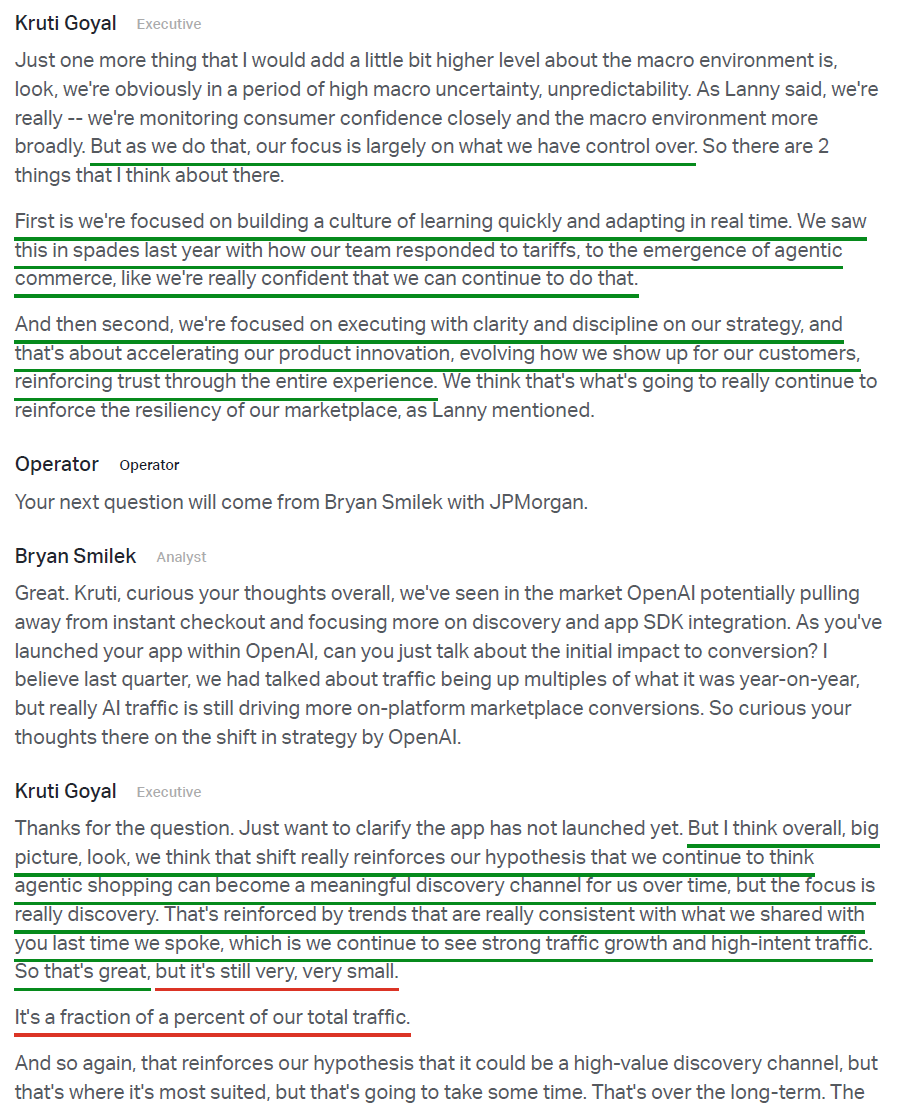
6) Etsy is leaning further into agentic commerce as a driver of incremental traffic, with partnerships across OpenAI, where they recently developed a dedicated Etsy app within ChatGPT, as well as Microsoft and Google. Data continues to support strong traffic growth and high-intent engagement from buyers arriving via agentic search, though it remains a fraction of a percent of total traffic. Etsy also began testing conversational AI directly on the platform, building two agents in Q1, one to help buyers find gifts and another to surface insights for sellers. Management views agentic as an important and growing source of discovery, particularly for a marketplace like Etsy that has high brand awareness but has historically lacked buyer consideration for the many purchase occasions it can serve.
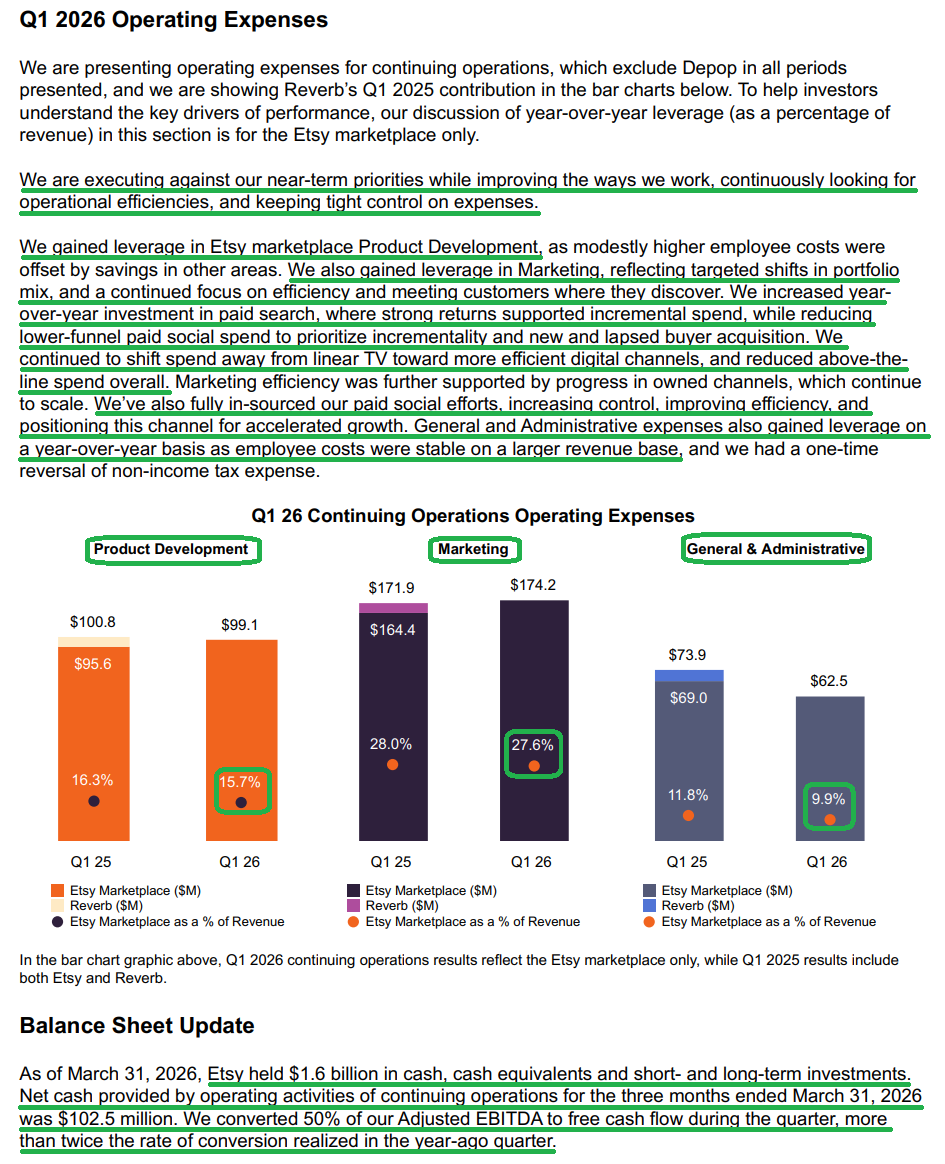
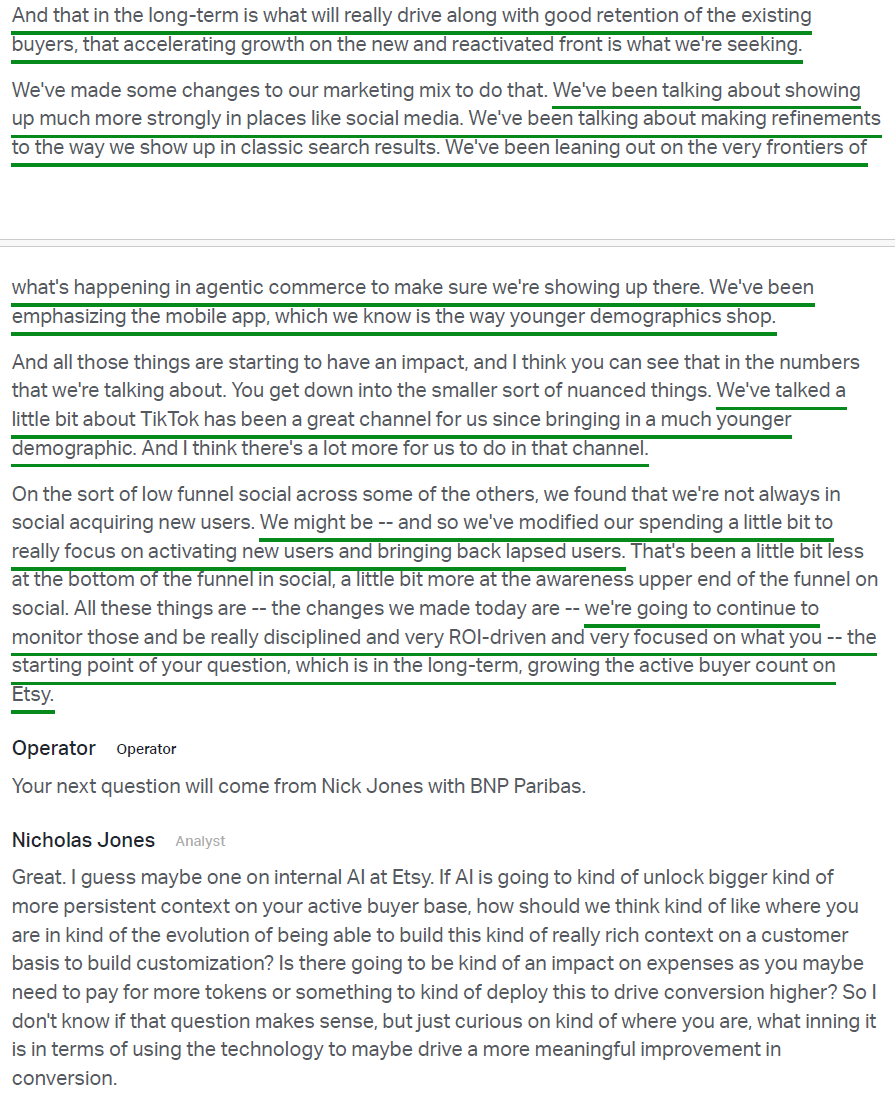
7) Adjusted EBITDA came in at $185M (29.3% margin, +20 bps Y/Y for the Etsy marketplace), ahead of consensus of $177M and at the high end of prior guidance. Etsy gained leverage across all three opex lines: marketing fell to 27.6% of revenue (vs 28.0%), product development to 15.7% (vs 16.3%), and G&A to 9.9% (vs 11.8%). On marketing, management leaned into paid search where returns supported incremental spend, reduced lower-funnel paid social to prioritize new and lapsed buyer acquisition, and continued to shift away from linear TV toward more efficient digital channels aimed at younger demographics (TikTok, etc.).
8) Etsy generated $103M of operating cash flow from continuing operations in Q1, bringing TTM operating cash flow to $725M (-1.0% Y/Y). FCF conversion accelerated to ~50% of adjusted EBITDA during the quarter, more than 2x the prior-year conversion rate, bringing TTM FCF to $671M (-2.0% Y/Y).
9) Etsy repurchased $145M of stock during Q1, reducing the share count by 2.7M shares and marking a ~19% reduction in shares outstanding net of new issuances over the past two years. Etsy has $828M remaining on the current authorization, with plenty of dry powder, holding $1.6B in cash and investments before factoring in the pending ~$1.2B Depop sale proceeds, which management expects to use to further accelerate buybacks. On the Depop sale, management now expects it to close by the end of Q3 2026 (vs prior expectation of Q2), with regulatory clearance received in the U.S. and Germany and reviews in progress for the U.K. and Australia.
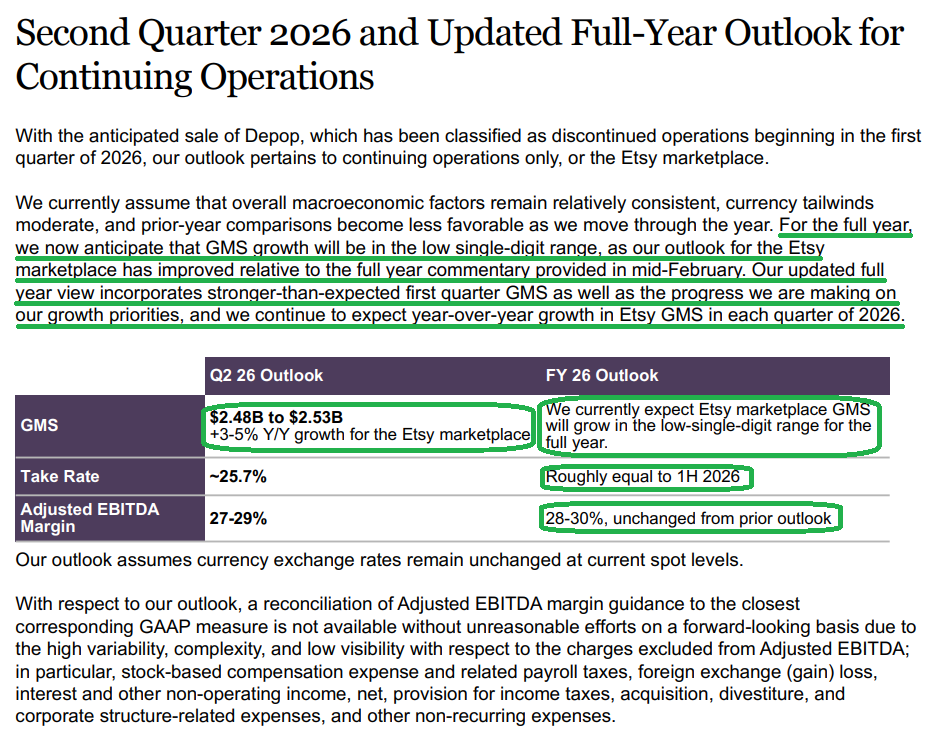
10) Management guided Q2 2026 Etsy marketplace GMS to $2.48B to $2.53B (+3% to +5% Y/Y), with a take rate of ~25.7% and an adjusted EBITDA margin of 27% to 29%. For the full year, GMS growth is now expected in the low-single-digit range, an improvement from prior commentary of “slight Y/Y growth,” with positive Y/Y growth in each quarter. Full-year take rate is expected to roughly equal 1H levels, and adjusted EBITDA margin guidance was maintained at 28% to 30%. Management noted that prior-year comps get less favorable through the year and that FX tailwinds and de minimis-driven AOV benefits will moderate, but emphasized that the underlying fundamental improvements driven by product and marketing investments will continue.
Earnings Call Highlights
Morningstar Analyst Note
We’ve had several portfolio names report earnings in recent days. Below are the key takeaways from the reports we haven’t yet covered in full. More detailed analysis to follow in the coming week(s):
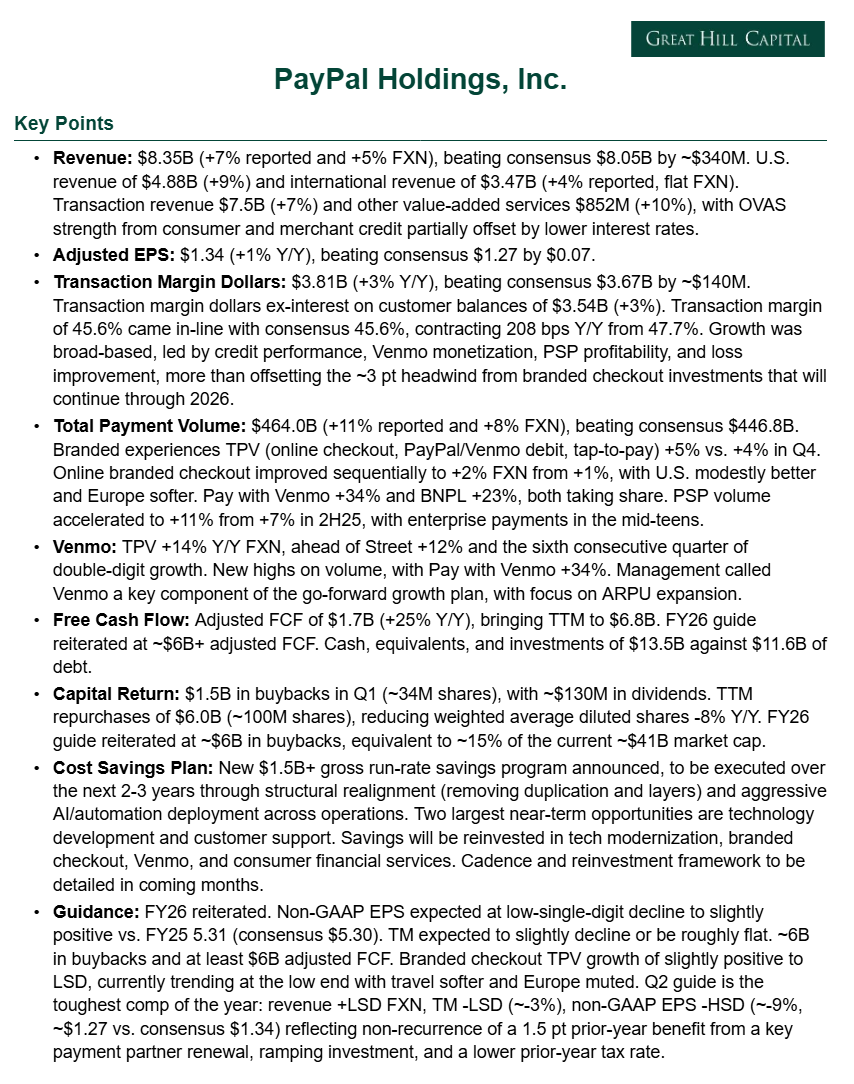
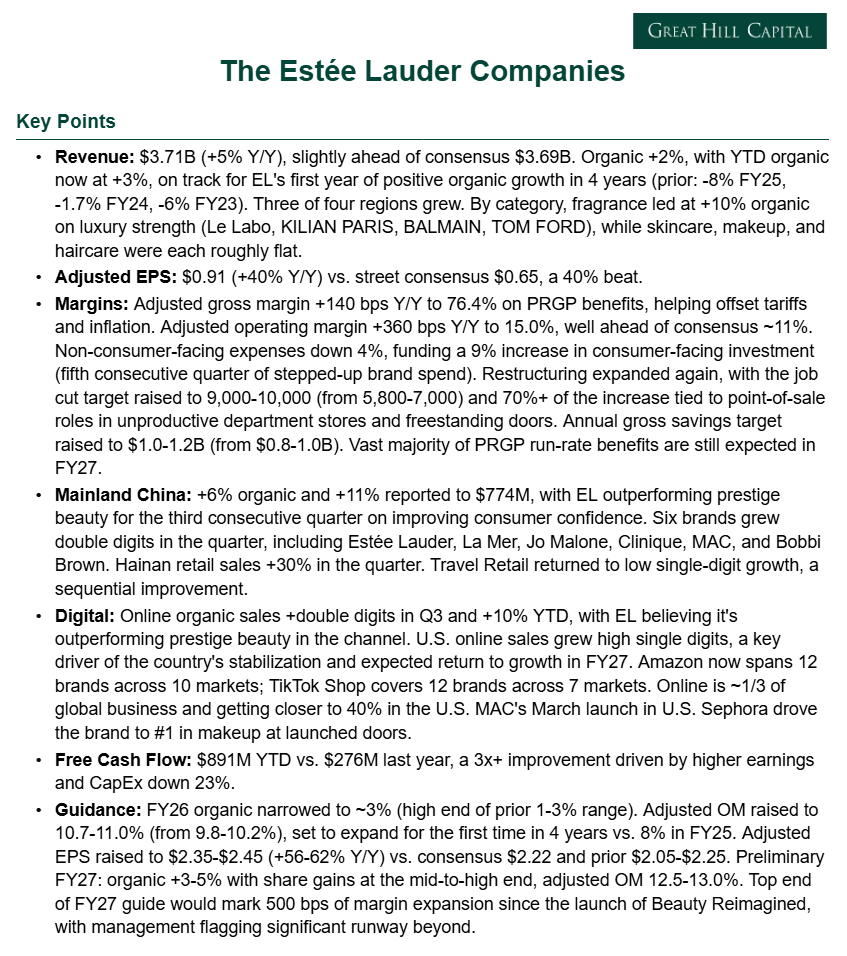
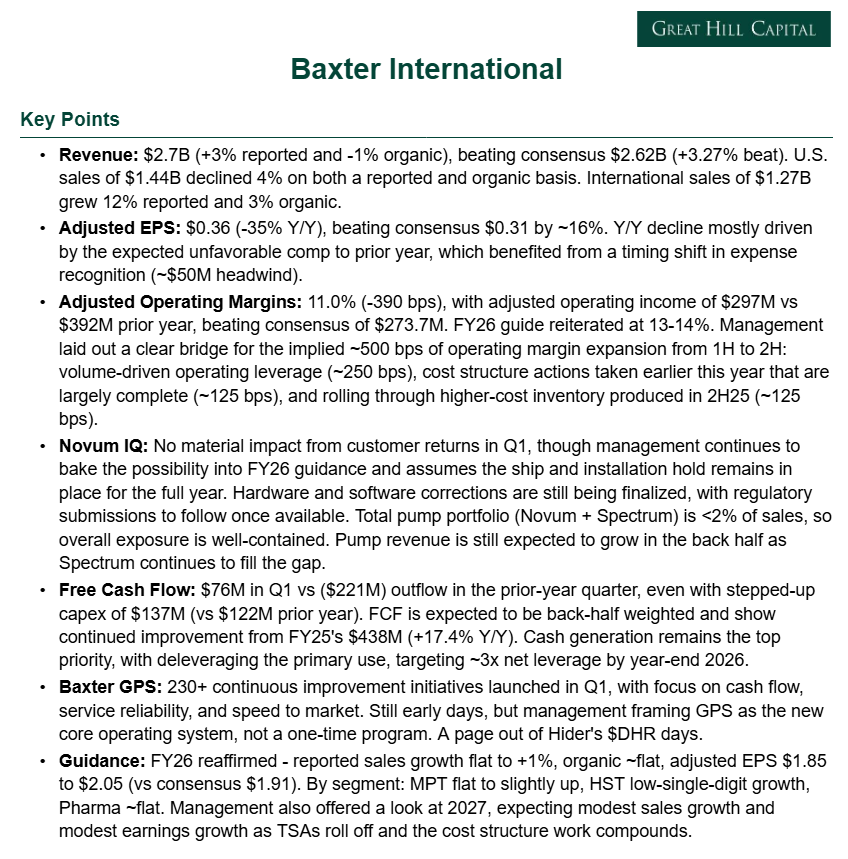
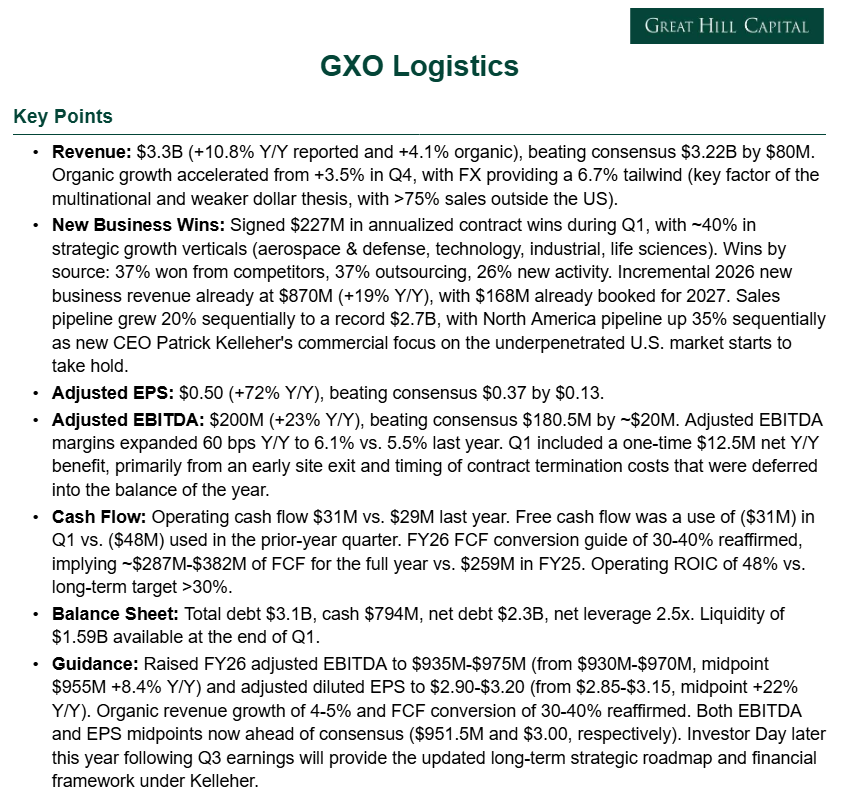
General Market
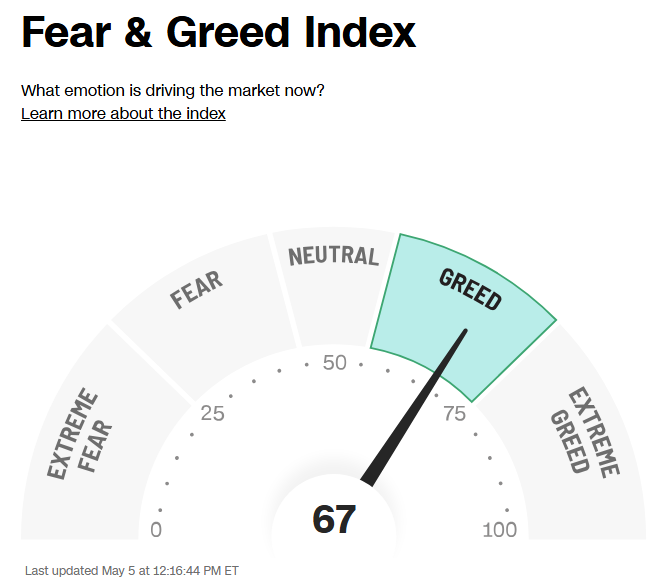
The CNN “Fear and Greed Index” ticked down to 67 this week from 68 last week. You can learn how this indicator is calculated and how it works here: (Video Explanation)
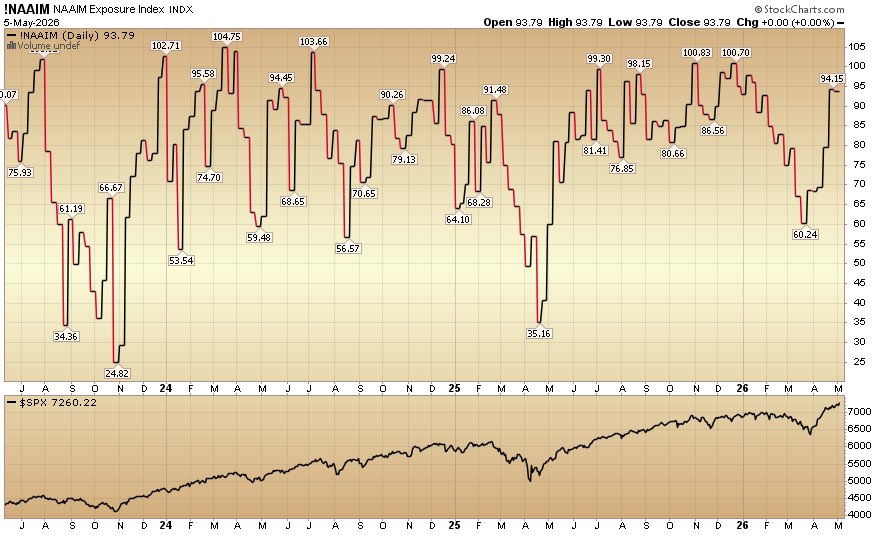
The NAAIM (National Association of Active Investment Managers Index) (Video Explanation) fell to 93.79% equity exposure this week from last week’s 94.15%.
Our podcast|videocast will be out sometime today. We have a lot of great data to cover this week. Each week, we have a segment called “Ask Me Anything (AMA)” where we answer questions sent in by our audience. If you have a question for this week’s episode, please send it in at the contact form here.
Larger accounts $5-10M+ can access bespoke service anytime here.
Not a solicitation.
*Opinion, Not Advice. See Terms


