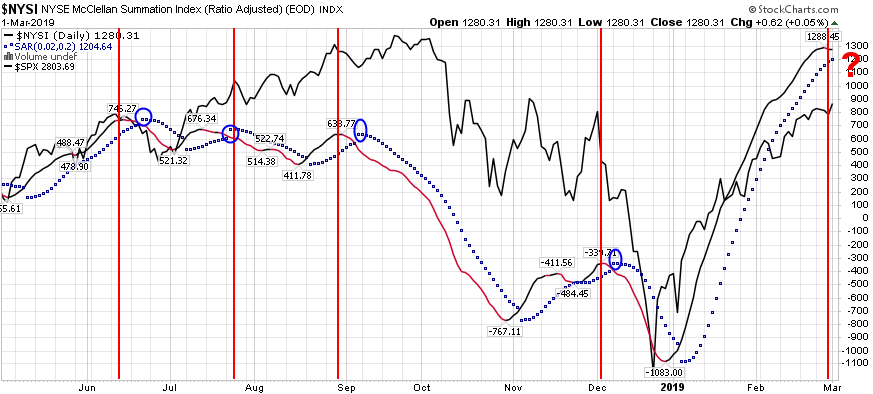
The McClellan Summation Index above is a breadth indicator derived from the McClellan Oscillator, which is a breadth indicator based on Net Advances (advancing issues less declining issues). The Summation Index is simply a running total of the McClellan Oscillator values. Even though it is called a Summation Index, the indicator is really an oscillator that fluctuates above and below the zero line.
I have used this NYSI along with a hand full of other indicators over the years to act as a barometer for possible turning points. I like to couple the NYSI with a Parabolic SAR trigger that gives me a better “tell” when the short term indicator is potentially turning.
In the chart above, the black/red line is the NYSE McClellan Summation Index, and the solid black line is the S&P 500 in the background. There are 2 triggers I look for for a potential reversal:
1) The black NYSI turns red.
2) The Parabolic SAR dots flip from under the NYSI to above.
So far we’ve gotten the change from black to red for a potential change in trend but are waiting for the Parabolic SAR dot flip for confirmation. It has been one of a number of indicators that I use to weigh the odds at potential inflection points.
The parabolic SAR showed results at a 95% confidence level in a study of 17 years of data: Study by Timothy C. Pistole
Like all indicators, they are best used as barometers and not crystal balls. The key is lining up odds in your favor and then using sizing and risk management to consistently win over a series of positions.
If you found this post helpful, please consider visiting a few of our sponsors who have offers that may be relevant to you.


