
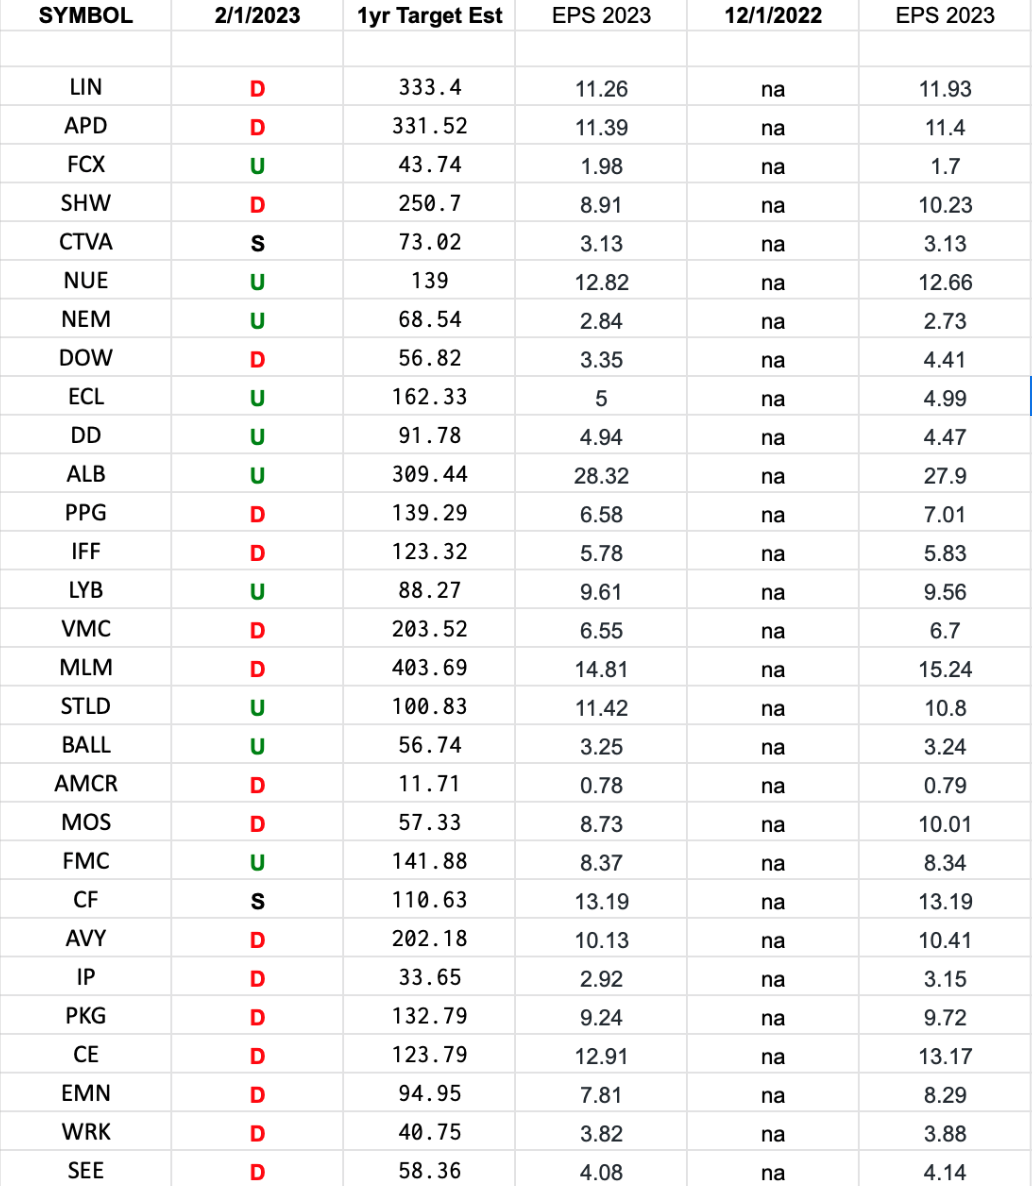
In the spreadsheet above I have tracked the earnings estimates for the Basic Materials Sector ETF (XLB). I have columns for what 2023 estimates were: 12/1/2022 and today.
The column under the date 2/1/2023 has a letter that represents the movement in 2023 earnings estimates since the most recent print (12/1/2023). “U” means 2023 estimates are UP in the last 60 days. “D” means 2023 estimates are DOWN in the last 60 days. “S” means 2023 estimates have remained the SAME in the last 60 days. The column entitled “1yr Target Est” is the Wall Street consensus 12 month price target for each stock.
What this table is telling us is that estimates have fallen. More estimates came down for 2023 in the past 60 days than went up. 10:17 was the UP:DOWN ratio.
The cumulative 2023 earnings power of the group decreased -2.13% in the last 60 days.


