
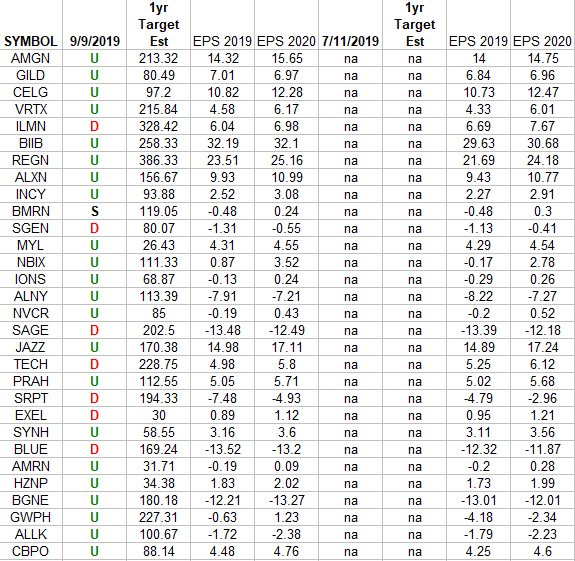
In the spreadsheet above I have tracked the earnings estimates for the Nasdaq Biotech ETF (IBB) top 30 weighted stocks. The column under the date 9/9/2019 has a letter that represents the movement in 2019 earnings estimates since the most recent print (7/11/2019). “U” means 2019 estimates are UP in the last 60 days. “D” means 2019 estimates are DOWN in the last 60 days. “S” means 2019 estimates have remained the SAME in the last 60 days. The column entitled “1yr Target Est” is the Wall Street consensus 12 month price target for each stock.
What this table is telling us is that estimates have jumped up in the past 60 days. More estimates went UP for 2019 in the past 60 days than came DOWN 22:7 ratio. The rest remained the same.
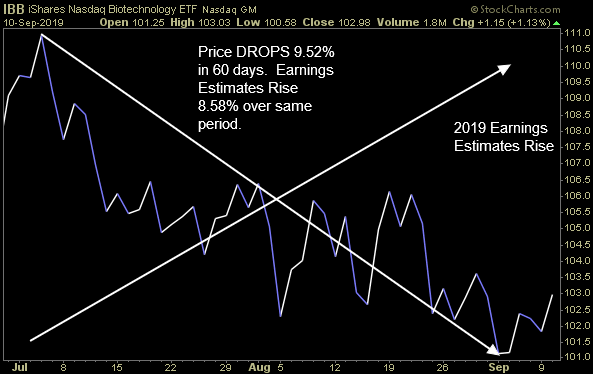
The cumulative earnings power of these 30 stocks was revised UP by 8.58% in the past 60 days. While it has had among the largest sector EPS increases, it has had among the worst price performance (dropping -9.5% peak to trough). Sooner or later these divergences tend to rectify themselves. Despite the political overhang, this sector has significant pent up energy (earnings power) that should resolve to the upside (new highs) by year end…


