
The Bullish Percent Index, or BPI, is a breadth indicator that shows the percentage of stocks on Point & Figure Buy Signals. There is no ambiguity on P&F charts because a stock is either on a P&F Buy Signal or P&F Sell Signal. The Bullish Percent Index fluctuates between 0% and 100%.
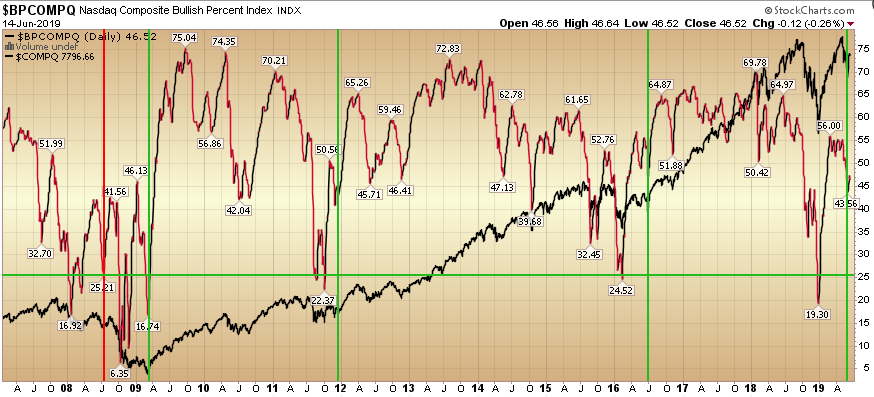
Right now, the “Bullish Percent” Nasdaq Composite is coming in at 46.52% (off its recent peak of 56%). The above chart is the “Bullish Percent Index” for the Nasdaq Composite (red and black line) with the Nasdaq Composite Index in the background (all black line).
In the last 11 years, it has been common on an extreme drop below 25% for the first bounce be strong – followed by a pullback that draws the shorts back in with their recency bias – that the most recent correction will be immediately replicated.
As we can see, that is usually not the case.
In 2016, the “Bullish Percent” Nasdaq Composite dropped below 25, rallied above 55, pulled back to the mid 40’s and then shot higher taking the market to new highs.
In 2011, the “Bullish Percent” Nasdaq Composite dropped below 25, rallied above 50, pulled back to the low 40’s and then shot higher taking the market to new highs.
In 2009, the “Bullish Percent” Nasdaq Composite dropped below 25, rallied above 46, pulled back to the high teens and then shot higher taking the market to new highs
The exception is 2008 when the first drop below 25 failed to hold. This is unlikely for 2 reasons:
1. The yield curve (defined by 2/10 spread) has not yet inverted. Market peaks are generally 1-2 years AFTER this inversion.
2. In 2007-2008, we had two sequential quarters of drops in operating earnings which foretold the underlying erosion in the economy ahead of time. While we had a sequential drop in operating earnings from Q3-Q4 2018 (and the correction to go with it), it did not follow through for Q4-Q1 (operating earnings recovered and were higher in Q1 2019 than Q4 2018).
I would expect to see the Nasdaq “Bullish Percent” back above 56 in coming months along with the Nasdaq composite making new highs along with it.
As with all indicators they are to be used as a barometer, NOT a crystal ball. It is always helpful to have a handful of indicators working in the background so you can measure where you generally are in terms of extremes.
The key is taking probability advantaged trades over a series – with a positive expected outcome – and disciplined risk management and sizing to win over time.


