
“Damn Strait” is a song by American country music singer Scotty McCreery. It was released on October 18, 2021. The song is a tribute to country music legend George Strait. I think as we approach the end of the year, many investors in any risk assets (stocks or bonds) can relate to his lyrics:
Damn strait, you’re killing me, man
You know I’ve always been your biggest fan…
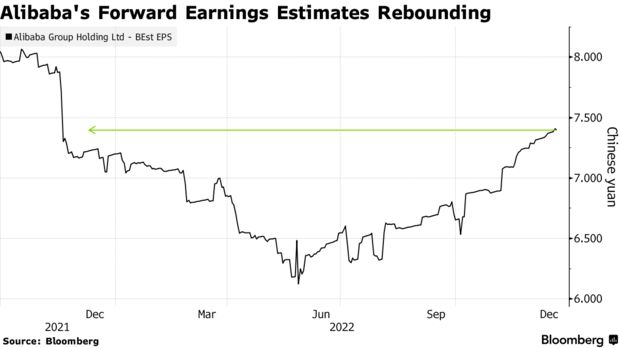
The good news is, it’s always darkest before dawn, and as we covered last week – our largest three positions are showing some nice buoyancy. Alibaba is up ~50% off the October lows, Cooper Standard is up ~37% from inception and Biotech is up ~26% off the May lows. While the general market is weak, we are finding some calm in the storm of late.
On Wednesday, I joined Kelly O’Grady on Fox Business – The Claman Countdown – to discuss the Stock Market and Cooper Standard. Thanks to Kat Meyers, Liz Claman and Kelly for having me on:
Find our full thesis on Cooper Standard here (scroll down midway):
Yesterday, I also joined J.D. Durkin on TheStreet to discuss general 2023 Stock Market and economic outlook. Thanks to J.D. and Rebecca Mezistrano for having me on.
Watch partial interview in HD directly on TheStreet
Or full interview here:
Here were my notes ahead of the segment:
History shows back-to-back losing years for stocks are rare (less than 10% of time):
-S&P has fallen for two straight years less than 10% of the time from 1928 to 2021 (4x, 2x post WWII). In the year after a negative total annual return for the S&P, the index is up by 12.6% (13.5% post WWII) on average and is positive 17 out of 25 years.
1982 (Magic 3 words):
S&P dropped 27% when Volker was tightening in 1981-1982. Market bottomed in August 1982 when inflation was still at 6.93%. On October 5, 1982 (while inflation was still 6.55%), Volker said he “may shift tactics.” The stock market recovered 100% of the losses within 4 months and went on to make new ALL-TIME highs the next year.
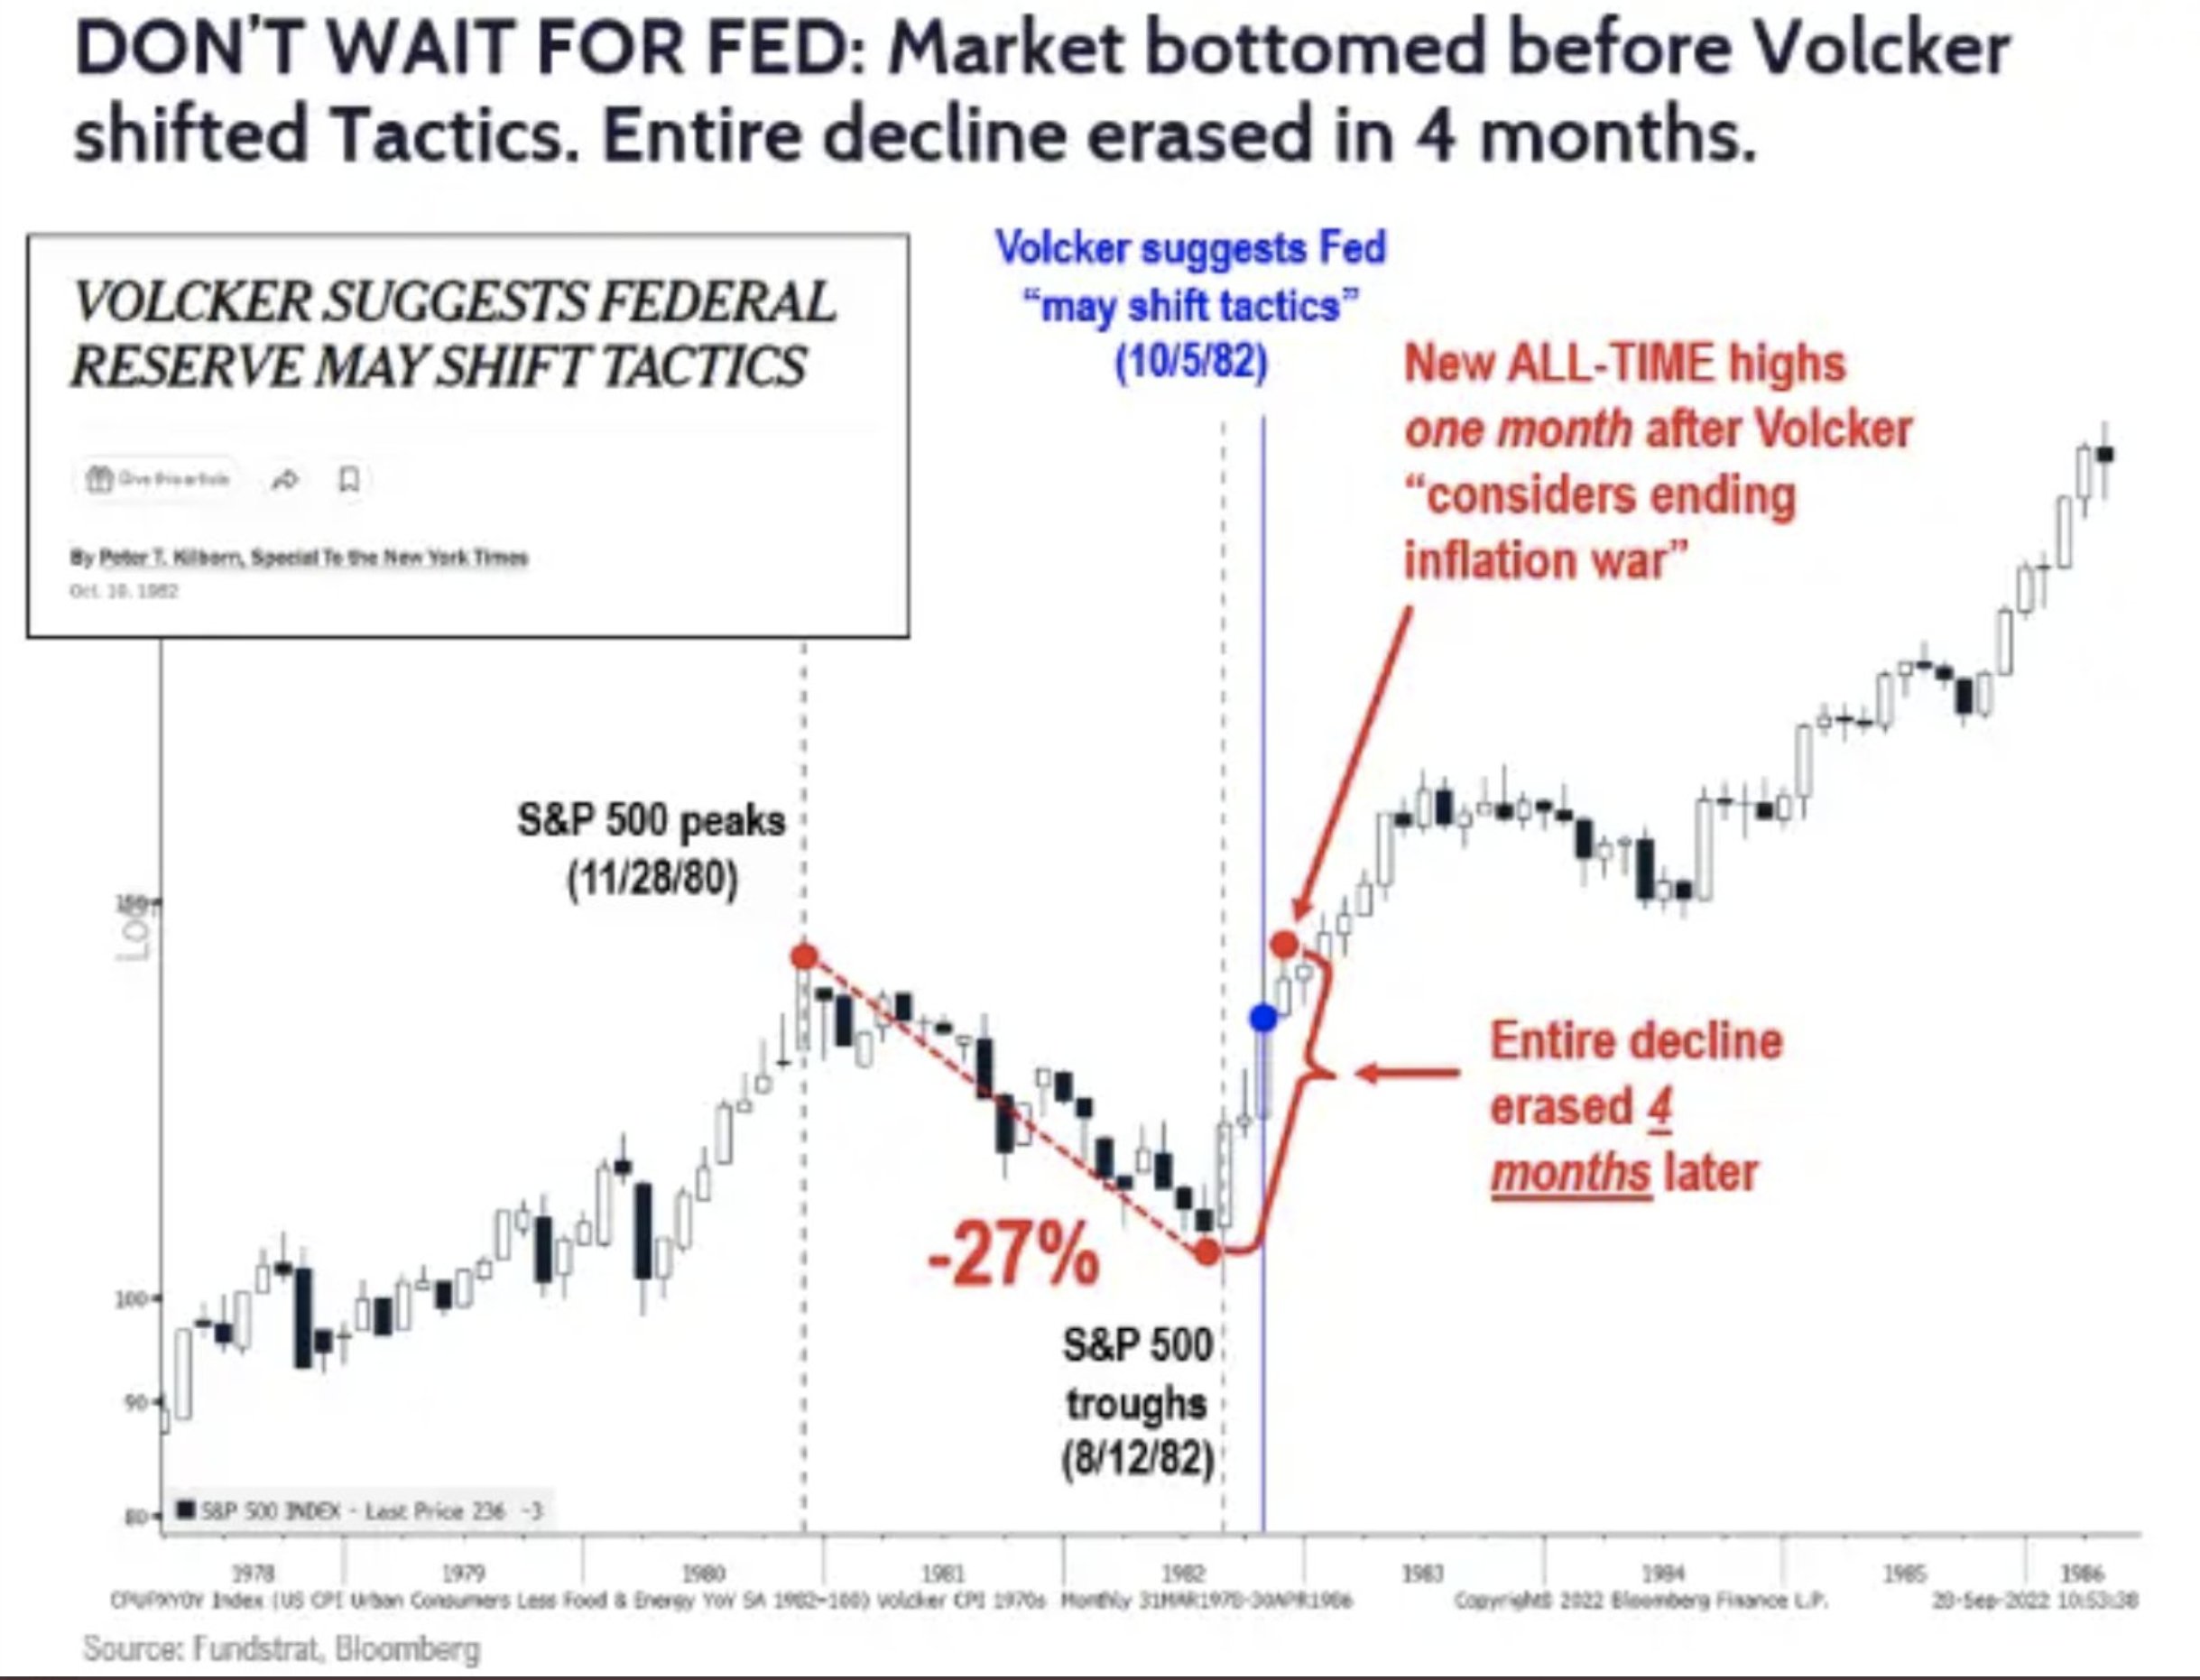
Fundstrat
-Since 1954 average 12mo return after Fed PAUSES = 14% (n=13)
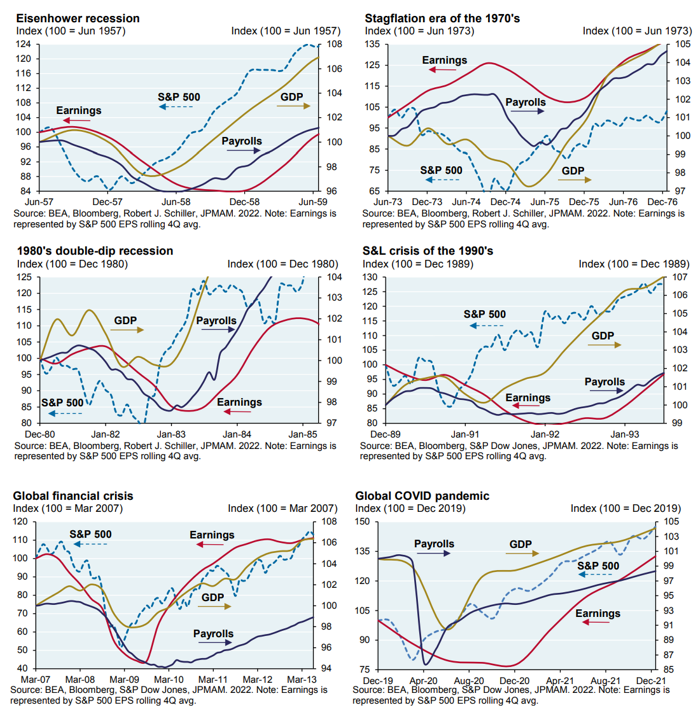
Earnings Coming Down? Stock Market Bottoms 6-12 months before Earnings:
Most analysts are calling for earnings to come down another 20% and are therefore bearish on the market. History shows the stock market bottoms WELL BEFORE earnings. In most cases the S&P 500 had recovered to new highs by the time earnings bottomed 6-12 months later: 1957, 1974, 1982, 1990, 2009, 2020.
Consensus Top Down Expectations Frequently Wrong:
-A year ago, equity analysts were penciling in the S&P 500 SPX, finishing 2022 at 5,264.51, according to FactSet data.
-A recent survey of top Wall Street forecasters by MarketWatch put the average S&P 500 estimate at 4,031 for the end of 2023, an advance of only about 6% from Tuesday’s close of 3,821.62.
Negative December Bad Omen?
-4x since WWII down more than 4%. Avg. gain 12 mo later = +20%
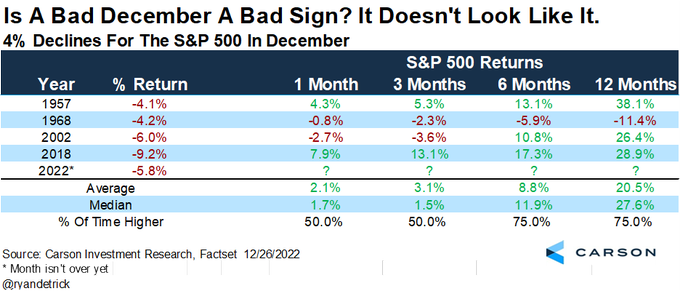
Ryan Detrick – Carson
-Massive Tax Loss Selling This Year. Worst year since 2008.
Santa Claus Rally Implications
When the Santa Claus Rally takes place, the year is up 10.5% on avg and higher 73.2%. When there is no SCR? Only 5.0% and 67%.
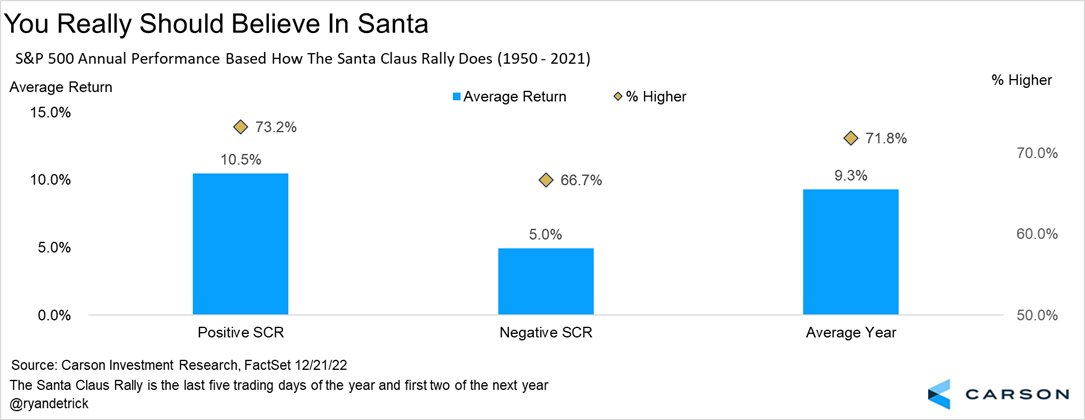
-The Dow Jones Industrial Average DJIA, 0.28% and S&P 500 Index have each traded higher almost 80% of the time during the seven-day holiday period since 1950, gaining an average of 1.38% and 1.32% respectively.
-72 years data: only 16 holiday seasons have failed to produce a rally.
-No SCR, the S&P 500 eked out just a 0.53% average gain in the first quarter that followed.
-Positive SCR gains, the index produced an average 2.49% first-quarter advance thereafter.
January Barometer: As goes January, so goes the year…
When the S&P had positive returns in the month of January, the average return for the year was 17.6% since 1950. 84.5% accuracy.
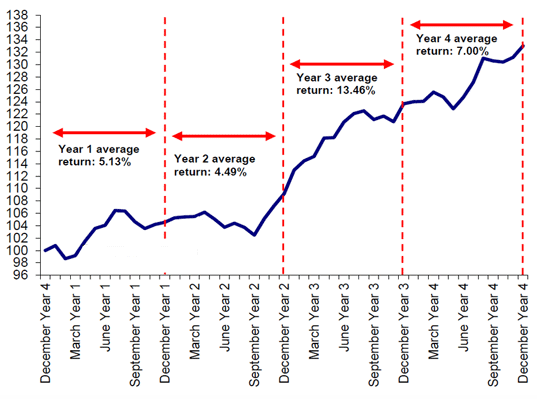
Presidential Cycle:
Everyone expects the first half of ’23 to be bad for stocks. The first quarter in a pre-election year was lower only once since 1950 (up 17 of 18).
The third year of the four year Presidential Cycle (especially the first two quarters) is the strongest year for Stock Market performance (avg 13.46%). It follows the WORST year of the Presidential Cycle (2nd year) or in present day – 2022. First two quarters strongest.
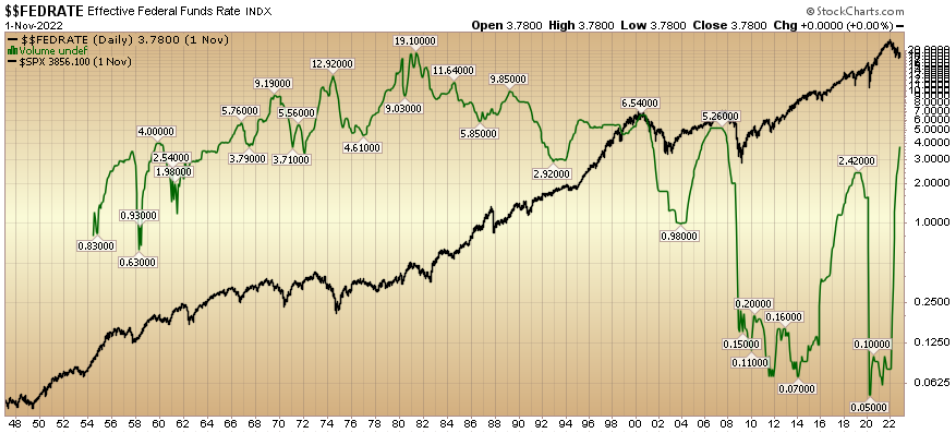
Rates:
Fed Funds Rate average has never been this low pre-financial crisis. Was 6.5% in late 90’s with much higher valuations. 19.5% in 1981. 9.8% in 1989. 5.1% in 1966. 12.9% in 1974.
Inflation Peaked in June:
Avg 12 mo forward return since 1950 (after inflation peaks) = +13.21%
INVESTMENT IDEAS
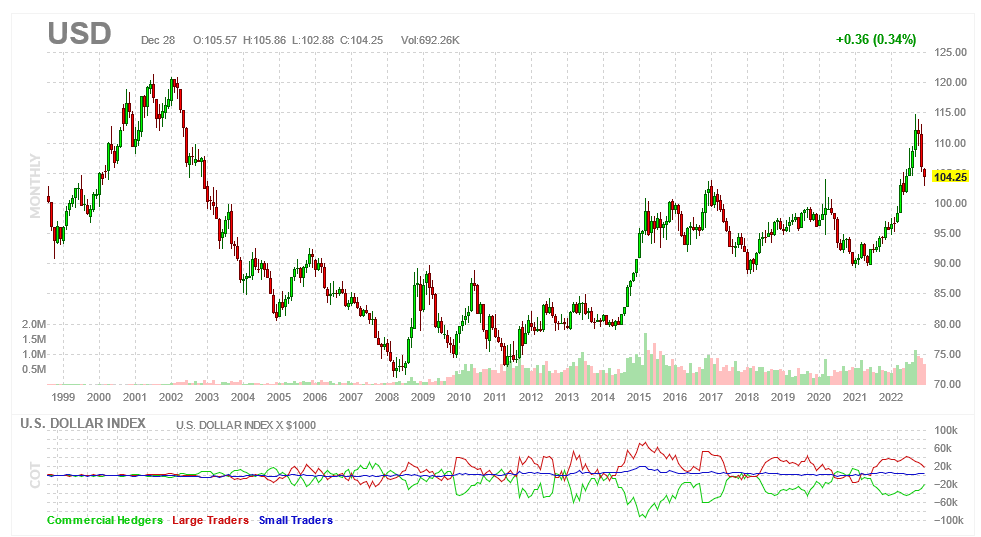
Emerging Markets:
Emerging Markets (EEM) now trading at 2007 prices. Historically trade opposite the $USD. When the Dollar stops going up as it did in 2002, 2009, 2016, 2020, you will see a monster rally in EEM – just as we saw:
+480% from 2002-2007
+189% from 2009-2011
+96% from 2016-2018
+97% from 2020-2021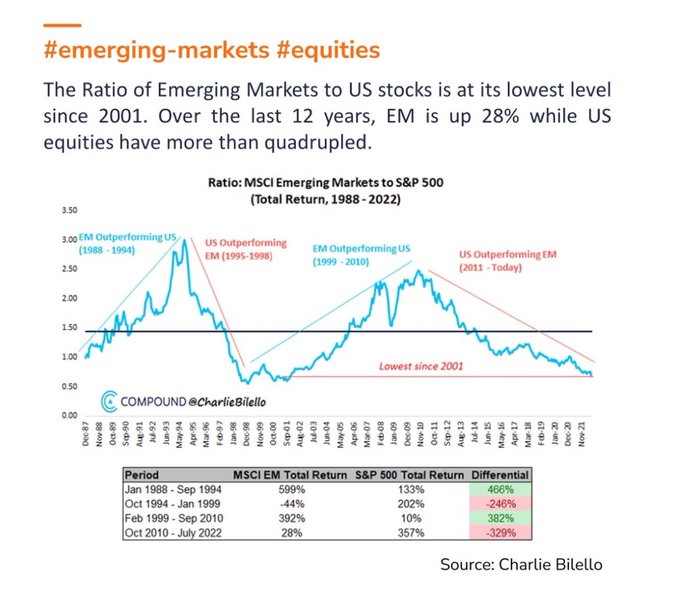
- Emerging markets will be the best trade over the next few years.
- U.S. dollar has fallen ~10% in last 2 months. This is key to emerging markets trade.
- People underestimating the impact of China’s abrupt reopening. They have done an about-face on Internet Platforms and want to support consumption.
- China set 5% GDP goal for 2023 last week.
- Inflation subsides as China reprises its role as a supplier of low-cost goods globally and supply chain bottlenecks ease.
- Rising tide lifts all boats. Weaker Dollar, more supplies, increased S&P earnings. Strong dollar hurt earnings 5-8% this year.
- Will follow through with aggressive monetary policy. “Forceful Stimulus”
- Can stimulate BIG as no inflation worries. They built energy storage (from Russia) and have low inflation.
- BABA and JD got positive review from PCAOB trip to Hong Kong.
- This will attract institutional investors back into the fold.
- As China is heaviest weight in Emerging Markets index, more money will flow into basket as China recovers quickly in 2023.
AMZN is back at 2018 levels despite:
AWS rev 2022 3x – +$80B (up from $25.7B in 2018)
Ad rev 2022 3x -+$35B (up from $10B in 2018)
E-commerce revenue doubled from 2018
Prime members 163.5M (up from 100M in 2018)
Alibaba. Buy at 2014 IPO levels. Revenues have grown 800%, Earnings 500% since. Alicloud 38% share of a sector that will triple by 2025 according to McKinsey. Where AWS was in 2016. Operating income will grow 66% (from peak) on this segment alone.
And finally, on Friday I joined Ann Berry on Public.com to discuss Inflation, China and Emerging Markets. Thanks to Mike Teich and Ann for having me on:
Now onto the shorter term view for the General Market:
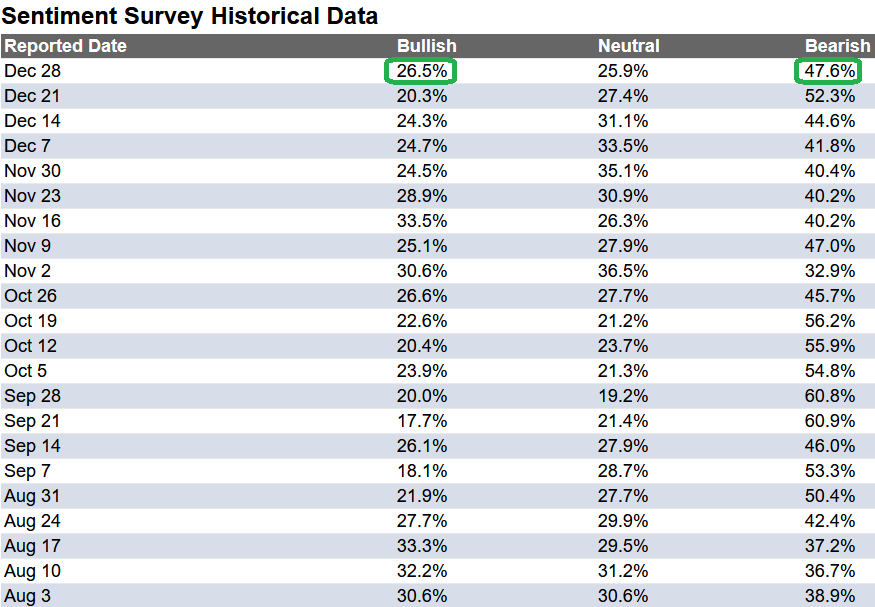
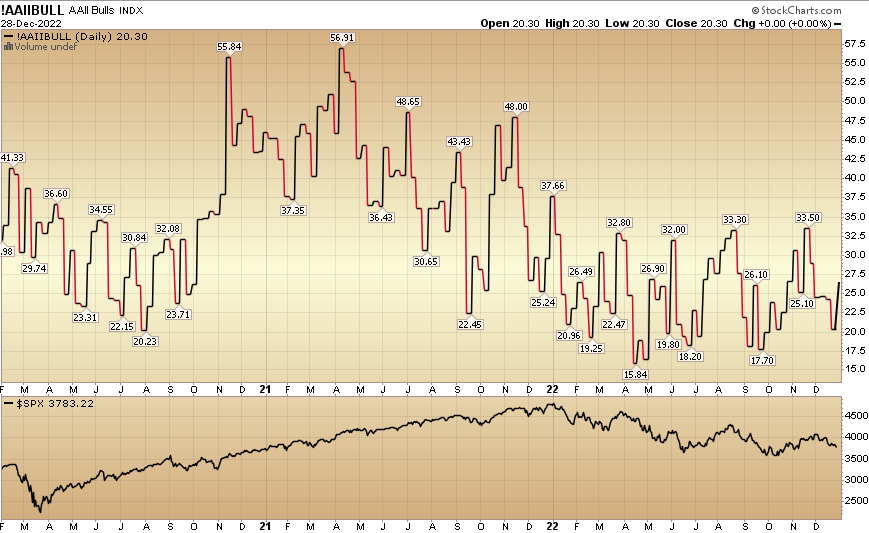
In this week’s AAII Sentiment Survey result, Bullish Percent (Video Explanation) rose to 26.5% from 20.3% the previous week. Bearish Percent fell to 47.6% from 52.3%. Sentiment is still weak for retail traders/investors.
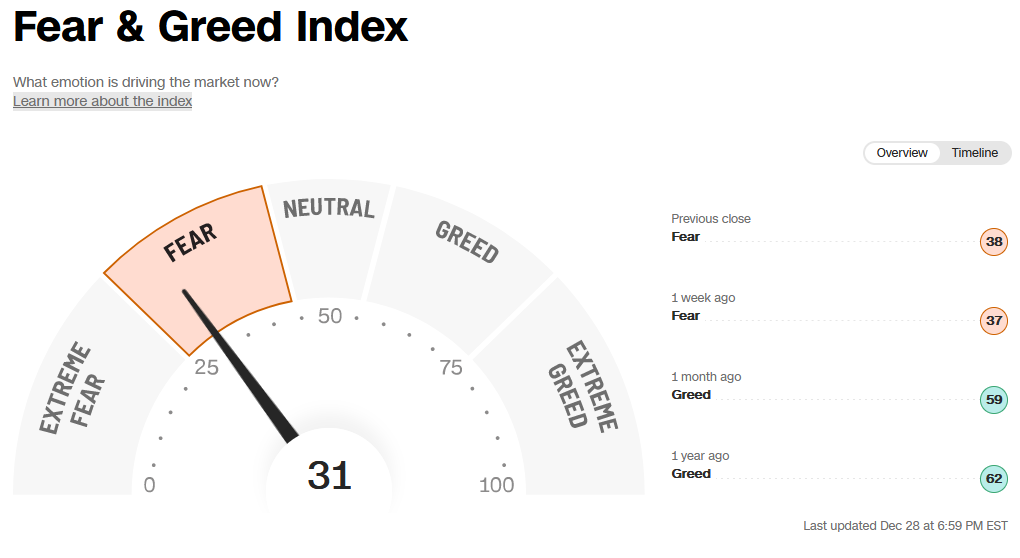
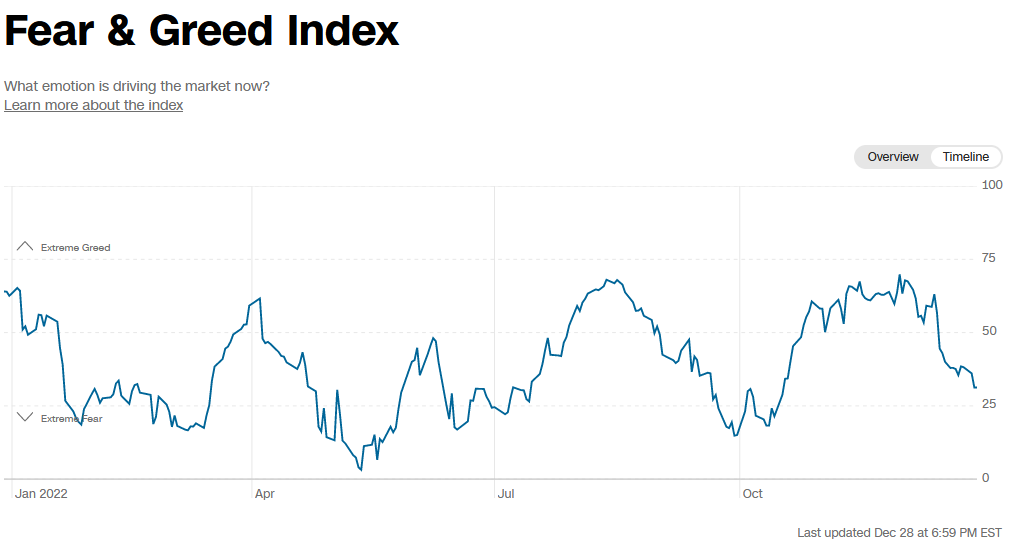
The CNN “Fear and Greed” dropped from 38 last week to 31 this week. Sentiment is fearful. You can learn how this indicator is calculated and how it works here: (Video Explanation)
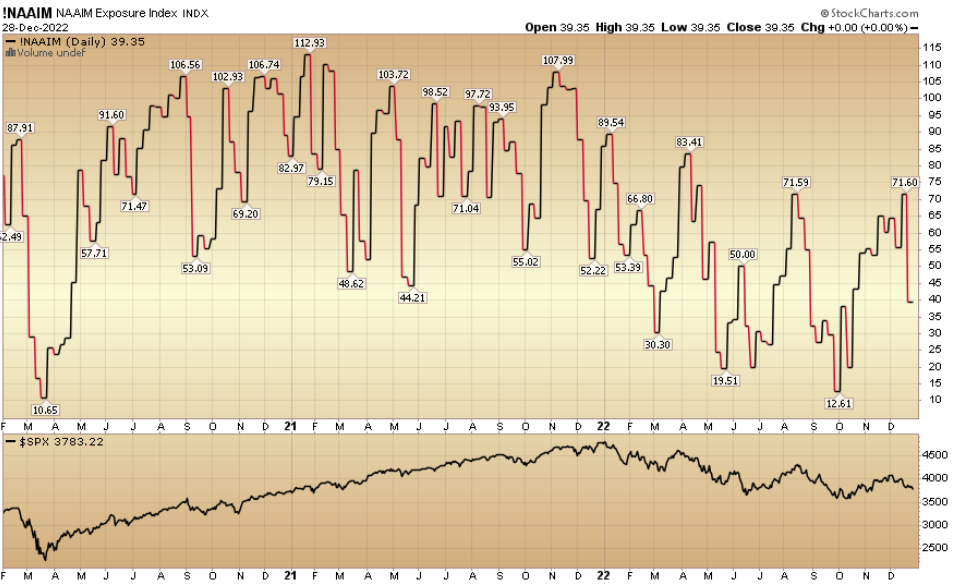
And finally, the NAAIM (National Association of Active Investment Managers Index) (Video Explanation) dropped to 39.35% this week from 71.60% equity exposure last week.
Our podcast|videocast will be out today or tomorrow. Each week, we have a segment called “Ask Me Anything (AMA)” where we answer questions sent in by our audience. If you have a question for this week’s episode, please send it in at the contact form here.
*Opinion, not advice. See “terms” above.


