
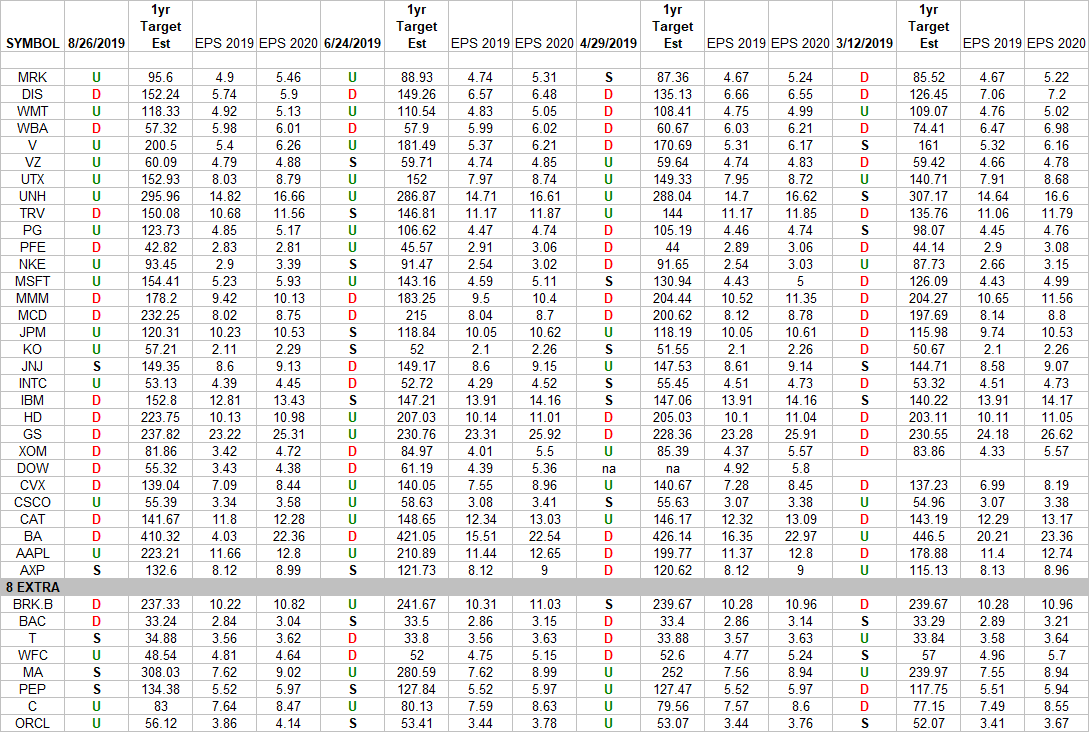
In the spreadsheet above I have tracked the earnings estimates for the DOW 30 PLUS 8 of the S&P 500 top 30 weights [that are not either included in the DOW 30 or in the top 30 weights of the Nasdaq]. The 8 companies are at the bottom of the spreadsheet under the heading “EXTRA”. The purpose of this is so we have up to date EPS earnings/revisions for the top 30 weighted stocks in the DOW, S&P500, Russell 2000, and Nasdaq.
I have columns for what the 2019 and 2020 estimates were: 3/12/2019, 4/29/2019, 6/24/2019 and today. The column under the date 8/26/19 has a letter that represents the movement in 2019 earnings estimates since the most recent print (6/24/19). “U” means 2019 estimates are UP in the last 67 days. “D” means 2019 estimates are DOWN in the last 67 days. “S” means 2019 estimates have remained the SAME in the last 67 days. The column entitled “1yr Target Est” is the Wall Street consensus 12 month price target for each stock. You can see how it has come up or come down in recent weeks.
What this table is telling us so far is that estimates have remained somewhat stable. More estimates came up for 2019 in the past 67 days than went down 17:16 ratio. The rest remained the same.
Something to keep an eye on: The cumulative 2019 earnings power of these 38 stocks was revised down by -4.8% in the past 67 days [HOWEVER, most of this downward revision is related to Boeing – which will take a short term EPS markdown in 2019 – and then fully recover its earnings power (backlog) run rate in 2020. WHEN YOU TAKE OUT BOEING, 2019 EPS is essentially flat in the last 67 days (down -0.77%)].


