
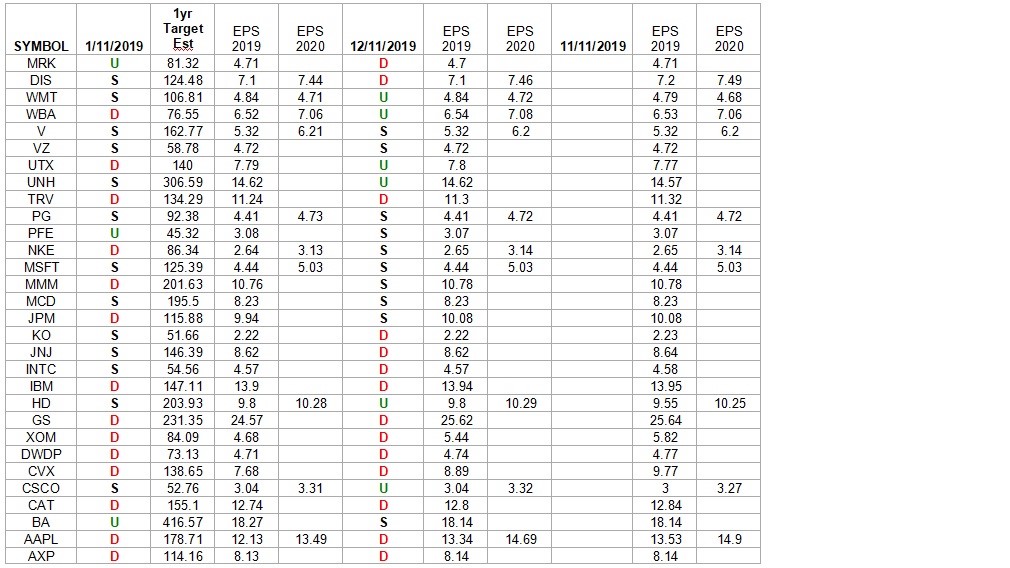
In the spreadsheet above I have tracked the earnings estimates for the DOW 30. I have columns for what the 2019 and 2020 estimates (if available) were: 60 days ago, 30 days ago, and this weekend (1/11/19). The column under the date 1/11/19 has a letter that represents the movement in estimates since the most recent print (30 days before 12/11/18). “U” means 2019 estimates are UP in the last 30 days. “D” means 2019 estimates are DOWN in the last 30 days. “S” means 2019 estimates have remained the SAME in the last 30 days. The column entitled “1yr Target Est” is the Wall Street consensus 12 month price target for each stock.
What this table is telling us so far is that despite the dramatic dislocation in price in December, estimates have remained relatively stable so far. We will know more in coming weeks as companies provide guidance in their earnings reports.


