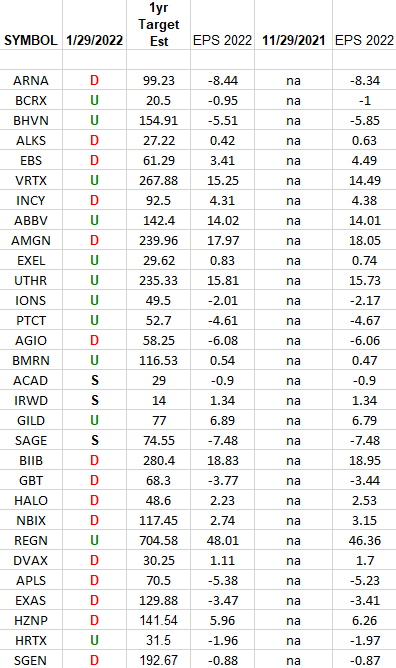
In the spreadsheet above I have tracked the earnings estimates for the Equal Weighted Biotech ETF (XBI) top 30 holdings. Last week I tracked the Market Cap Weighted Biotech ETF (IBB) to 30 weights here:
The column under the date 1/29/2022 has a letter that represents the movement in 2022 earnings estimates since the most recent print (11/29/2021). “U” means 2022 estimates are UP in the last 60 days. “D” means 2022 estimates are DOWN in the last 60 days. “S” means 2022 estimates have remained the SAME in the last 60 days. The column entitled “1yr Target Est” is the Wall Street consensus 12 month price target for each stock.
What this table is telling us is that estimates have moved down infinitesimally in the past 60 days. More estimates came DOWN for 2022 in the past 60 days than went UP. DOWN:UP 15:12 ratio. The rest remained the same.
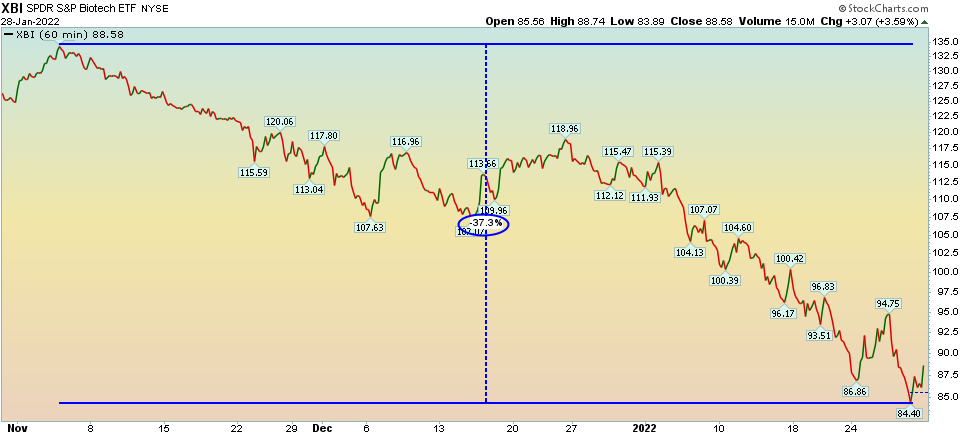
The cumulative 2022 earnings power of these 30 stocks was revised DOWN by –0.41% in the past 60 days ($108.23 vs $108.68). During this time frame, the XBI ETF fell over ~37%.