
Data Source: Bank of America Merrill Lynch
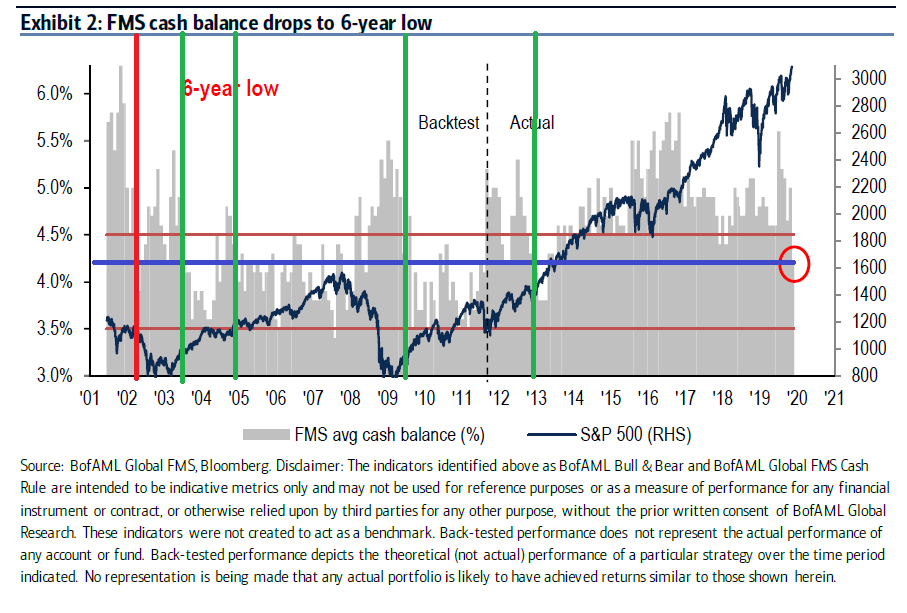
This morning, the monthly Bank of America Merrill Lynch Global Fund Managers Survey was published. The key point that is being focused on is the fact that cash levels have dropped dramatically in the past 30 days (from 5% to 4.2%). Additionally, equity positioning jumped 20% – to 21% overweight. This was a one year high.
The implication is that managers are now euphoric and are chasing the market into year end – which we had been anticipating since mid-August when money was piling into bonds and cash. You can see our previous notes from August/September when we were calling for a possible “melt up” into year end:
Weekly Sentiment/Market Commentary Articles
Looking at the chart above, Fund Managers’ cash levels dropped .80% to 4.2% – hitting their lowest level since June 2013. Many are viewing this move as proof that euphoria is here and that the market should now correct/crash.
We decided to look a bit closer at the data and make some annotations on the chart – identifying the previous times that cash levels had dropped from above 5.25% to 4.20% very quickly. In 4 out of the last 5 times this happened (green vertical lines), we were at the EARLY stages of the rally, not the end.
The exception was in 2002 (red vertical line), however at that point the market was already in a downtrend. Having just broken out to new all-time highs, we are in an uptrend, not a downtrend.
As we said in our note on Thursday “The Katy Perry Stock Market (and Sentiment Results),” the short term overbought readings showing up on numerous indicators can either correct in price (mini-shakeout/pullback) or time (grind sideways for a few days/week) to work off the overbought condition.
However, due to market structure and positioning into year-end, the odds continue to favor higher prices into/by year-end as the conditions are in place for a possible “PINNING” of indicators – like we saw in Q4 2016 and Q4 2017. You can find the VideoCast and “Katy Perry” article referenced here:
HFT VideoCast – Stock Market Commentary and Weekly Recap – Episode 2
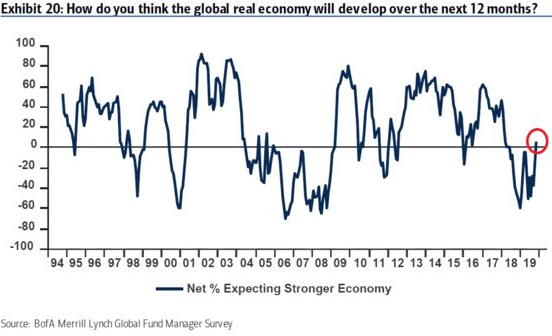
Growth expectations jumped 43 percentage points to a net 6 percent of fund managers expecting global growth would improve in the next year (see chart above). This was the biggest 30-day jump since the last “mid-cycle adjustment” we experienced in 1994.
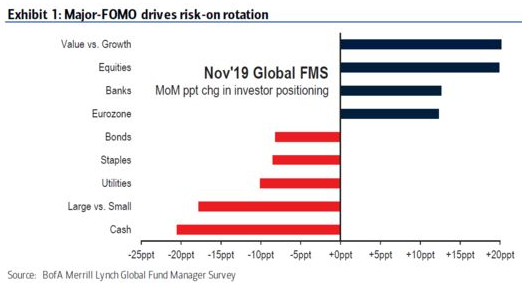
As you can see in the table above, the move to equities was offset by a move out of Bonds, Utilities, Staples and Cash (Defensives).
Allocation to U.K. equities meaningfully improved on moderating Brexit concerns, with global fund managers now 21% underweight the country’s stocks, from 32% underweight last month.
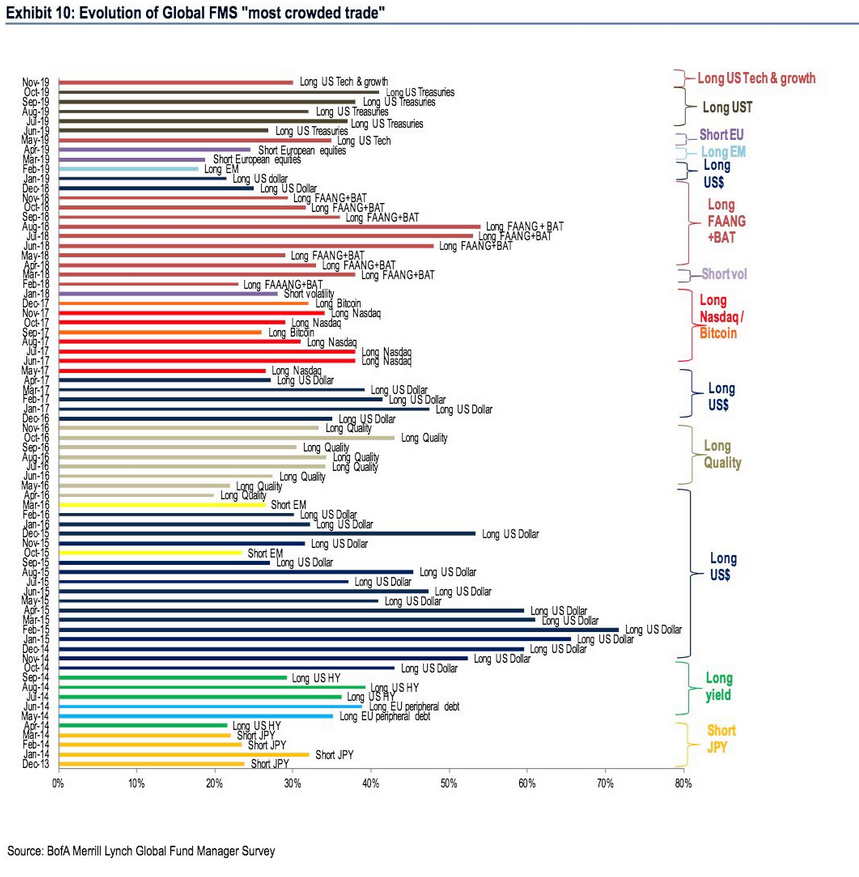
The most crowded trade from October – Long Treasuries (above) started to unwind a bit in recent weeks.
The top worries among managers were: Trade war, bond market bubble, monetary policy inefficacy and a China slowdown.
37% of fund managers expect the U.S. dollar to depreciate over the next 12 months. This was the weakest outlook since September 2007. The Dollar depreciated 11.3% in the following 8 months. If this trend repeats, it would help US earnings in 2020.
The survey had 178 participants with $574 billion in assets under management, with the survey period covering November 1-7.


