

“She Had Me at Heads Carolina” is a song co-written and recorded by American country music singer Cole Swindell. The song contains lyrical and melodic references to Jo Dee Messina’s 1996 debut single “Heads Carolina, Tails California”, and credits that song’s writers Mark D. Sanders and Tim Nichols as co-writers. The song peaked at number 16 on the Billboard Hot 100, Swindell’s highest charting appearance to date. (Source: Wikipedia)
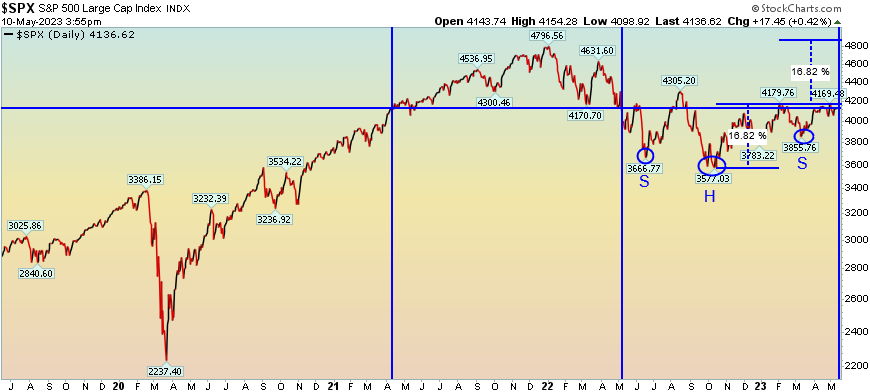
As we have covered in recent weeks, the stock market as a whole is currently at the same levels today as it was 12 months ago AND 24 months ago. We have spoken about the “wall of worry” the market has been climbing since the June and October lows. The worries never end, but the market pushes higher. Like Cole Swindell, it didn’t matter whether they wound up in California or Carolina, the key was they were together. Our view is the market will push higher over time, regardless of the new “worries” that are thrown at it on a daily basis. The “bad news” was priced in last year.
“Heads Carolina, tails California”
Maybe she’d fall for a boy from South Georgia
She’s got the bar in the palm of her hand
And she’s a ’90s country fan like I am
Hey, I got a Chevy, she can flip a quarter
I’d drive her anywhere from here to California
When this song is over, I gotta find her
‘Cause she had me at “Heads Carolina”
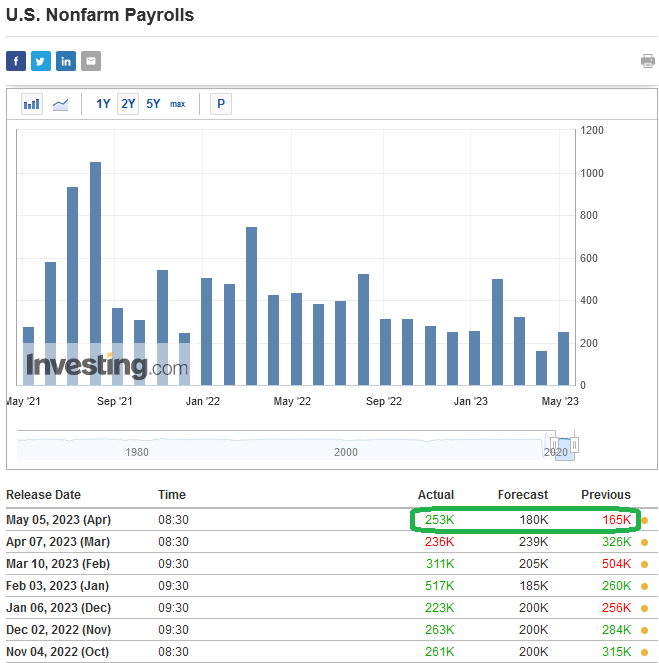
Last month the market was worried about earnings. They came in better than expected. Last week the market was worried about the Fed. Powell implied he may be at a pause. Just a few days ago the market was worried about recession. The jobs report shot the lights out to the upside. This week the market was worried about high inflation. It came in lower than expected. Next week we will worry about the debt ceiling. Guess what? They will kick the can down the road and raise the limit.
I discussed this last night on CGTN America with Phil Yin. Thanks to Phil and Ryan Gallagher for having me on:
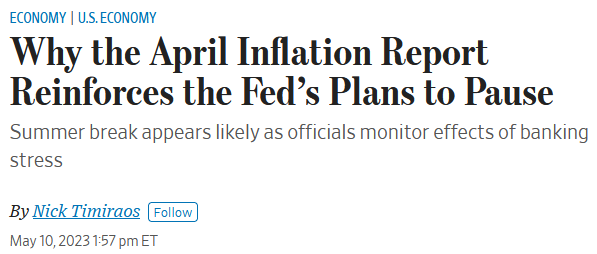
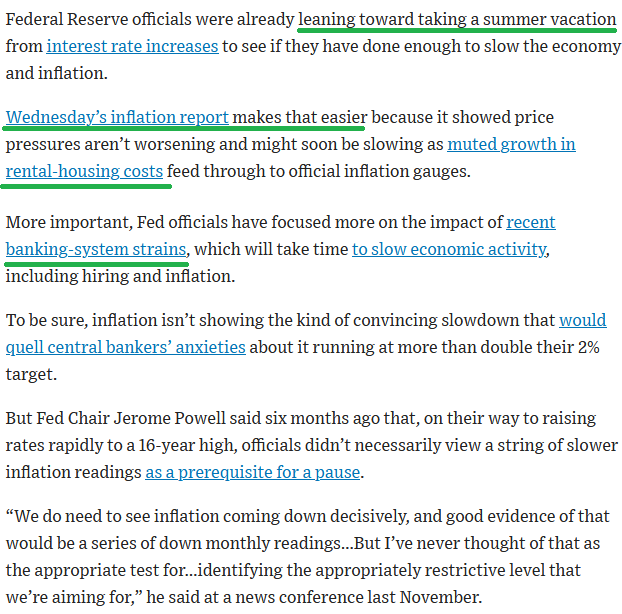
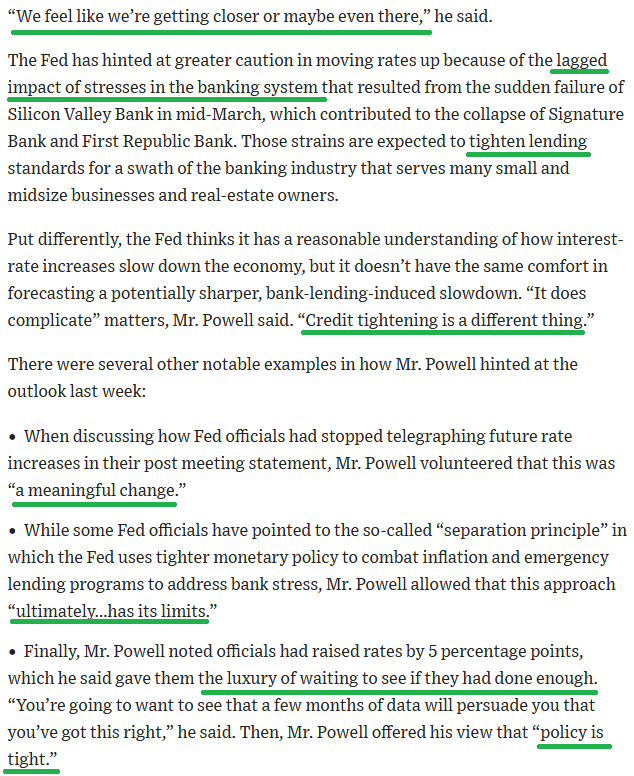
Yesterday the market did a reversal (down to up) on the basis of the “Fed Whisperer” Nick Timiraos publishing an article at the Wall Street Journal that confirmed the “pause”:
Inflation
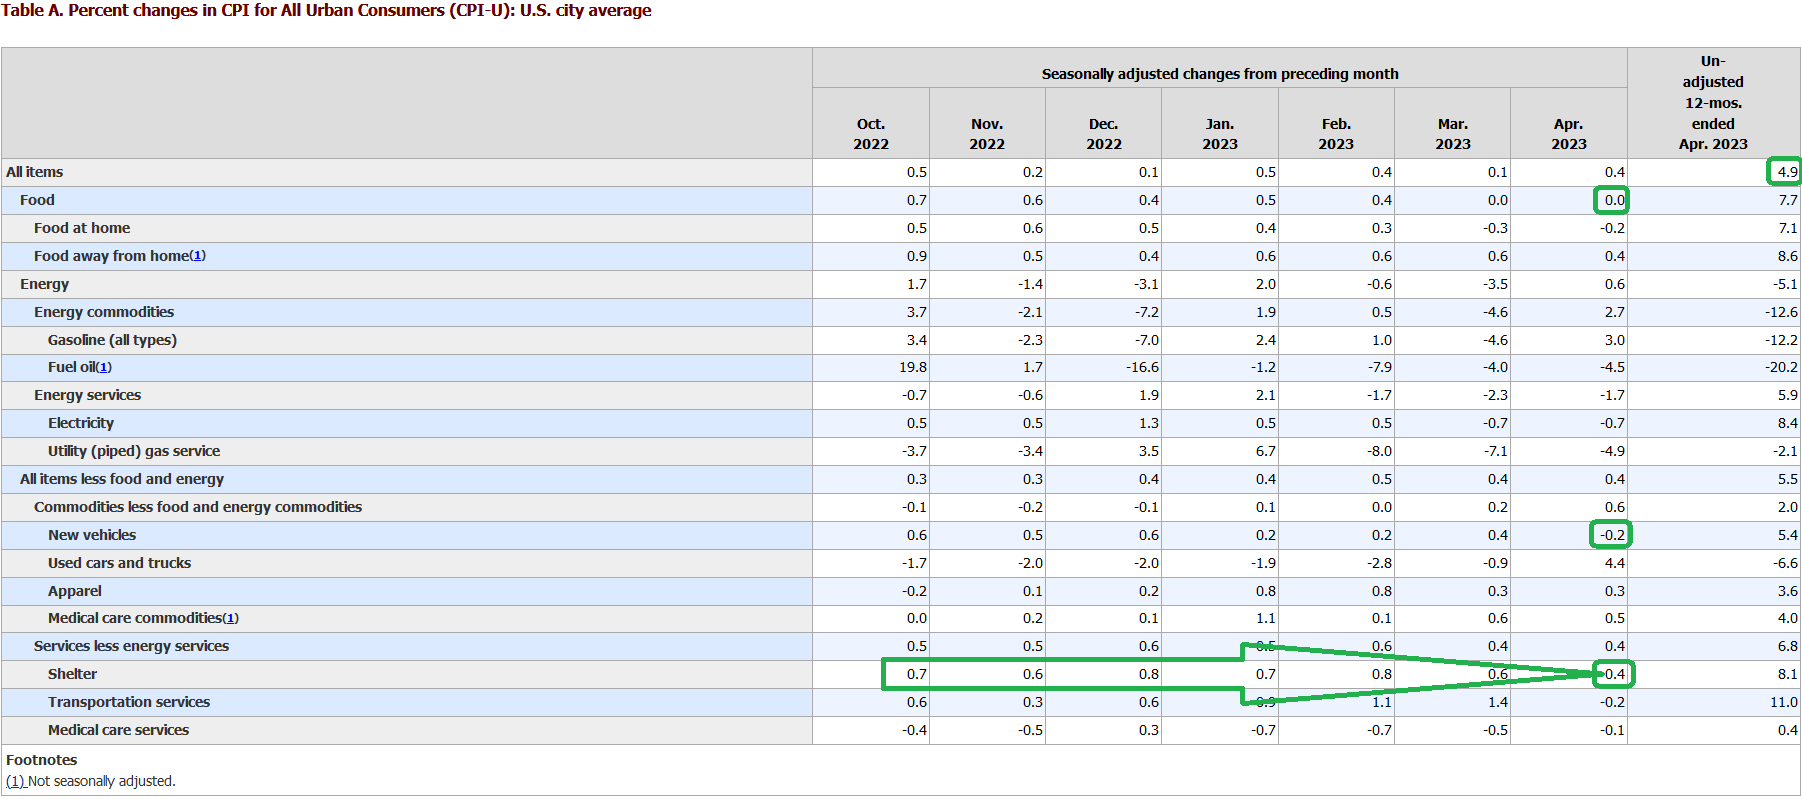
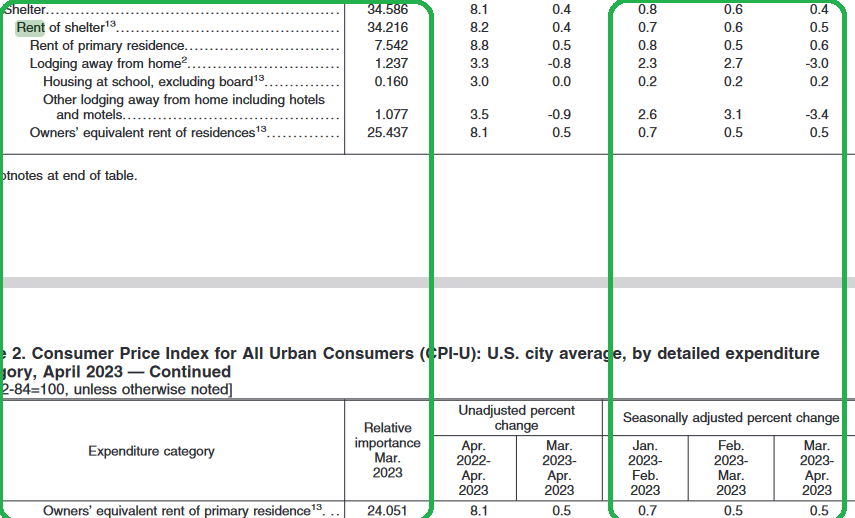
In Wednesday’s report, the most important change was the fact that Shelter/Rent inflation finally PEAKED! We have been saying for months on the podcast|videocast that this would begin and then accelerate in May, June and July. It happened with the April numbers on Wednesday:
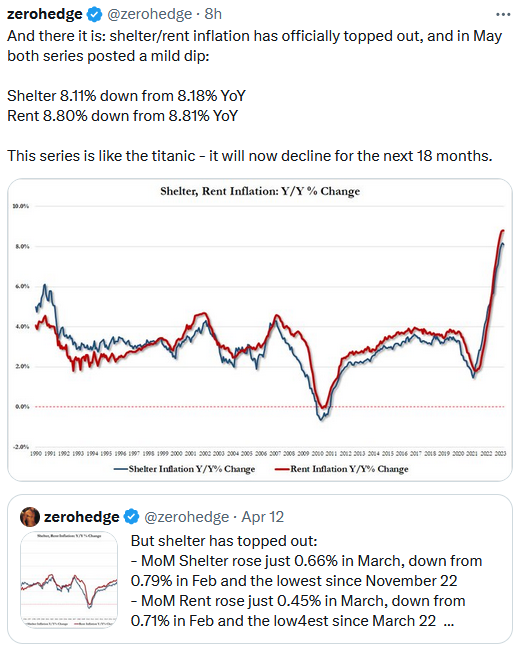
-MoM Shelter rose just 0.4% in April, down from 0.6% in March and 0.8% in April
Currently, ~40% of inflation components are now in DEFLATION.
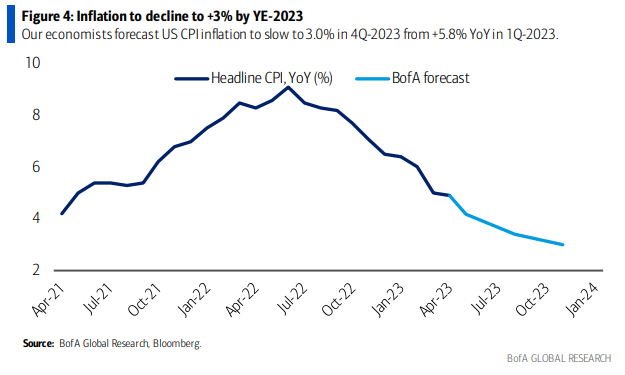
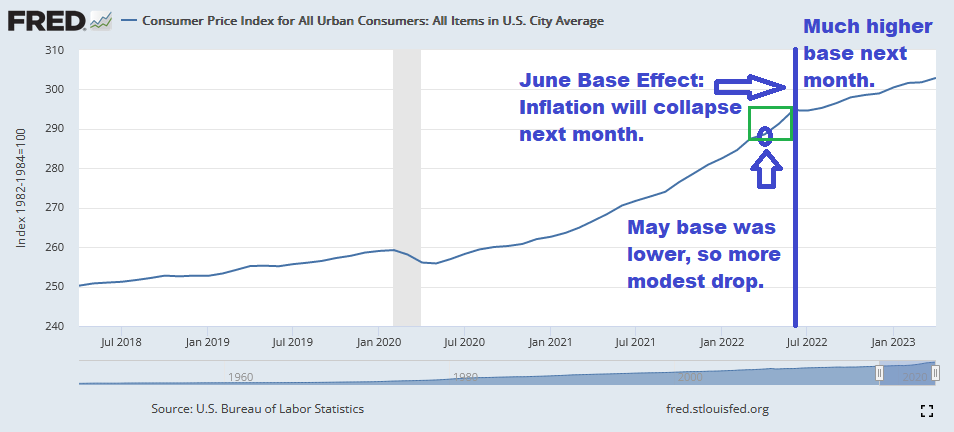
The chart below is the most important in this article. The CPI number reported on Wednesday was off a low base, which is much lower than the June base will be. So even if inflation were to run hot at 0.50% MoM, through June, the YoY June inflation number will be ~3.4%. If inflation runs FLAT, we could see a 2 handle (mid-high 2’s)! This is why I have been saying for months, “watch what happens in the May, June, July inflation reports.”
 Earnings
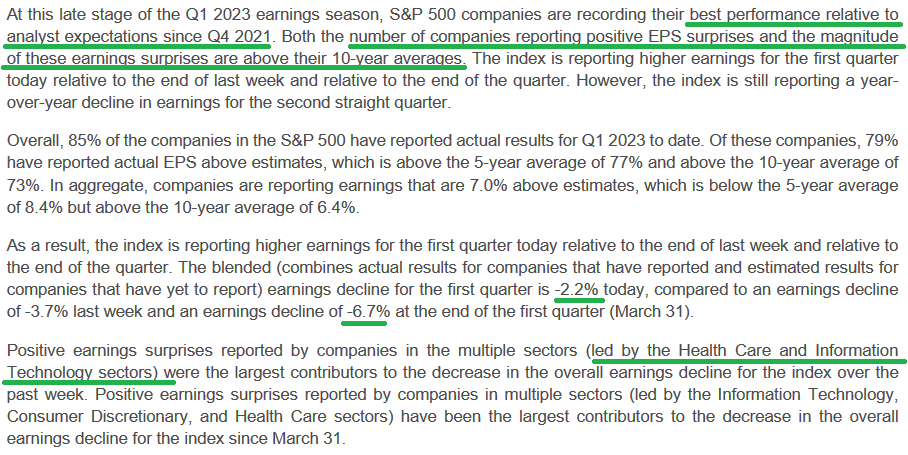
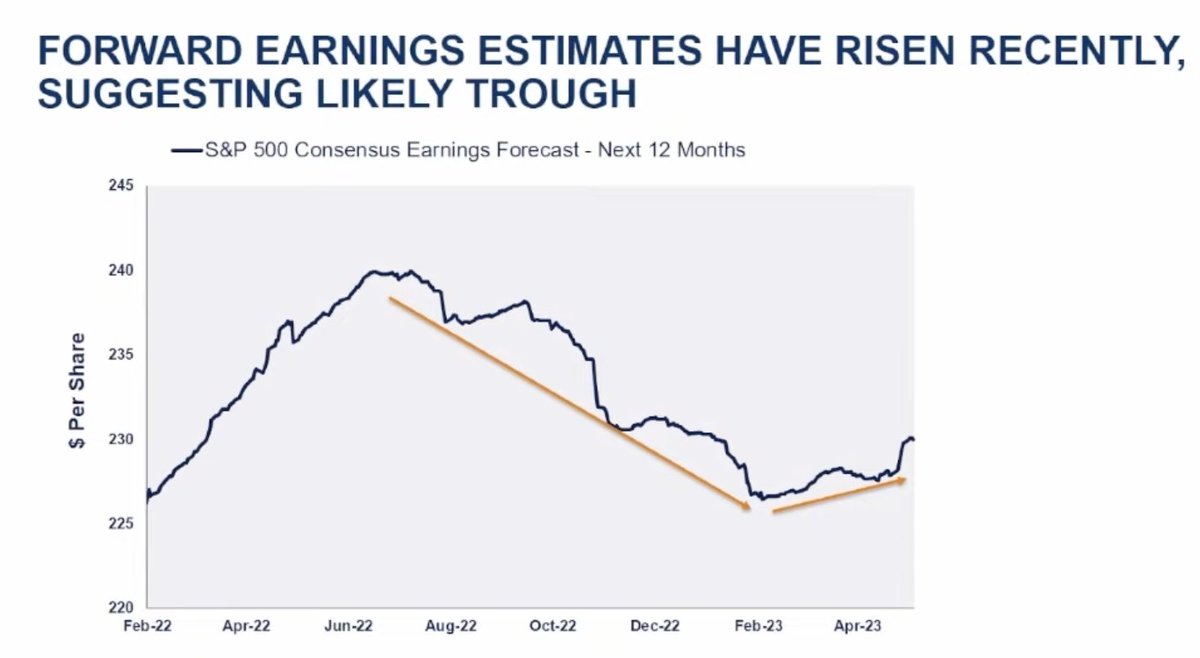
The stock market is a discounting mechanism. The weakness we are seeing the 1H 2023 was amply discounted by the 27% peak to trough correction in the S&P 500 in 2022. Q1 earnings have come in well above expectations at -2.2% versus expectations at March 31 or -6.7% (with over 85% reported). This is the highest out-performance relative to expectations since Q4 2021. As a result of this dramatic beat, the market is re-calibrating with new information and the result has been forward earnings expectations climbing in recent weeks – following months of decline.
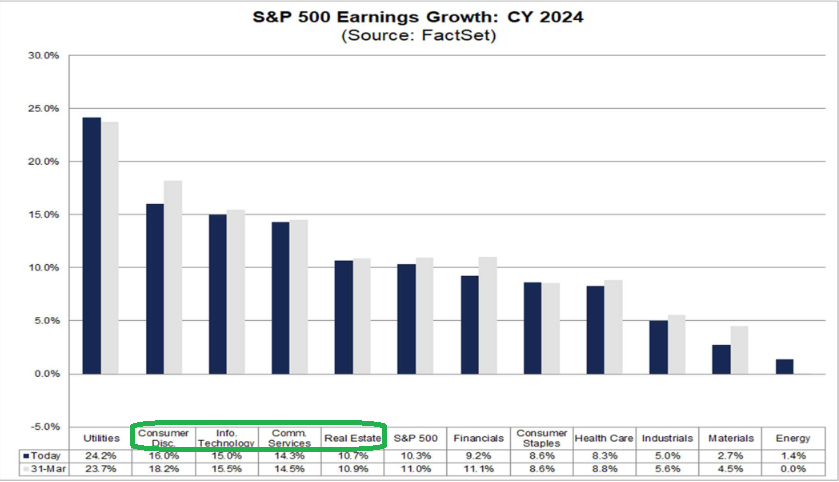
As for the Tech sector, Apple was a big contributor reporting $1.52 vs. $1.43. Microsoft and Intel’s beats also played a significant role in the improvement. Their results bolstered the sector’s earnings decline from -15.1% estimated to -10.6% actual. For Q2, Tech sector estimates are currently for -6.8%, but this is “known” information and the market will start to look forward to the 2024 earnings recovery in coming months – just as it looked forward to the 2023 weakness in 2022. We remain constructive on the markets and Tech sector. Any short-term seasonal weakness or market chop will be an opportunity to add high quality businesses to our portfolio.
2024 EPS Est. = $246+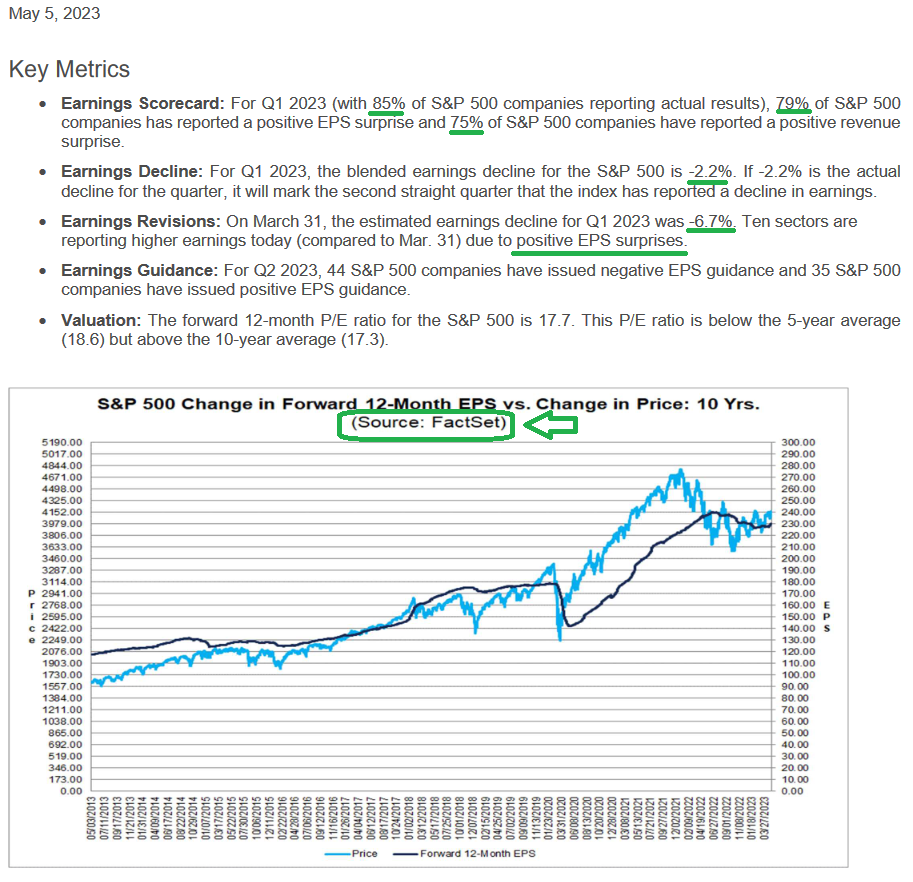
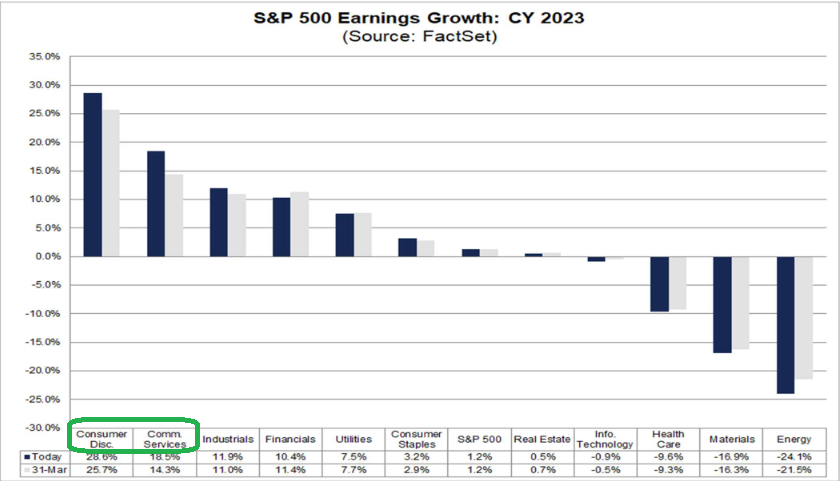
 Source: Factset
Source: Seth Golden
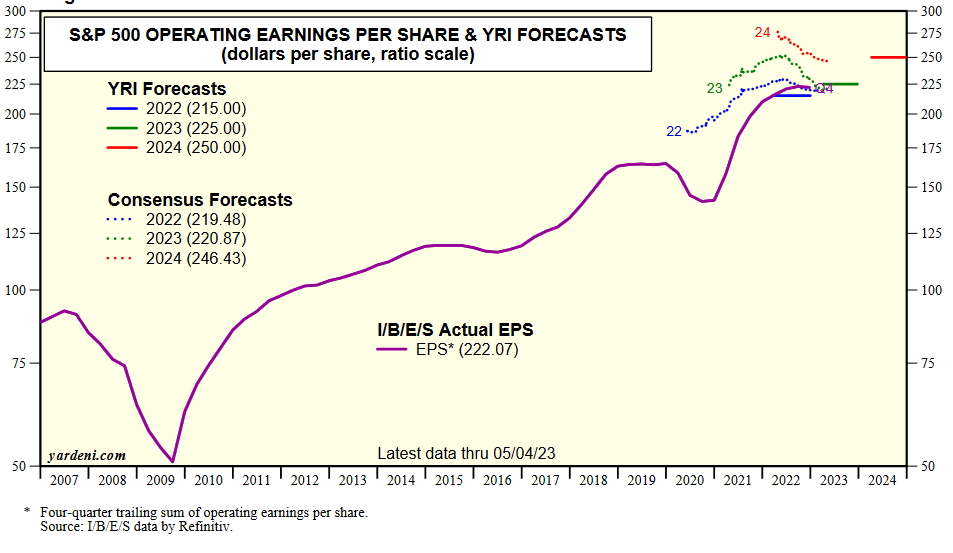
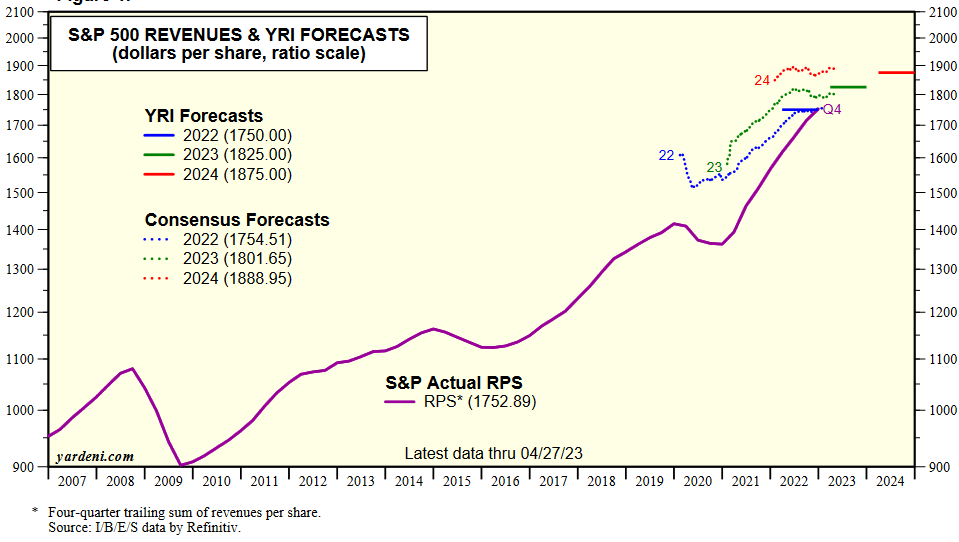
Source: Yardeni
Jobs
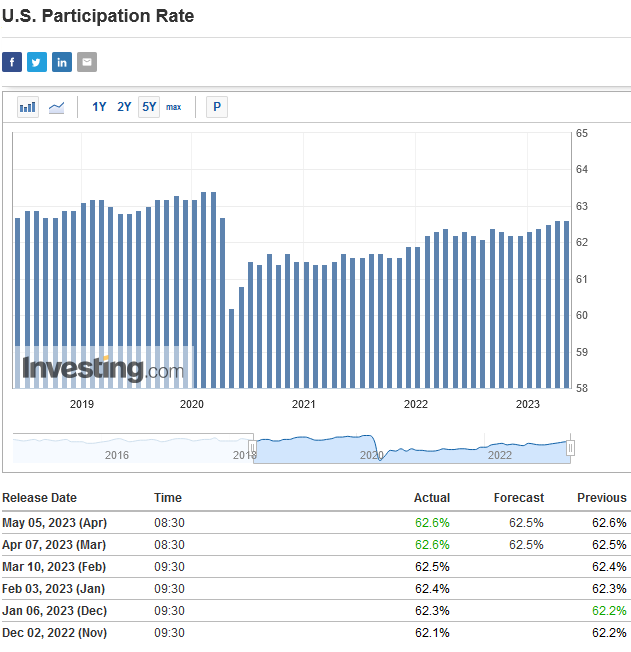
The most important number in Friday’s report was “Labor Force Participation Rate.” As consumers spend down their excess savings from the pandemic stimulus, they are returning to work. This is critical for a sustained recovery and a moderation of wage growth (more supply of labor = less inflation from wages).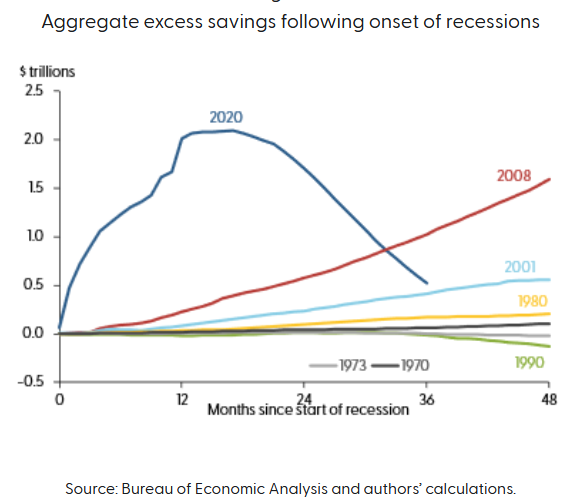
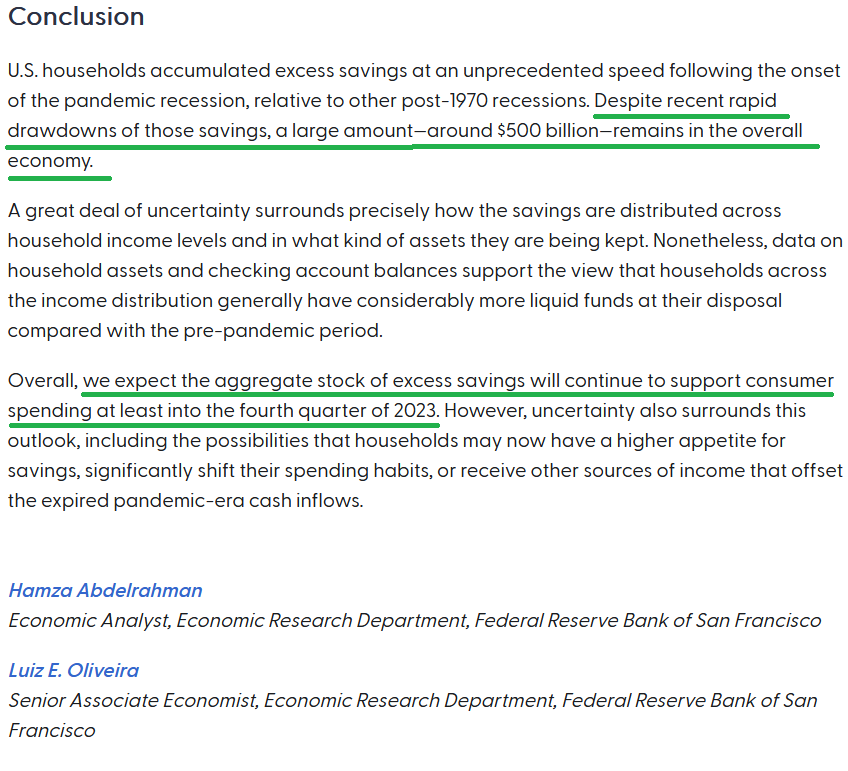 Source: San Francisco Fed – May 8, 2023
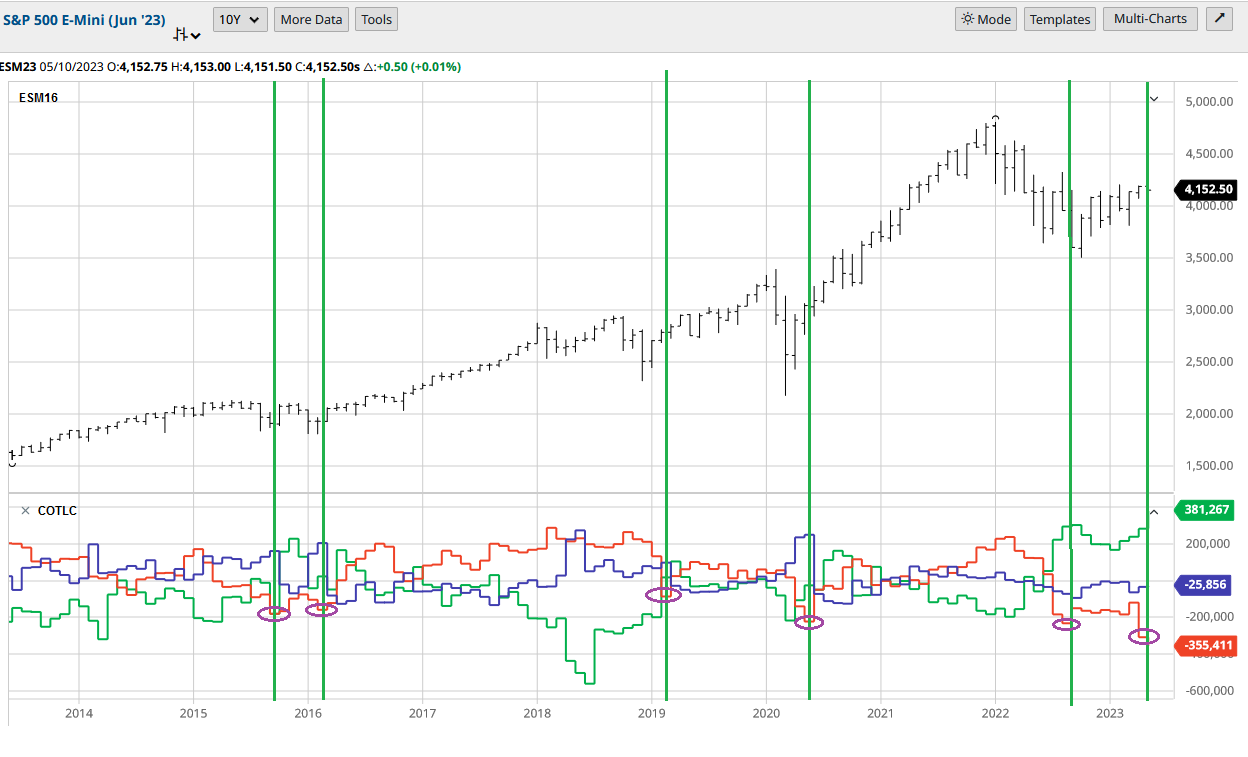
Positioning
Still Pessimistic. At levels where “rip your face off” rallies are born:
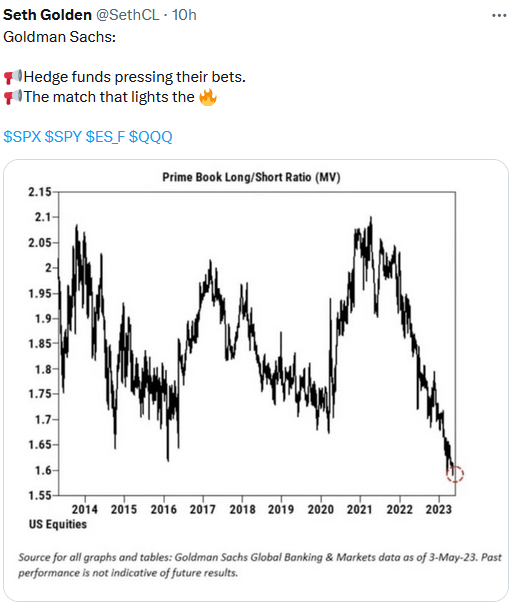
Tom Hayes via BarChart
Yesterday morning I joined VP/Editor-in-Chief at MoneyShow Mike Larson to discuss US Markets Outlook as well as the major opportunity Emerging Markets/China. Thanks to Mike for having me on. Of note, I will be speaking at the MoneyShow in Las Vegas, NV on August 8. The full conference lasts from August 8-10:
 For Details on the “Investment Masters” MoneyShow Symposium – Click Here
Watch my interview with Mike and a preview of my August presentation here:
China/Alibaba Valuation
For more on the Fed and its impact on Emerging Markets I joined Ade Safrina on CNBC “Closing Bell” Indonesia this morning. You can watch it here:
Key Summary Points on China:
-S&P 500 10yr performance 12.06%
-Emerging Markets 10yr performance 1.80%
-Playing the reversion trade. After a 480% return from 2001-2007, the Emerging Market index has gone sideways for 16 years (no progress).
-Emerging Markets outperform when dollar weakens. We saw first leg from October lows as dollar peaked.
-USD will trend lower in fits and starts as Fed wraps up this tightening cycle.
-MSCI Emerging Markets index China/Taiwan is 46.16% of the weighting.
-China Demographics: Eco boom (largest percent of population) 33-36 years old. Family formation, housing formation.
-Demographics historically drives consumption and growth until people hit ~40 (4-7 more years of growth before demographic cliff).
-China has been open/unlocked for just 4 months and GDP exceeded expectations at 4.5% (vs. 4% est) for Q1.
-Following avg. mid-single digit earnings growth for 3 yrs:
-18.1% est Earnings Growth 2023
-14.6% for 2025
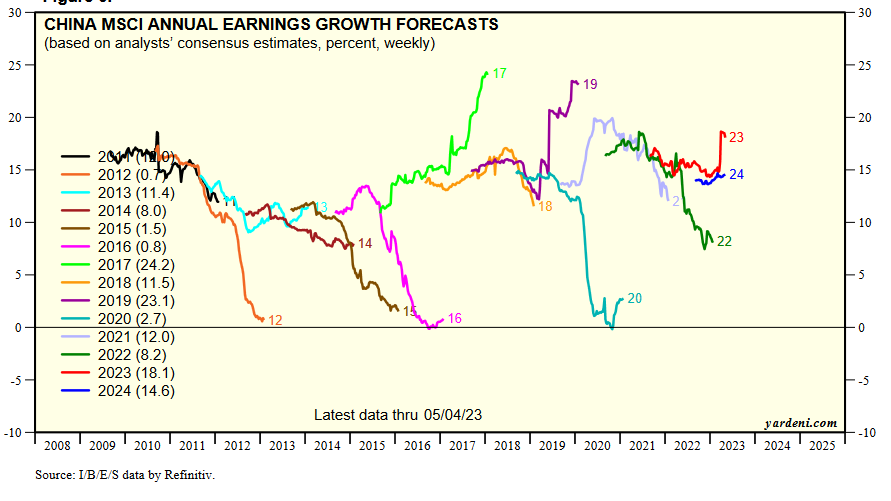

-10.2x forward P/E versus 18x for S&P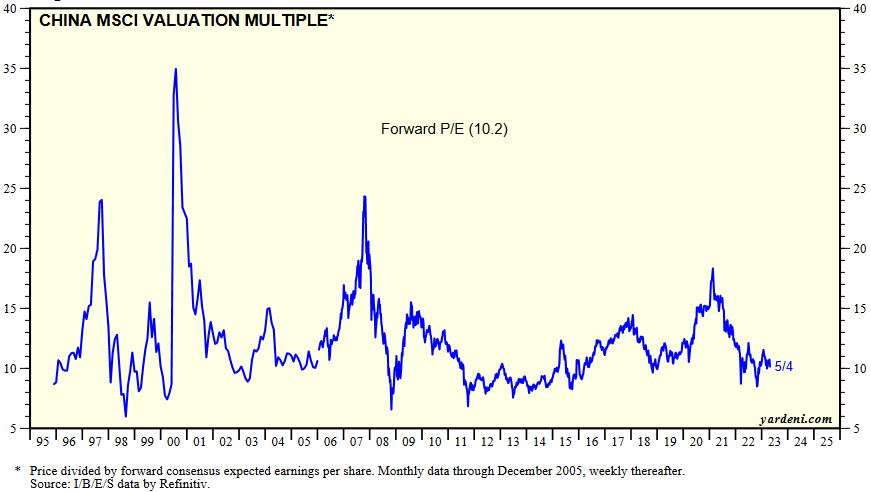
-US and China are interdependent. They will have to work together to progress.
-Credible experts put invasion of Taiwan at 5+ years out – if ever.
-Hang Seng price to book dipped below 1x.
Last few times valuations got this low, rebound in index was:
1998: 156.46% in 17 months
2008: 110.77% in 21 months
2016: 82.52% in 23 months
2020: 35.99% in 11 months
In past podcasts|videocasts we have alluded to our “sum of the parts” analysis of Alibaba at ~$280-$320 per share (base case). Upside and multiple expansion could yield more.
Now the market is confirming our long held estimates as the restructuring takes shape:
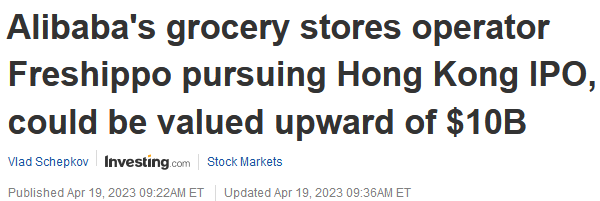
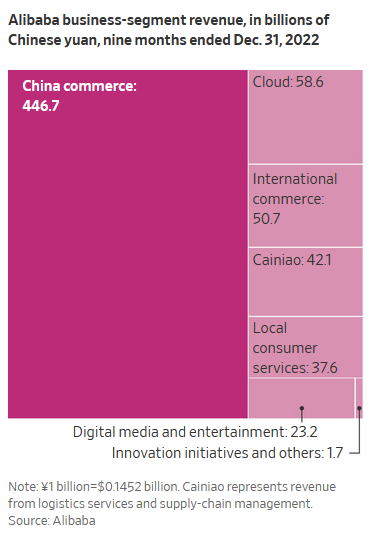 Freshippo (Potential Costco of China): ~$10B
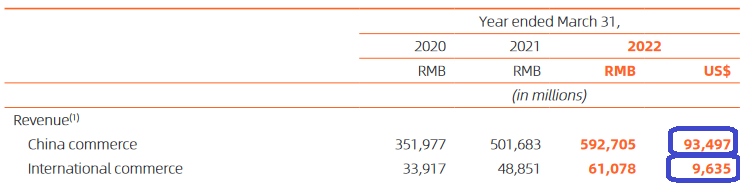
Global Online Commerce (Lazada/AliExpress): ~$39B

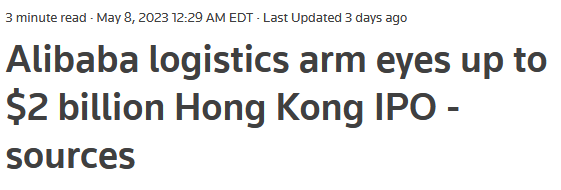
Cainiao (Logistics Business): ~$2B
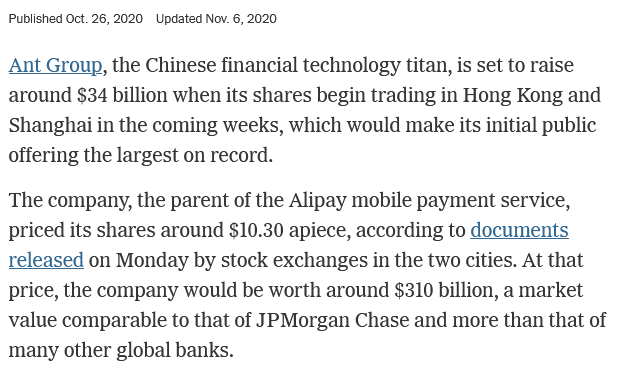
 Ant Financial Group ($310B IPO valuation pre-crackdown). Cut in half due to crackdown ($150B). BABA 1/3 ownership: ~$50B
Domestic/China Online Commerce (Tmall/Taobao): ~$390B
10x the size of Global Online Commerce (IPO’ing at $39B val).
Aliyun (AliCloud): ~$200B
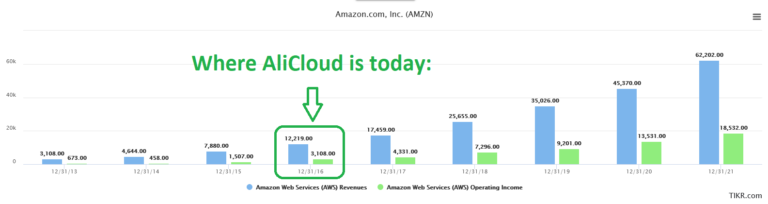
 AliCloud Now: 11.8B Rev. 180M Operating Income.
Amazon AWS 2016: $12.2B Rev. 3.1B Operating Income.
Amazon AWS 2021: $62.2B Rev. 18.5B Operating Income (29% operating margin).
- McKinsey expects China’s public cloud market to triple in size in the next few years, from US$32 billion in 2021 to US$90 billion by 2025 (SCMP Article Here)
- BABA – 36.7% share of China’s public cloud IaaS (Infrastructure as a service) and PaaS (Platform as a service)
- Amazon comp: 29% operating margin on AWS business (at scale).
- $90B public cloud x 36.7% share = 33.3B x 29% operating margin (at scale) = ~$10B of NEW OPERATING INCOME FOR ALIBABA.
- This compares to its total current operating income of 15.2B or peak operating income of 16.7B. In other words if the other businesses stopped growing, the operating income would be 60% greater than when the shares traded at $319 on US ADS. At a peak multiple that implies a ~$500 stock assuming no growth in China or International Commerce. Cut it in half and you’re still over $250 by 2025.
Miscellaneous (Digital Media, Local Consumer Services, Innovation): ~$15B
Cash: ~$70B
In total: 70+15+200+50+390+2+39+10 = ~$776B =
~$301 per share. This assumes multiples DO NOT expand back to peak levels and growth (excluding Aliyun) remains at subdued covid levels (unlikely).
MORE Upside if you believe growth will return to core business and multiples will expand.
***IF YOU BELIEVE CHINA WILL INVADE TAIWAN IN THE NEXT 5 YEARS, THEN YOU HAVE A LOT MORE THAN ALIBABA TO WORRY ABOUT. APPLE WILL BE CUT IN HALF (AT LEAST) IN THAT SCENARIO AS THE BULK OF THEIR SUPPLY CHAIN/LABOR AND MEANINGFUL PART OF THEIR GROWTH STORY IS IN CHINA. THE IMPACT TO THE S&P 500 WOULD BE EQUALLY SIGNIFICANT. IT IS NOT A SENSIBLE REASON TO AVOID ALIBABA. IF YOU HAVE THAT CONCERN, YOU SHOULD AVOID ALMOST EVERY STOCK CHINESE OR OTHERWISE. OPINION NOT ADVICE.
Alibaba reports earnings on May 18.
Now onto the shorter term view for the General Market:
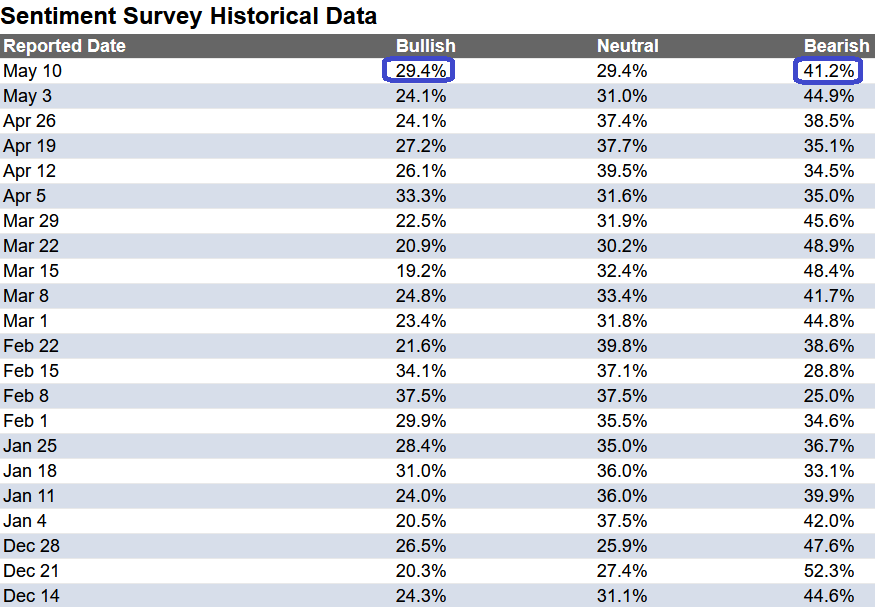
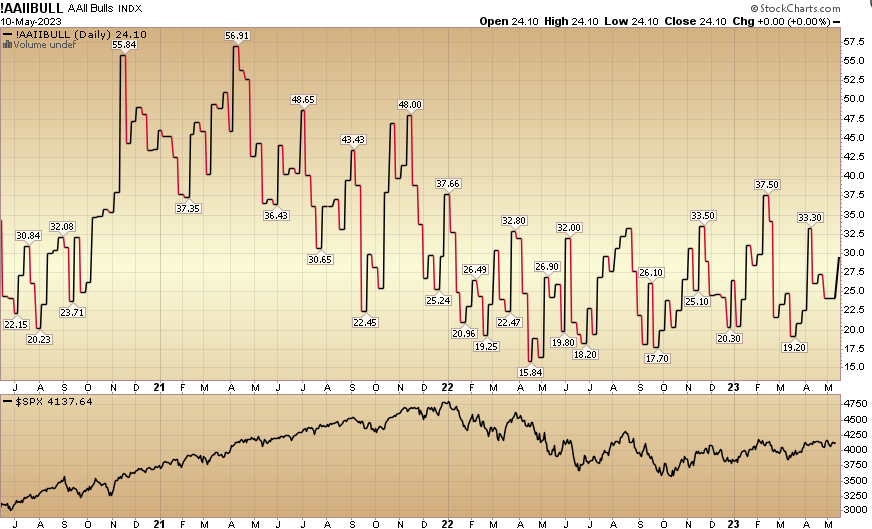
In this week’s AAII Sentiment Survey result, Bullish Percent (Video Explanation) moved up to 29.4% from 24.1% the previous week. Bearish Percent moderated to 41.2% from 44.9%. The retail investor is still worried.
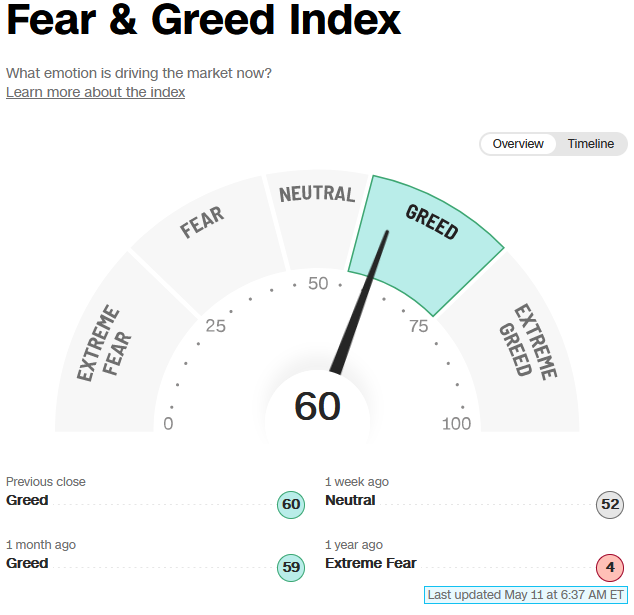
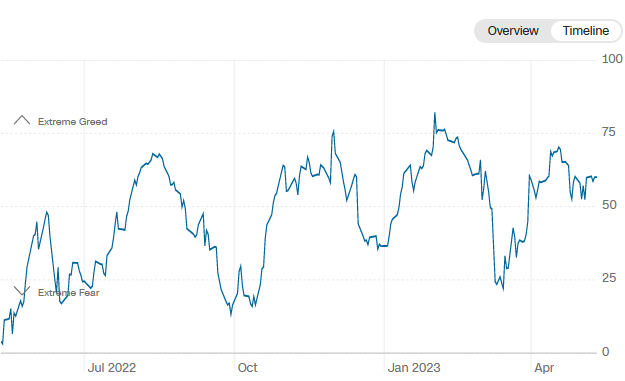
 The CNN “Fear and Greed” rose from 52 last week to 60 this week. Sentiment is moving up. You can learn how this indicator is calculated and how it works here: (Video Explanation)
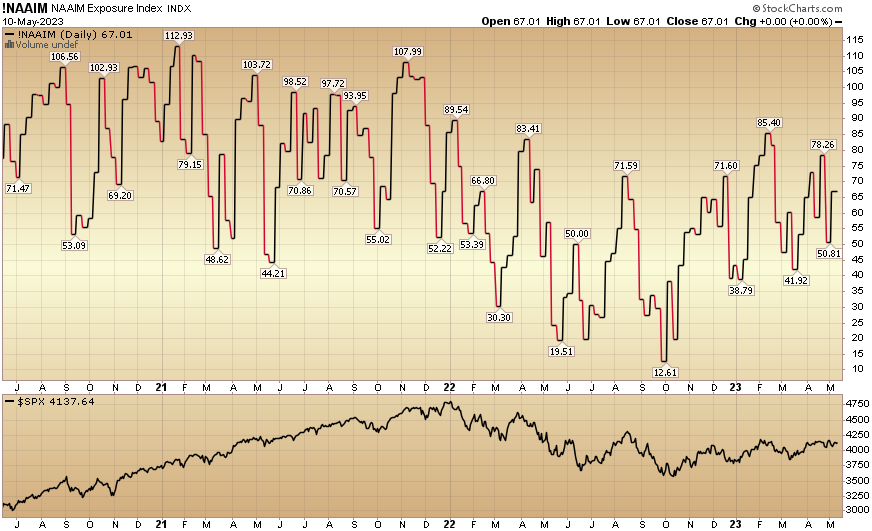
 And finally, the NAAIM (National Association of Active Investment Managers Index) (Video Explanation) rose to 67.01% this week from 50.81% equity exposure last week.
Our podcast|videocast will be out late today or tomorrow. Each week, we have a segment called “Ask Me Anything (AMA)” where we answer questions sent in by our audience. If you have a question for this week’s episode, please send it in at the contact form here.
*Opinion, not advice. See “terms” above.


