
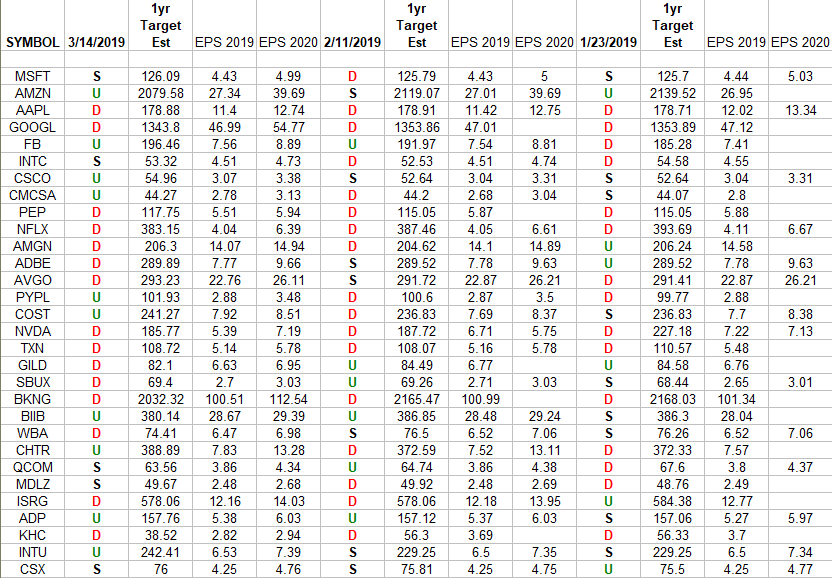
In the spreadsheet above I have tracked the earnings estimates for the top 30 weighted Nasdaq stocks. I have columns for what the 2019 and 2020 estimates (if available) were: 1/23/19, 2/11/19 and today 3/14/2019. The column under the date 3/14/19 has a letter that represents the movement in 2019 earnings estimates since the most recent print (2/11/19). “U” means 2019 estimates are UP in the last 31 days. “D” means 2019 estimates are DOWN in the last 31 days. “S” means 2019 estimates have remained the SAME in the last 31 days. The column entitled “1yr Target Est” is the Wall Street consensus 12 month price target for each stock. You can see how it has come up or come down in recent weeks.
What this table is telling us so far is that despite the dramatic dislocation in price in December, estimates have remained relatively stable so far. However, more estimates came DOWN for 2019 in the past 31 days than came up 15:10 ratio. The rest remained the same. This is a better ratio than we saw on Tuesday for the DOW:
We now need to digest the January/February gains and then see where estimates are in coming weeks as Q1 earnings begin.
If you found this post helpful, consider visiting a few of our sponsors who have offers that may be relevant to you.


