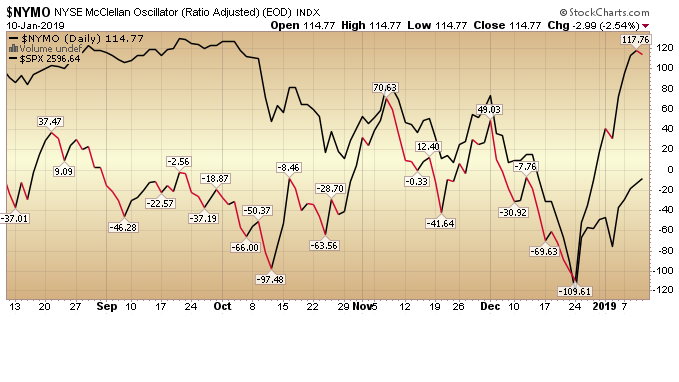
Yesterday I put out a post about the AAII Sentiment survey and that it would potentially portend a few days to a week of sideways/possibly down consolidation to work off the short term exuberance. Another short term indicator I have used for many years is the NYMO or the NYSE McClellan Oscillator which is based on NYSE stocks. As you can see above, it (red and black line) acts as a pretty good short term barometer (against the S&P 500 – black line) of where you are in terms of short term exuberance versus pessimism. The NYMO is a breadth indicator derived from Net Advances, which is the number of advancing issues less the number of declining issues. Subtracting the 39-day exponential moving average of Net Advances from the 19-day exponential moving average of Net Advances forms the oscillator. As with all indicators they should be used as a barometer, not a crystal ball as indicators can get “pinned” at extremes near inflection points for longer than normal/expected. The idea is to take enough data and measures to increase your probabilities over a series of trades/investments.
NYMO short term oscillator