

This summer my wife Kaitlyn and I took our girls out to Omaha to see the Olympic Trials for swimming. As a regular attendee at the Berkshire Hathaway annual meeting – for many years – I finally got to show them Warren Buffett’s favorite steakhouse, Gorat’s (yes, that is a cutout at the restaurant)! They got to swim in the Olympic pool, meet many current and past Olympians – as well as all of the top brass at USA Swimming.
On the final evening, there was an elegant dinner with a couple dozen guests – surrounded by all of the former medalists. One of the gold medalists relayed a story of how during his swimming career ascent he went for a period of two years where his times did not improve. TWO FULL YEARS. He was hitting the wall in frustration until one of the Olympians before him encouraged him to keep going. As he phrased it, “sometimes you gotta PAY THE BANK for a while before you see the returns.” Sure enough, the following two years led to his Olympic run and enough medals to signify this extreme level of accomplishment to last a lifetime.
On Tuesday, I was talking to a friend (who is a large client) about Alibaba. We were discussing the best way to get a bit more exposure to the name before the calendar turns. As we were talking, I said, “I have never seen a situation where price was so disconnected from fundamentals for such a high-quality business that had a meaningful moat. This reminds me of Microsoft in 2013 before it took off on an historic run.” After hanging up the phone, I went back and looked up the data. Here are the details:
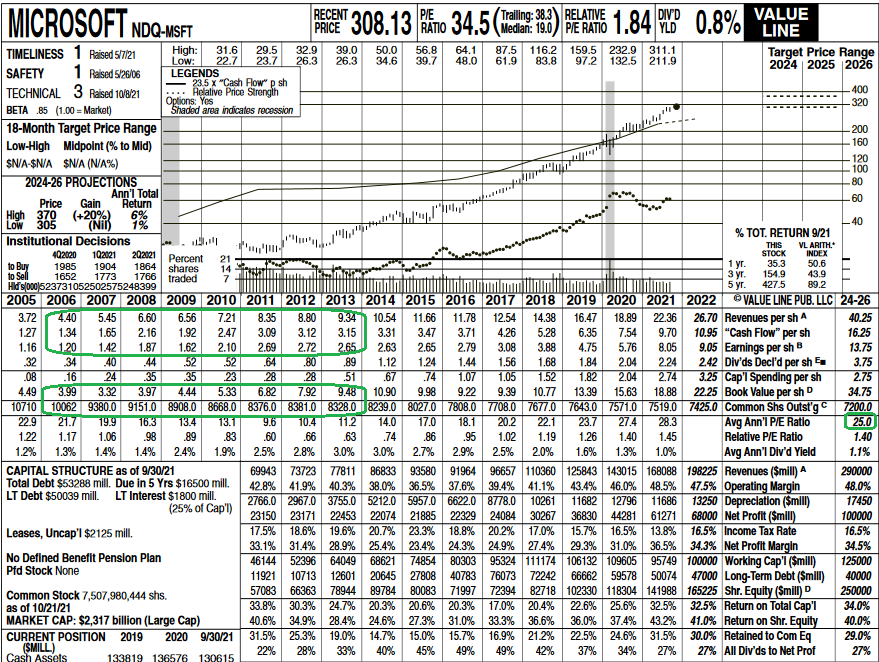
From 2006-2013 (7 years), Microsoft grew –
- Revenues (per share) by 112.14%
- Cash Flow (per share) by 193.05%
- Earnings (per share) by 120.83%
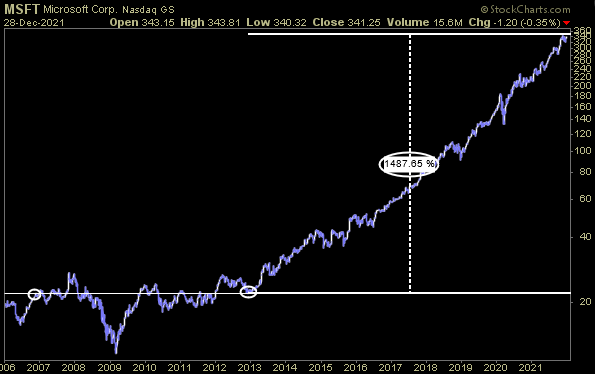
Over the same 7 years, WHILE THE BUSINESS MORE THAN DOUBLED, the stock price GAINED ZERO PERCENT. ZERO, ZILCH, NADA…
But if you KNEW WHAT YOU OWNED, you were buying more, knowing you owned one of the highest quality businesses in the world with a defensible moat.
Over the next 7 years you were up ~750%. If you waited another ~2 years years, you were up ~1,500%. This is ~20% CAGR since 2006, OR if you were smart enough to buy a company that doubled its intrinsic value from 2006-2013 – but you could still buy it for 2006 prices (in 2013), your CAGR was ~36%.
What is even more interesting is that over the next 7 years (2014-2021) Microsoft grew:
- Revenues (per share) by 112.27%
- Cash Flow (per share) by 135.07%
- Earnings (per share) by 206.08%
So in the first 7 years, MSFT grew revenue by 112% and the stock rose 0%. In the second 7 years MSFT grew revenue by 112% and the stock rose ~1500%. Cashflow grew slower in the second 7 years than the first 7 years by a wide margin, and earnings grew faster.
WHAT CHANGED? Sentiment. In 2013, MSFT traded at as low as 6.9x earnings and you COULDN’T GIVE IT AWAY. This year it traded as high as 37.8x earnings and EVERYONE WANTS IT. The average P/E multiple for MSFT for the past 16 years was 25x. The multiple is now 51% above that mean and people can’t get enough of the stock.
Look how this compares to Alibaba:
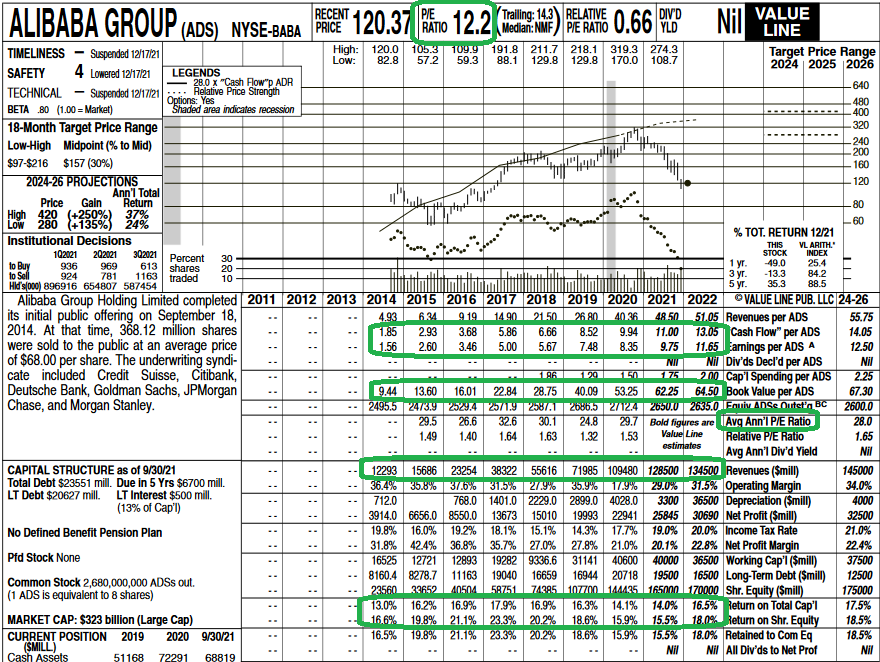
From 2014-2021 (7 years), Alibaba grew –
- Revenues (per share) by 894.93%
- Cash Flow (per share) by 559.46%
- Earnings (per share) by 601.92%
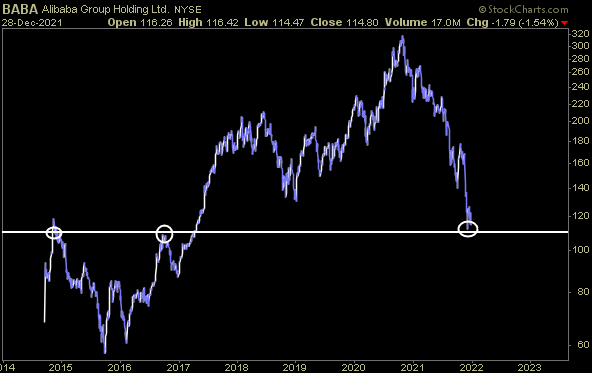
Over the same 7 years, WHILE THE BUSINESS GREW MANY MULTIPLES (~500-900% depending which metric you emphasize), the stock price GAINED ZERO PERCENT. ZERO, ZILCH, NADA…
Ben Graham, “in the short run the market is a voting machine, but in the long run it is a weighing machine.”
But because we KNOW WHAT WE OWN, we added more this week, knowing we own one of the highest quality businesses in the world with a defensible moat. We are buying a business that has grown 5-9x (depending on metric) for the 2014 price it traded at before the growth. We did this while not exceeding a percentage of the portfolio that would be imprudent from a risk management standpoint. There is always a possibility of factors that you “don’t know that you don’t know,” and we manage that risk by sizing appropriately.
Last quarter – in spite of all of the regulatory crackdown/noise – BABA still grew top line 29% and laid out plans to grow to 2B users in future years. Keep in mind, this was a $1T company that is now trading at $300B (market cap). It is not inconceivable that BABA could one day be a $1.5T company (Amazon is currently $1.7T), with its cloud growth, user growth and strong international expansion. Alibaba started 5 years AFTER Amazon and is concentrated on expanding in parts of the world that still have meaningful population growth (and limited Amazon penetration).
Alibaba spent the last 7 years “PAYING THE BANK” (no progress on price while the fundamentals have dramatically improved). We are lucky to be stepping in methodically and aggressively at this stage. Someone else already suffered the 7 years of massive business growth with no price appreciation. We will reap the benefits of buying AFTER the intrinsic value has multiplied – but BEFORE IT IS REALIZED in the stock price.
Remember the MSFT example from above? When it was trading at 6.9x earnings in 2013 (after doubling the business in the previous 7 years) no one wanted it. Now that it’s trading 51% above it’s 16yr average P/E multiple at 37.8x people can’t get enough of it.
Alibaba’s average P/E multiple is 28x since it went public in 2014. It is currently trading ~11.6x next year’s earnings. Leaving aside growth estimates, as sentiment changes over time, if it traded back to its average multiple you would be looking at a $270 stock. If it traded 51% above its average multiple as MSFT is now, you would have $408 stock. AND THIS IS USING 2022 EPS (which has come down). What happens when the regulatory headwinds subside and the earnings spigots are turned back on – rising EPS with a rising multiple?
What will happen when earnings double again in the next handful of years and the multiple normalizes? I’ll tell you what’s going to happen – forget about “common prosperity“, it’s going to be UNCOMMON prosperity for those with a little foresight and fortitude to own at these levels and make it through the short term noise. (that is my opinion, not advice – see terms above).
Now it’s time to make our run for the GOLD!
Legendary Value Investor Bill Miller was out on December 17, 2021 with his latest thoughts on Alibaba. You can watch the 3 minute clip here:
I mentioned in recent podcasts that we post our TV spots on TikTok. As I was scrolling through TikTok, I came across this video. This is not a political video. It doesn’t matter whether you like the speaker or dislike the speaker. I like you either way! However, what he says about success in this clip is a golden piece of business advice for everyone. Imagine how it applies to those who owned MSFT from 2006-2013, and then what happened next…
No pressure, No diamonds!
This second clip that came up on TikTok is from Warren Buffett. While I would never go this high of a weighting on any one position (ever), if someone forced me to pick one company that I MUST, Alibaba would be the one at these levels:
On Monday I was on Fox Business – The Claman Countdown – with Lauren Simonetti discussing US markets and outlook. Thanks to Ellie Terrett, Lauren and Liz for having me on. Note the “Blue Oyster Cult” reference in this one (toward the end)!
Watch in HD directly on Fox Business
On Tuesday I was on Yahoo! Finance with Adam Shapiro and Brian Cheung discussing interest rates, the Fed, and its impact on the market moving forward. Thanks to Taylor Clothier, Sara Dramer, Brian and Adam for having me on:
Watch in HD directly on Yahoo! Finance
Now onto the shorter term view for the General Market:
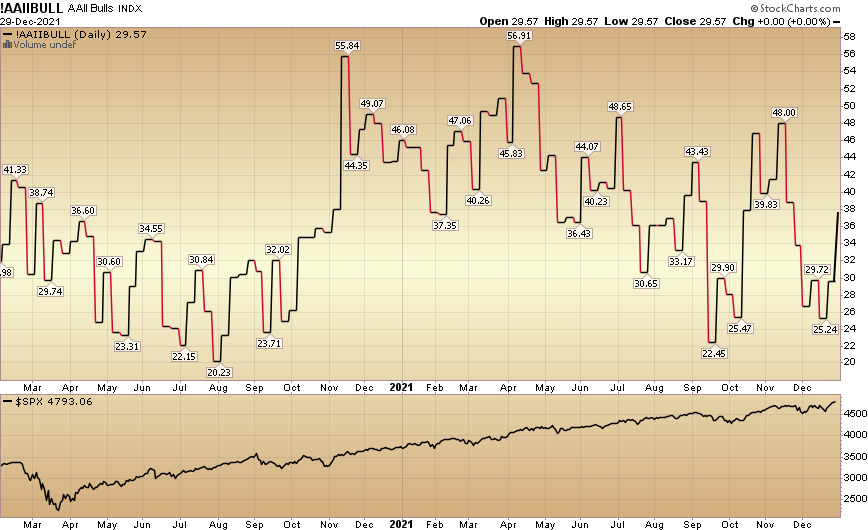
In this week’s AAII Sentiment Survey result, Bullish Percent (Video Explanation) jumped up to 37.7% this week from 29.6% last week. Retail optimism is coming back, but not yet at extreme levels.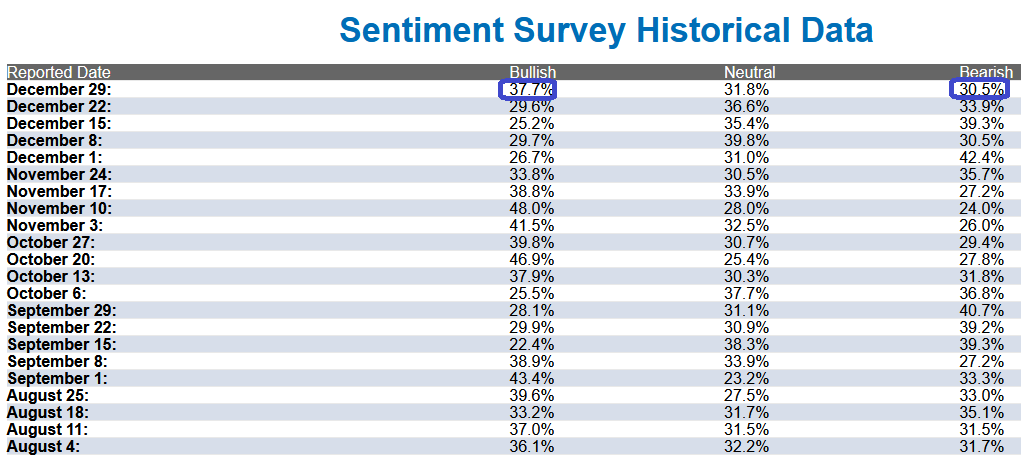
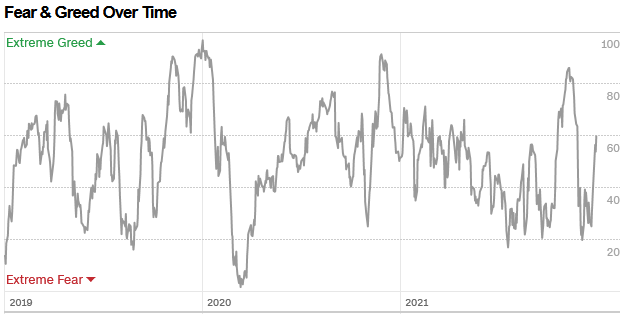
 The CNN “Fear and Greed” Index jumped from 37 last week to 60 this week. This is still a relatively neutral reading. You can learn how this indicator is calculated and how it works here: (Video Explanation)
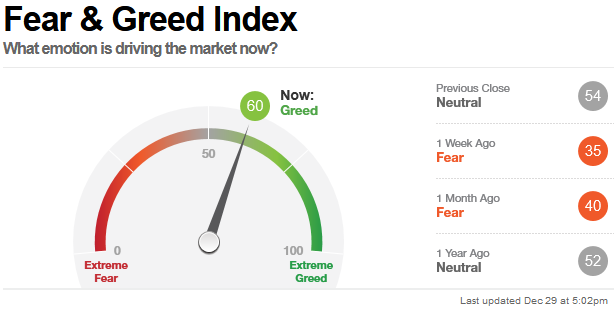
And finally, this week the NAAIM (National Association of Active Investment Managers Index) (Video Explanation) rose to 67.02% this week from 52.22% equity exposure last week. Managers are still underweight.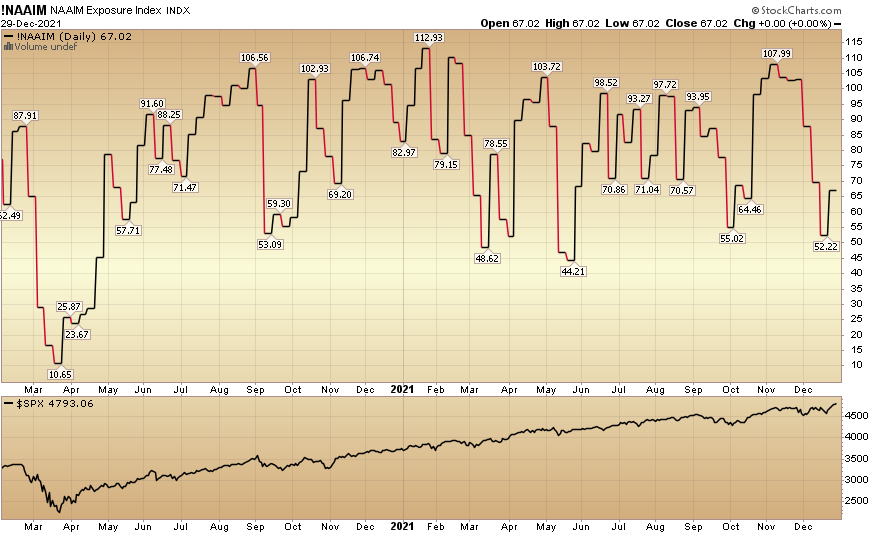
Our outlook for 2022 remains intact – high single digit to low double digit returns for the S&P 500 – with much more volatility as participants sniff out (post-taper) liquidity withdrawal by Q2. We will continue to be focused on buying those areas of high quality – that are on sale – and trading at reasonable valuations. We go into more on this week’s podcast|videocast. You can watch or listen here: podcast|videocast.
Happy New Year!


