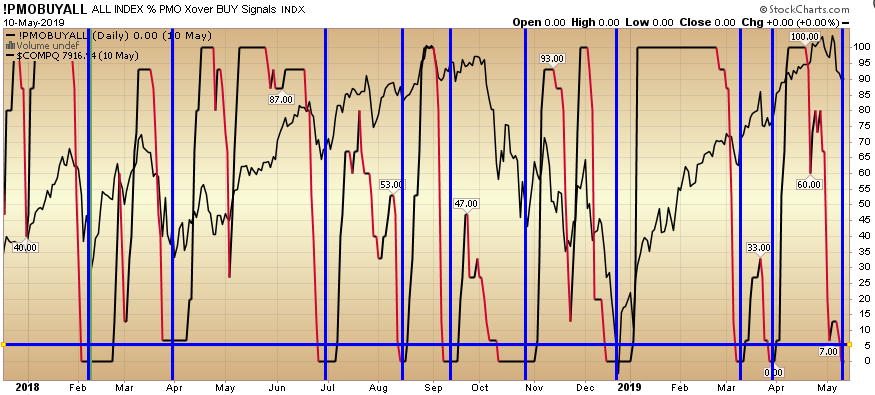
The last 9 times the PMO “Buy All” indicator dropped below 5, it has paid to buy the market for a bounce. It is currently at zero. The blue vertical lines mark those spots where the indicator dipped below 5 in the past 1.5 years.As you can see, while there is 100% efficacy, in September and October of 2018 you had to be very quick on the bounce as it rolled back over hard, but it is at an extreme and it is worth noting.
While all indicators should be used as barometers, not crystal balls, it is helpful to have a handful of them working in the background at all times so that you can measure extremes (to be heeded or to be ignored).
The Price Momentum Oscillator (PMO) on an individual stock, is an oscillator based on a Rate of Change (ROC) calculation that is smoothed twice with exponential moving averages that use a custom smoothing process. Because the PMO is normalized, it can also be used as a relative strength tool. Stocks can thus be ranked by their PMO value as an expression of relative strength.