
Last night we covered the “PMO Buy All” indicator which had a 70% accuracy rate for predicting pullbacks.
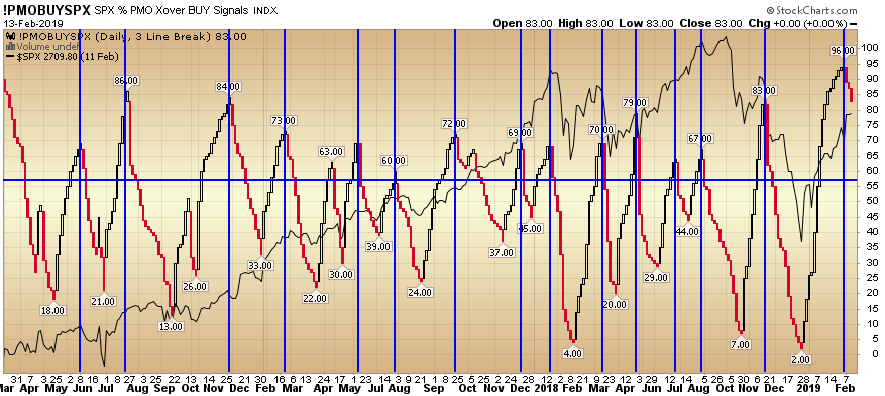
Tonight we are going to cover the “PMO Buy SPX” which limits the universe to those S&P 500 components that are on PMO buy signals. We used a cutoff of 60 (represented by the blue horizontal line as a requirement for amplitude). In the 14 most recent instances of a flip from black to red on the PMO BUY SPX indicator, 11 out of those times resulted in a pullback to correction. 3 instances the S&P 500 (represented buy the solid black line in the background) simply powered through the excess and kept going higher. This is a 78% hit rate and somewhat in-line with last night’s “Buy All” indicator which was at 70%.
While all indicators should be used as barometers, not crystal balls, it is helpful to have a handful of them working in the background at all times so that you can measure extremes (to be heeded or to be ignored). 11 out of 14 hit ratio indicates it’s time to at least pay attention.
The Price Momentum Oscillator (PMO) on an individual stock, is an oscillator based on a Rate of Change (ROC) calculation that is smoothed twice with exponential moving averages that use a custom smoothing process. Because the PMO is normalized, it can also be used as a relative strength tool. Stocks can thus be ranked by their PMO value as an expression of relative strength.
If you found this post helpful, please consider visiting a few of our sponsors who have offers that may be relevant to you.


