
Data Source: Factset
As we mentioned last week, it looks like Q2 will set up similarly to Q1 with very low expectations and an opportunity to easily beat to the upside. The difference will be Q2 will comp positively year on year versus Q1 which was slightly negative.
But wait, with numbers like these – when does the recession come?
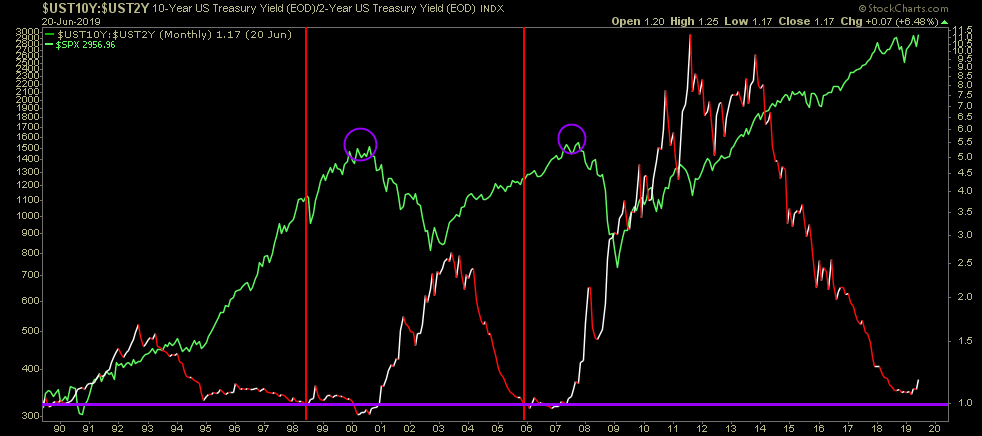
The recession/market peak will come 12-24 months after the 2/10 yield curve inverts and credit is choked off from the economy (red vertical lines on chart above are inversion points and purple circles are market peaks). We have not yet inverted so the countdown has not begun. As you can see below, the stock market peaks (and recession begins) ~18 months after a 2/10 inversion. You can chart this pattern back to the late ’70s.
Am I 100% sure? No, anyone worth their salt in this business knows nothing is 100% sure, but historical precedent favors this outcome and therefore if you position accordingly – you manage risk to adapt in case you are wrong and “this time it’s different.” That said, I like bets with historical precedent and facts acting as my tailwind. As Sir John Templeton is famous for saying:

Okay, back to Q2 earnings:
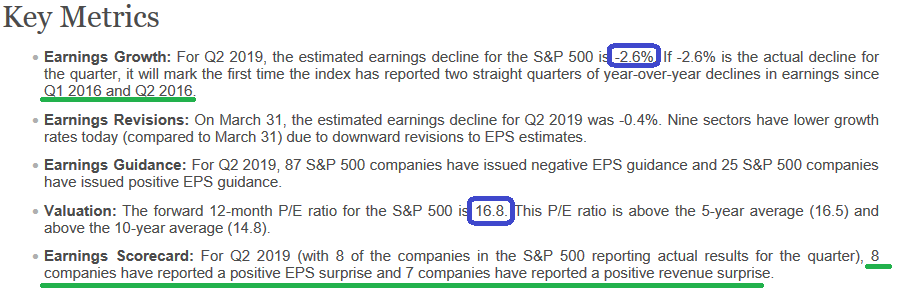
-On a per-share basis, estimated earnings for the second quarter have fallen by 2.4% since March 31. This percentage decline is smaller than the 5-year average (-3.3%), the 10-year average (-3.1%), and the 15-year average (-4.2%) for a quarter.
-112 companies in the index have issued EPS guidance for Q2 2019. Of these 112 companies, 87 have issued negative EPS guidance and 25 have issued positive EPS guidance. The percentage of companies issuing negative EPS guidance is 78% (87 out of 112), which is above the 5-year average of 70%
-The estimated (year-over-year) revenue growth rate for Q2 2019 is 3.9%. If 3.9% is the actual growth rate for the quarter, it will mark the lowest revenue growth rate for the index since Q3 2016 (2.7%).
Forward Outlook:
-For Q3 2019, analysts are projecting a decline in earnings of -0.3% and revenue growth of 4.0%.
-For Q4 2019, analysts are projecting earnings growth of 6.7% and revenue growth of 4.5%.
-For CY 2019, analysts are projecting earnings growth of 2.8% and revenue growth of 4.5%.
-For Q1 2020, analysts are projecting earnings growth of 10.3% and revenue growth of 6.0%.
-For Q2 2020, analysts are projecting earnings growth of 13.3% and revenue growth of 6.8%.
Target Price:
The bottom-up target price for the S&P 500 is 3215.75, which is 8.9% above the closing price of 2954.18. At the sector level, the Energy (+19.7%) sector is expected to see the largest price increase, as this sector has the largest upside difference between the bottom-up target price and the closing price.
Have a great weekend…


