
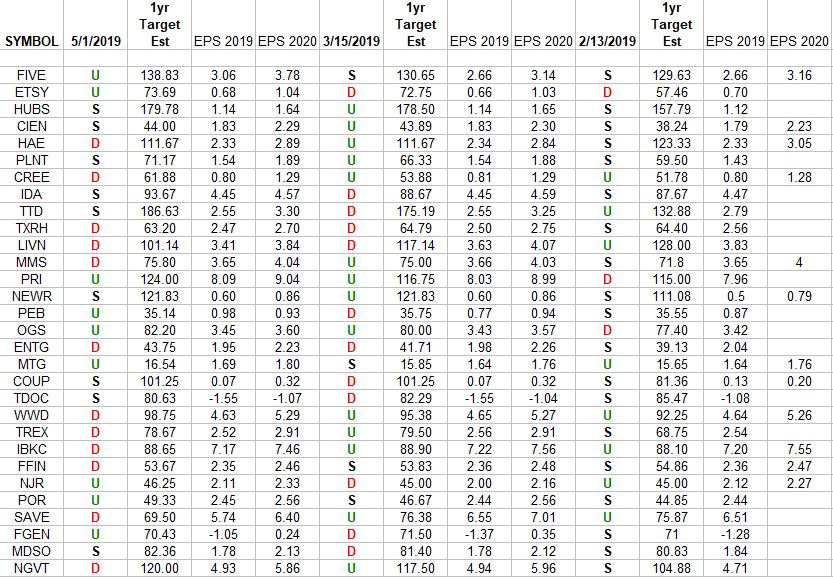
In the spreadsheet above I have tracked the earnings estimates for the top 30 weighted Russell 2000 small cap stocks. I have columns for what the 2019 and 2020 estimates (if available) were: 2/13/2019, 3/15/2019 and today 5/1/2019. The column under the date 5/1/2019 has a letter that represents the movement in 2019 earnings estimates since the most recent print (3/15/2019). “U” means 2019 estimates are UP in the last 47 days. “D” means 2019 estimates are DOWN in the last 47 days. “S” means 2019 estimates have remained the SAME in the last 47 days. The column entitled “1yr Target Est” is the Wall Street consensus 12 month price target for each stock. You can see how it has come up or come down in recent weeks.
What this table is telling us so far is that estimates have remained relatively stable so far. However, more estimates came DOWN for 2019 in the past 47 days than went UP 12:9 DOWN:UP ratio. The rest remained the same.
If you want to contrast this to the DOW + 8 and Nasdaq (top 30 weights) which had more revisions, you can review those recent posts here:


