
PayPal Update
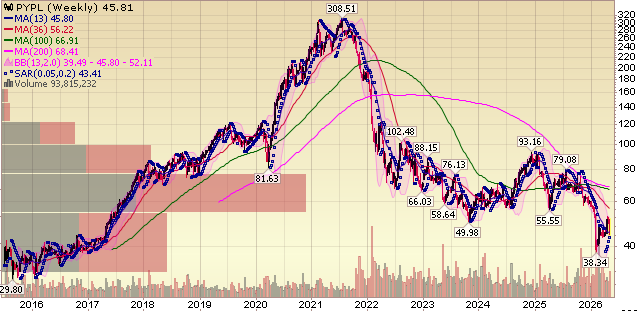
For newer readers, here’s a brief overview of the key drivers behind our PayPal thesis, an overlooked global payments leader with a cash machine core business funding aggressive buybacks and a long list of growth catalysts hiding in plain sight:
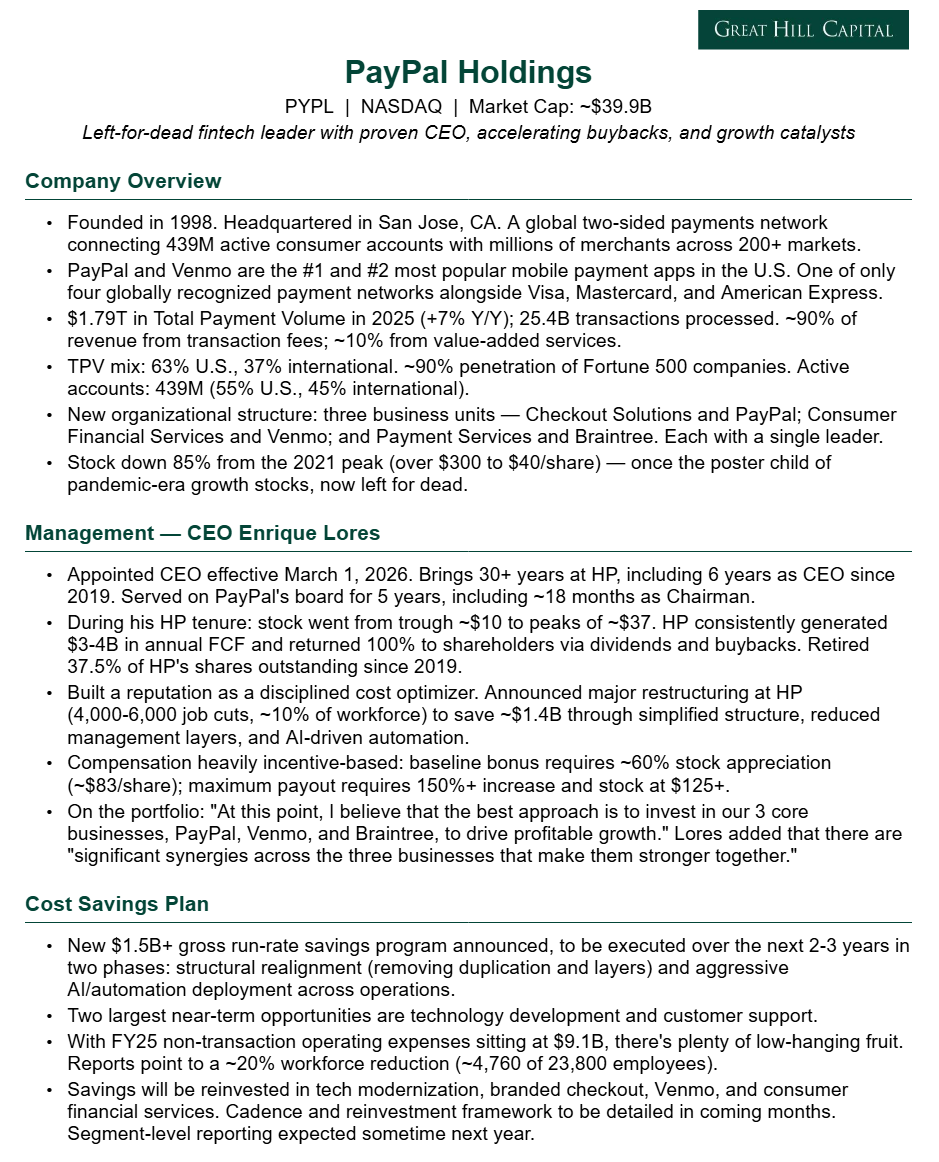
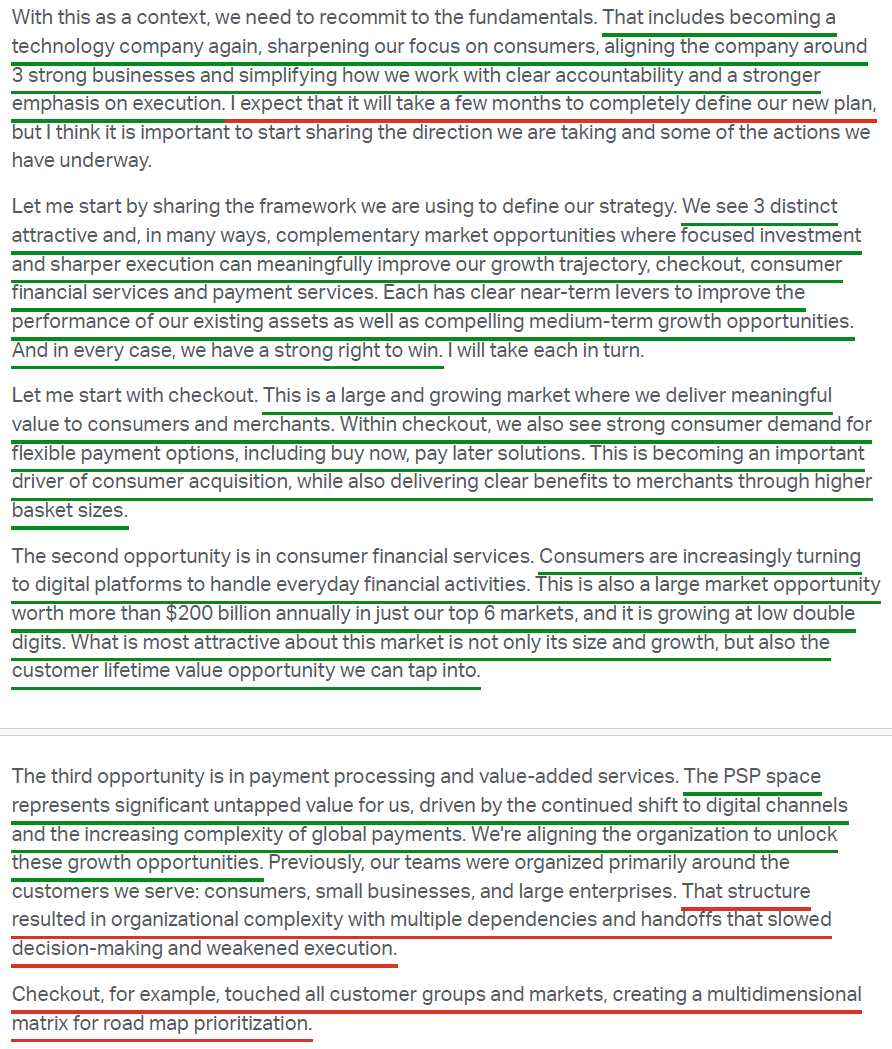
The market wanted a quick breakup trade. Enrique Lores delivered a multi-year playbook instead.
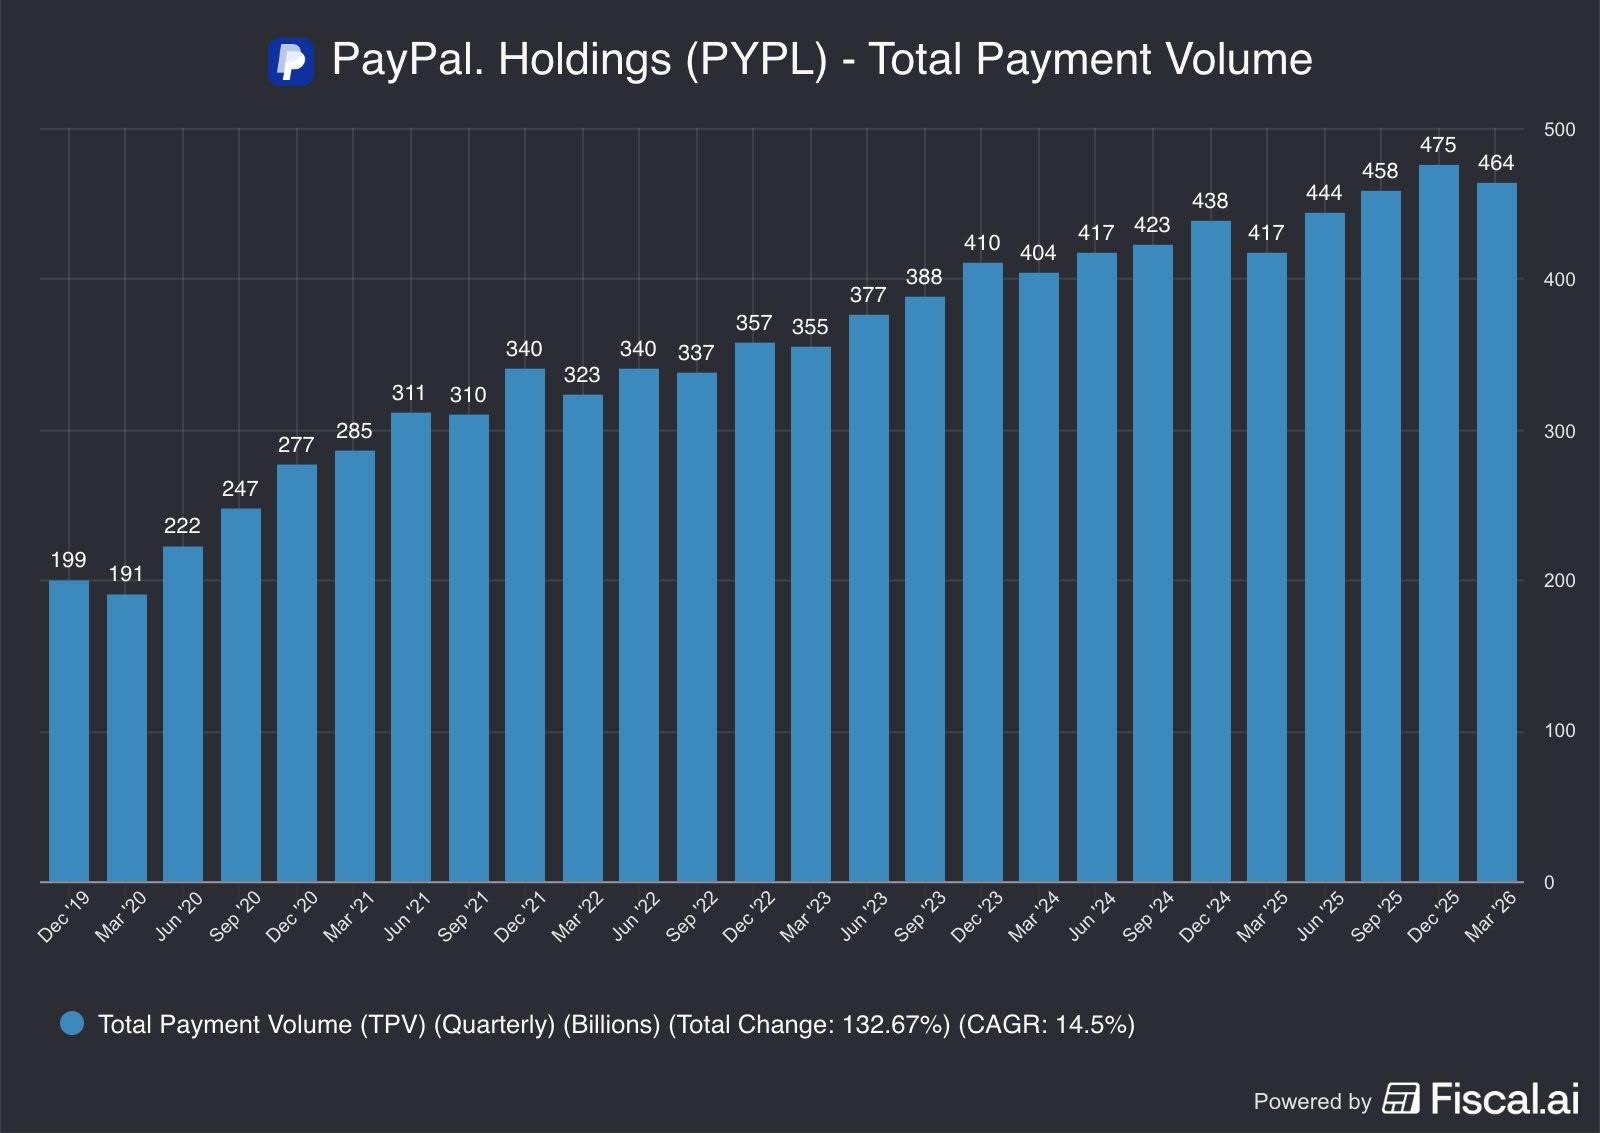
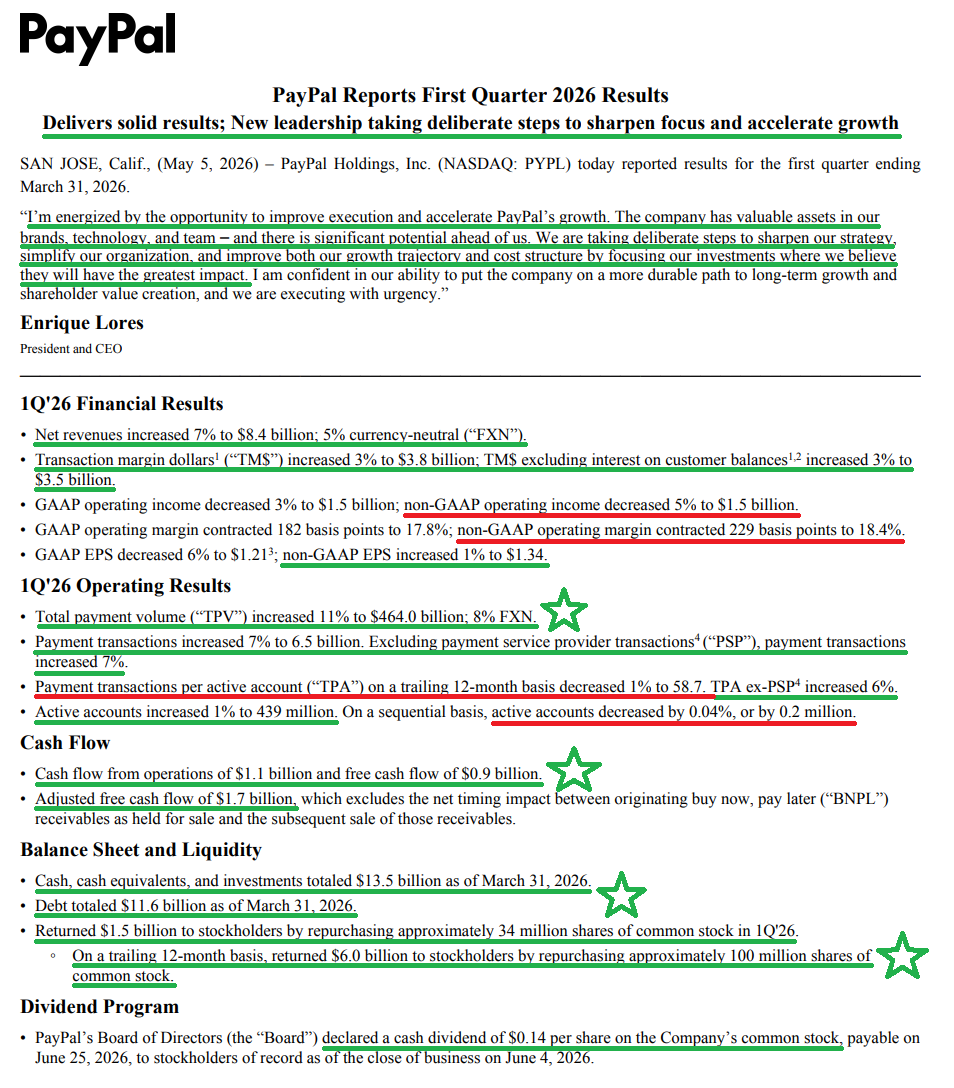
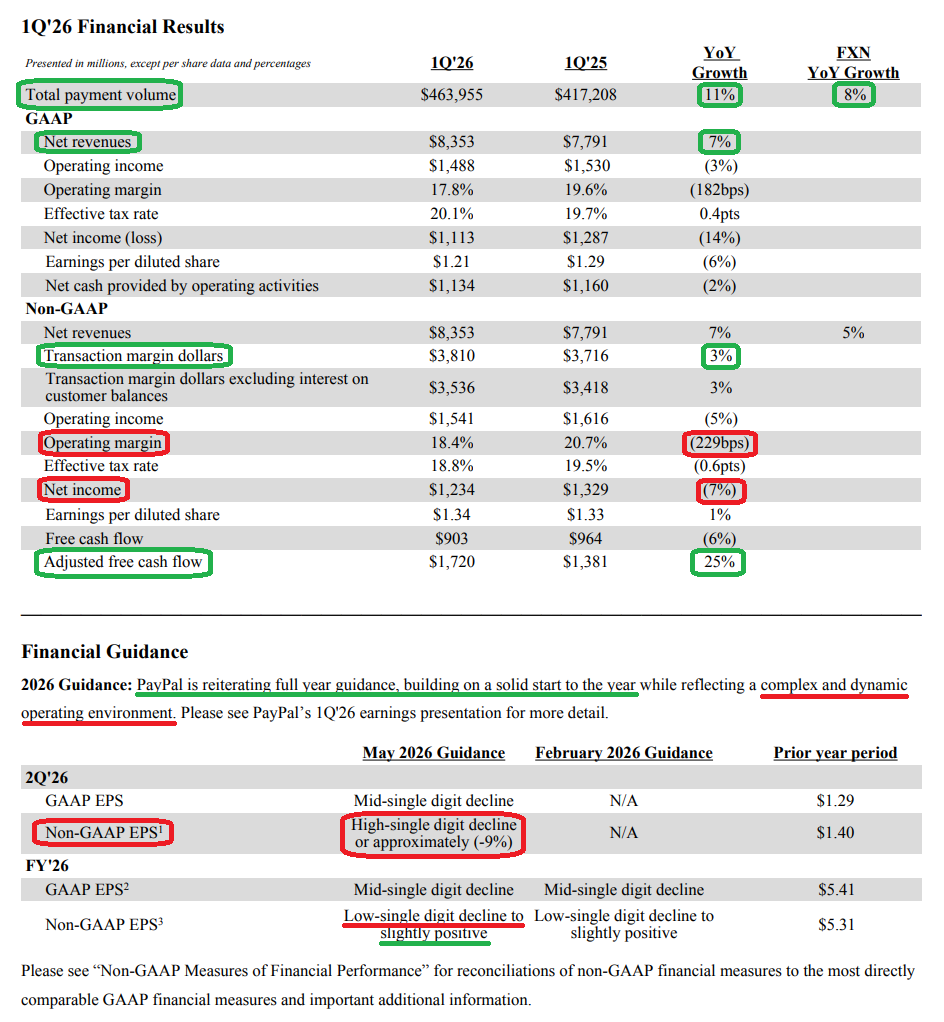
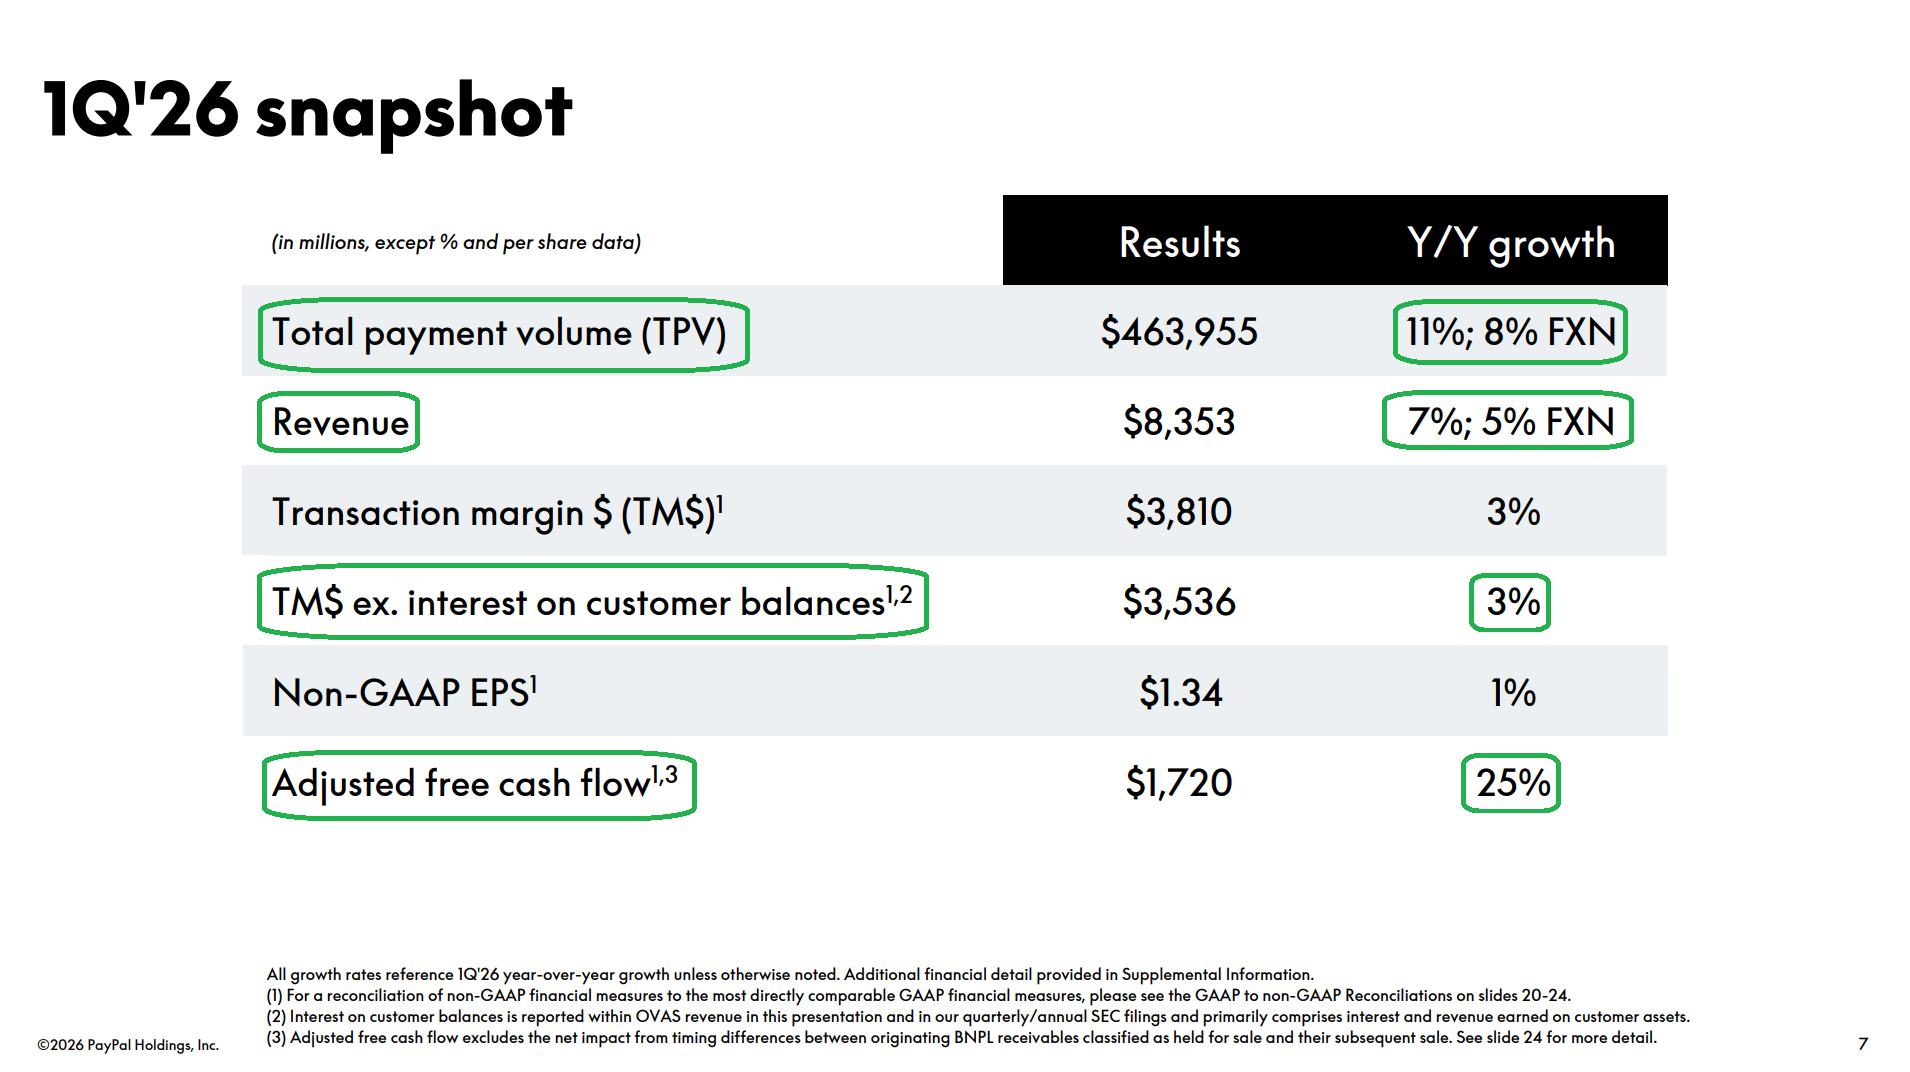
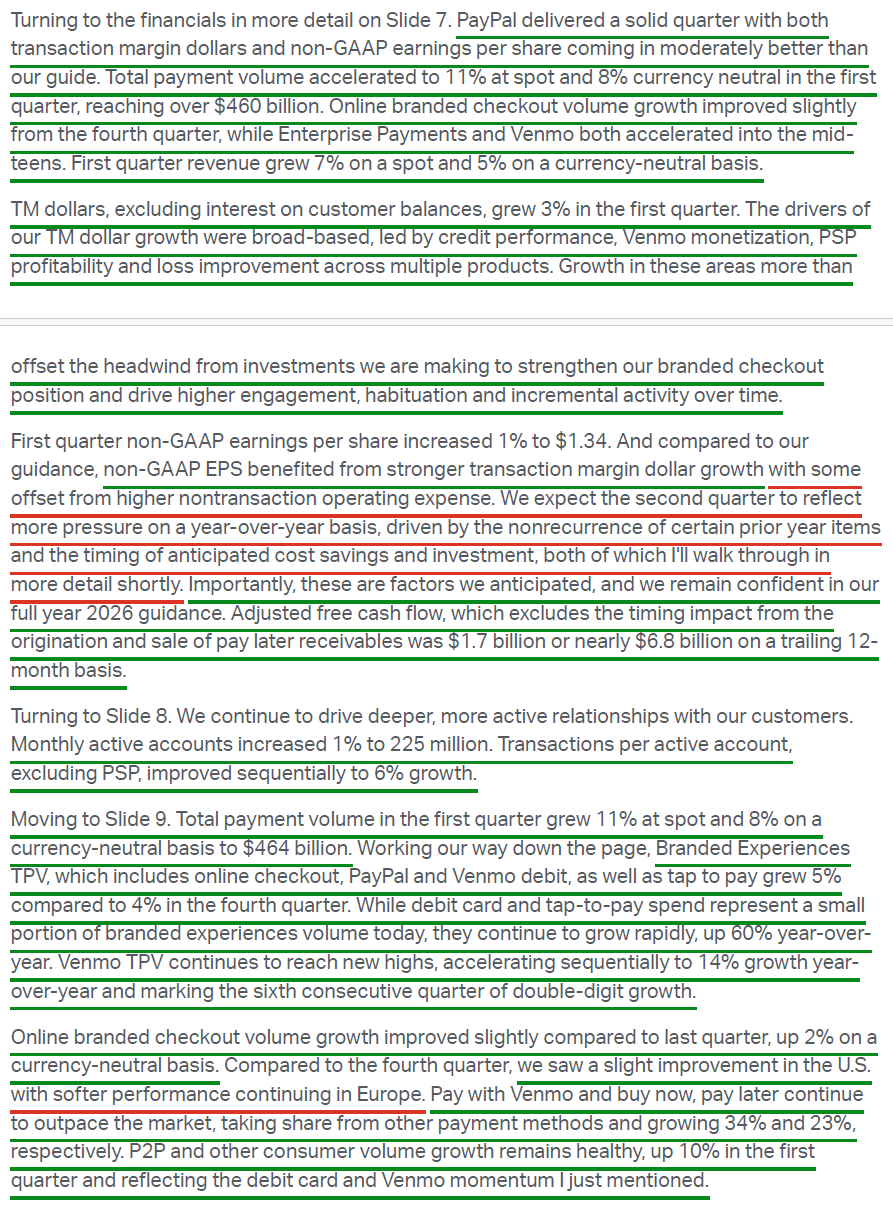
There was little not to like in PayPal’s first quarter under new CEO Enrique Lores, with strong headline numbers across the board. Revenue of $8.35B beat consensus by ~$340M. Adjusted EPS of $1.34 beat by $0.07. Total payment volume came in at $464B (+11% reported, +8% FXN), nearly $20B ahead of consensus and accelerating from +6% last quarter.
TM$ grew 3% to $3.81B, beating consensus by ~$140M. Venmo notched its sixth consecutive quarter of double-digit growth. PSP volume accelerated to +11%, with Braintree back in the mid-teens and, more importantly, now contributing to profitable TM$ growth following the “fire the unprofitable customers” reset executed under Alex Chriss.
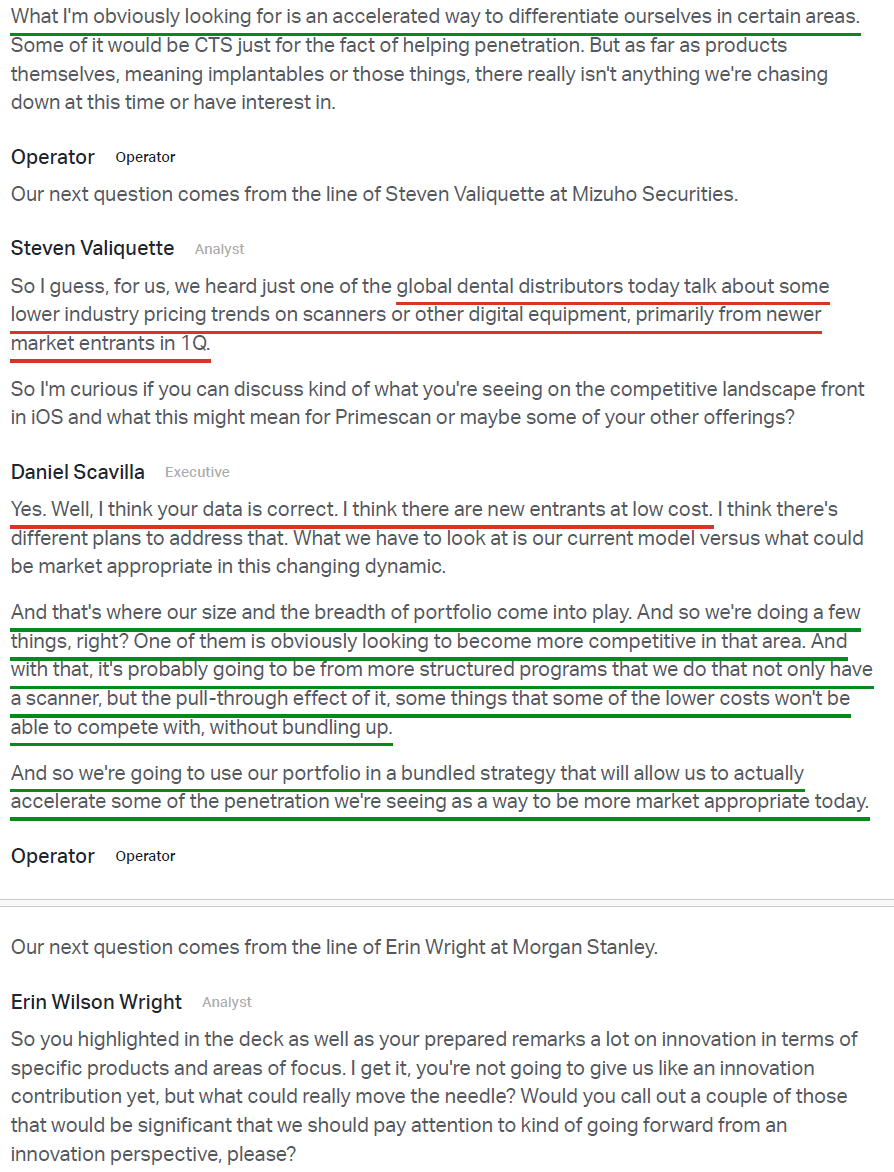
Even branded checkout, which has been the soft spot of the story and the key driver of fears over competition and cracks in the moat, showed a ~100 bps sequential acceleration and came in ahead of expectations.
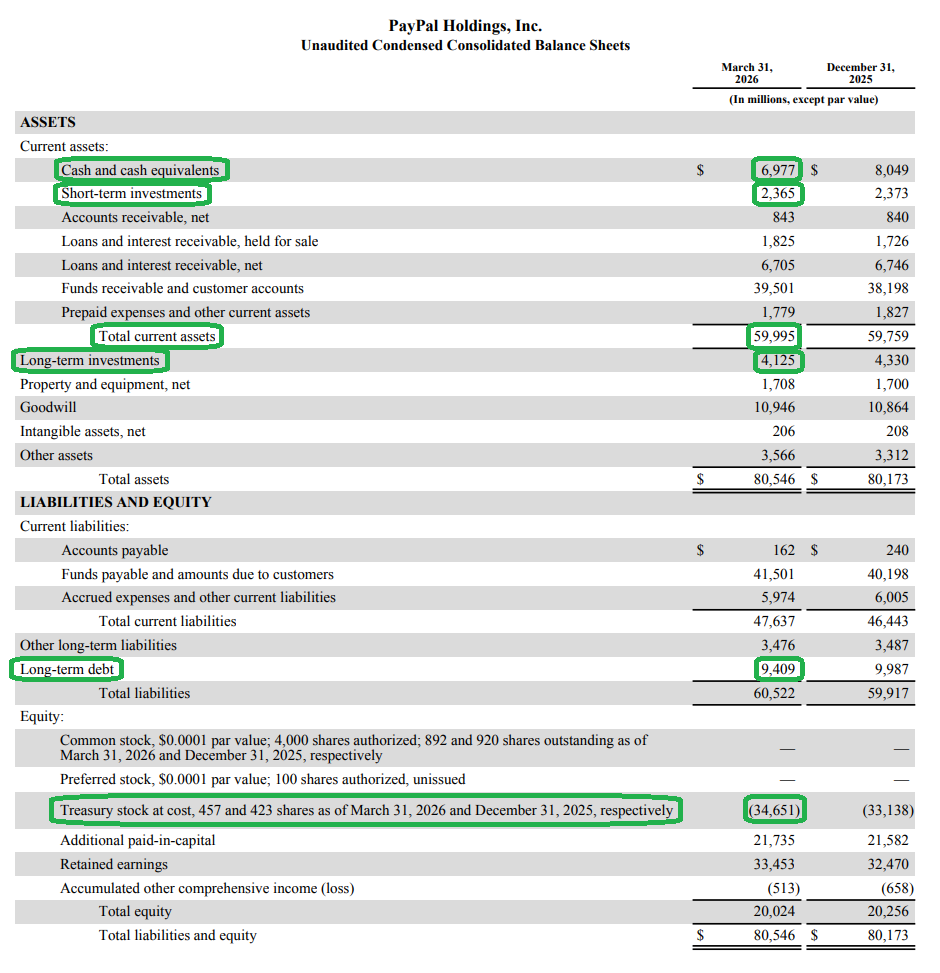
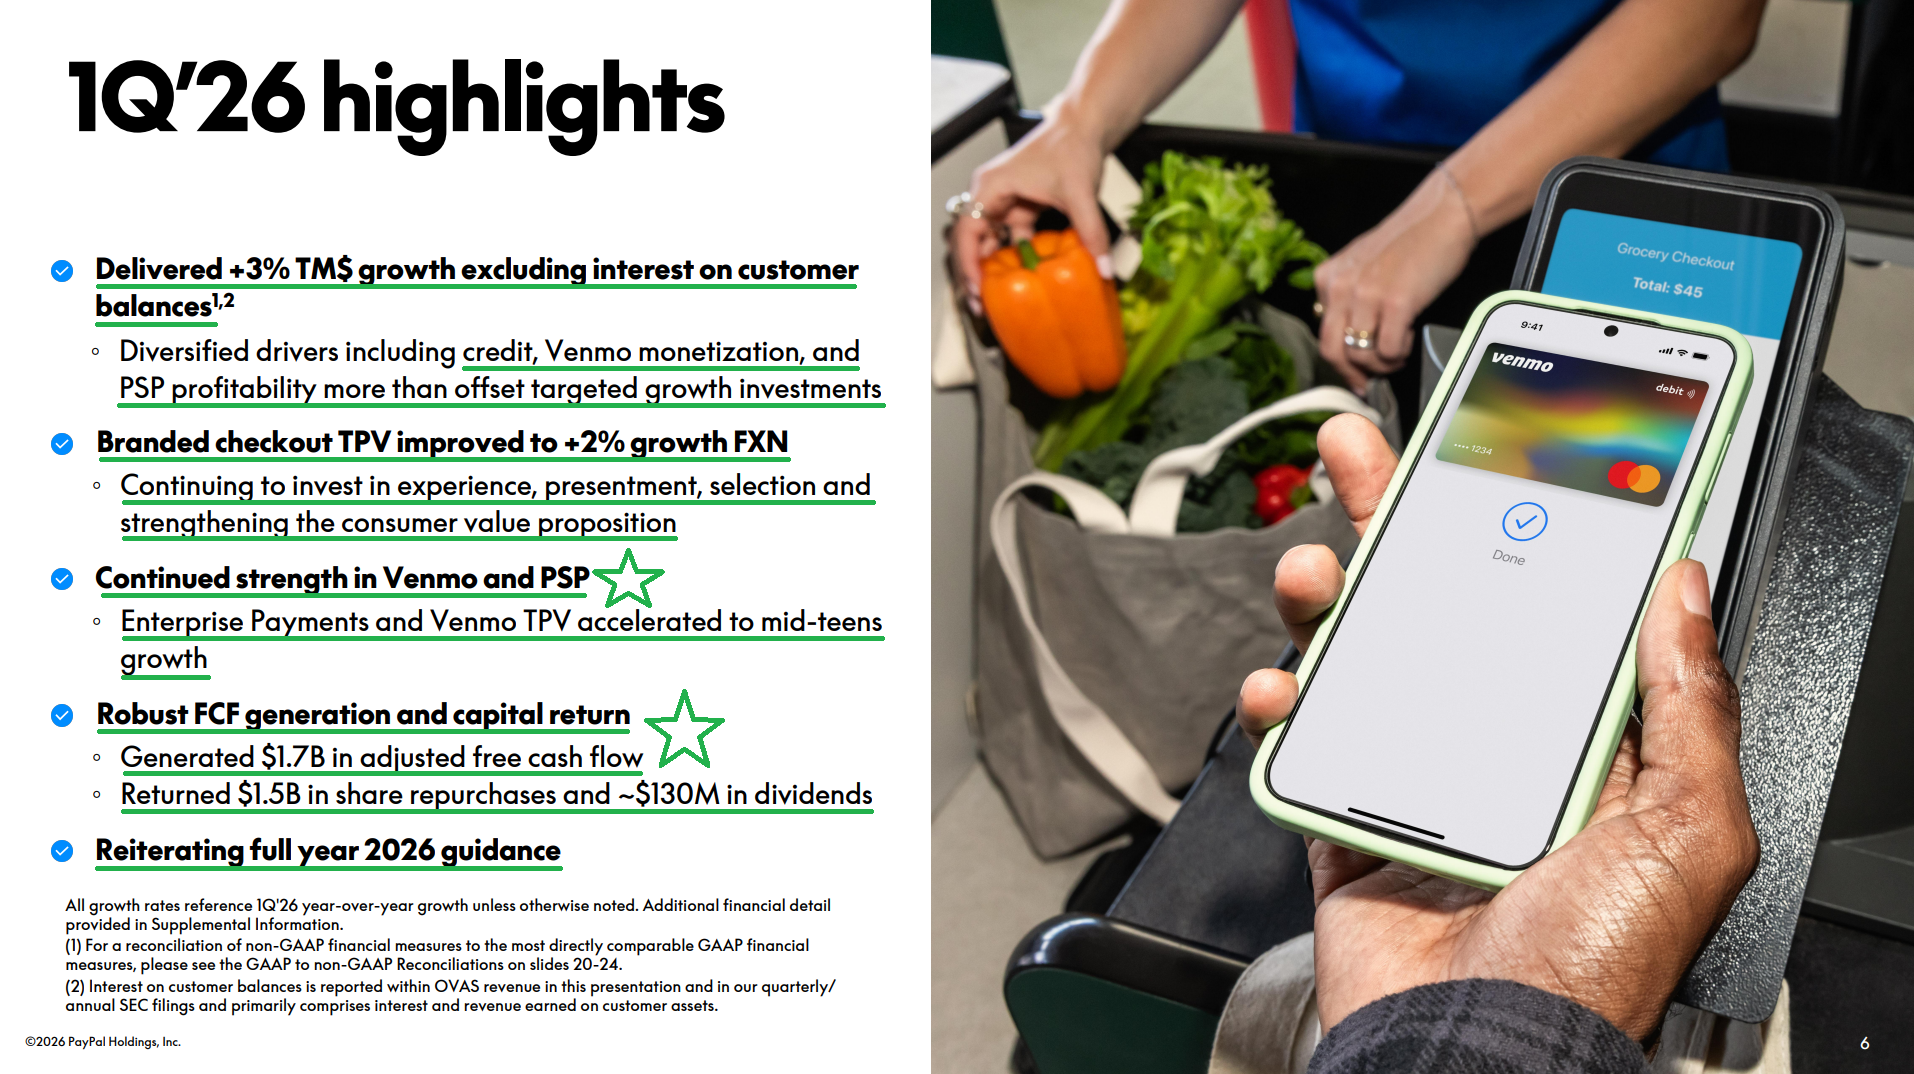
Most importantly, the cash machine was on full display. Adjusted free cash flow grew 25% Y/Y to $1.7B, bringing the TTM total to ~$6.8B. PayPal took that cash and went to work, hoovering up another $1.5B of stock during the quarter (~34M shares), making our slice of the pie that much bigger without putting up a dime.
And yet, despite strong fundamentals, the stock sold off.
We attribute the reaction to a simple reality: in the short term, the market is a voting machine driven by emotion. In the long term, it’s a weighing machine driven by fundamentals. Heading into earnings, it was all voting machine.
Weeks of rumors about a potential Venmo spinoff or other non-core asset sales led to the Johnny-come-latelies positioning for a quick buck from a breakup trade: Lores comes in, slices the company into pieces, and unlocks shortsighted value overnight.
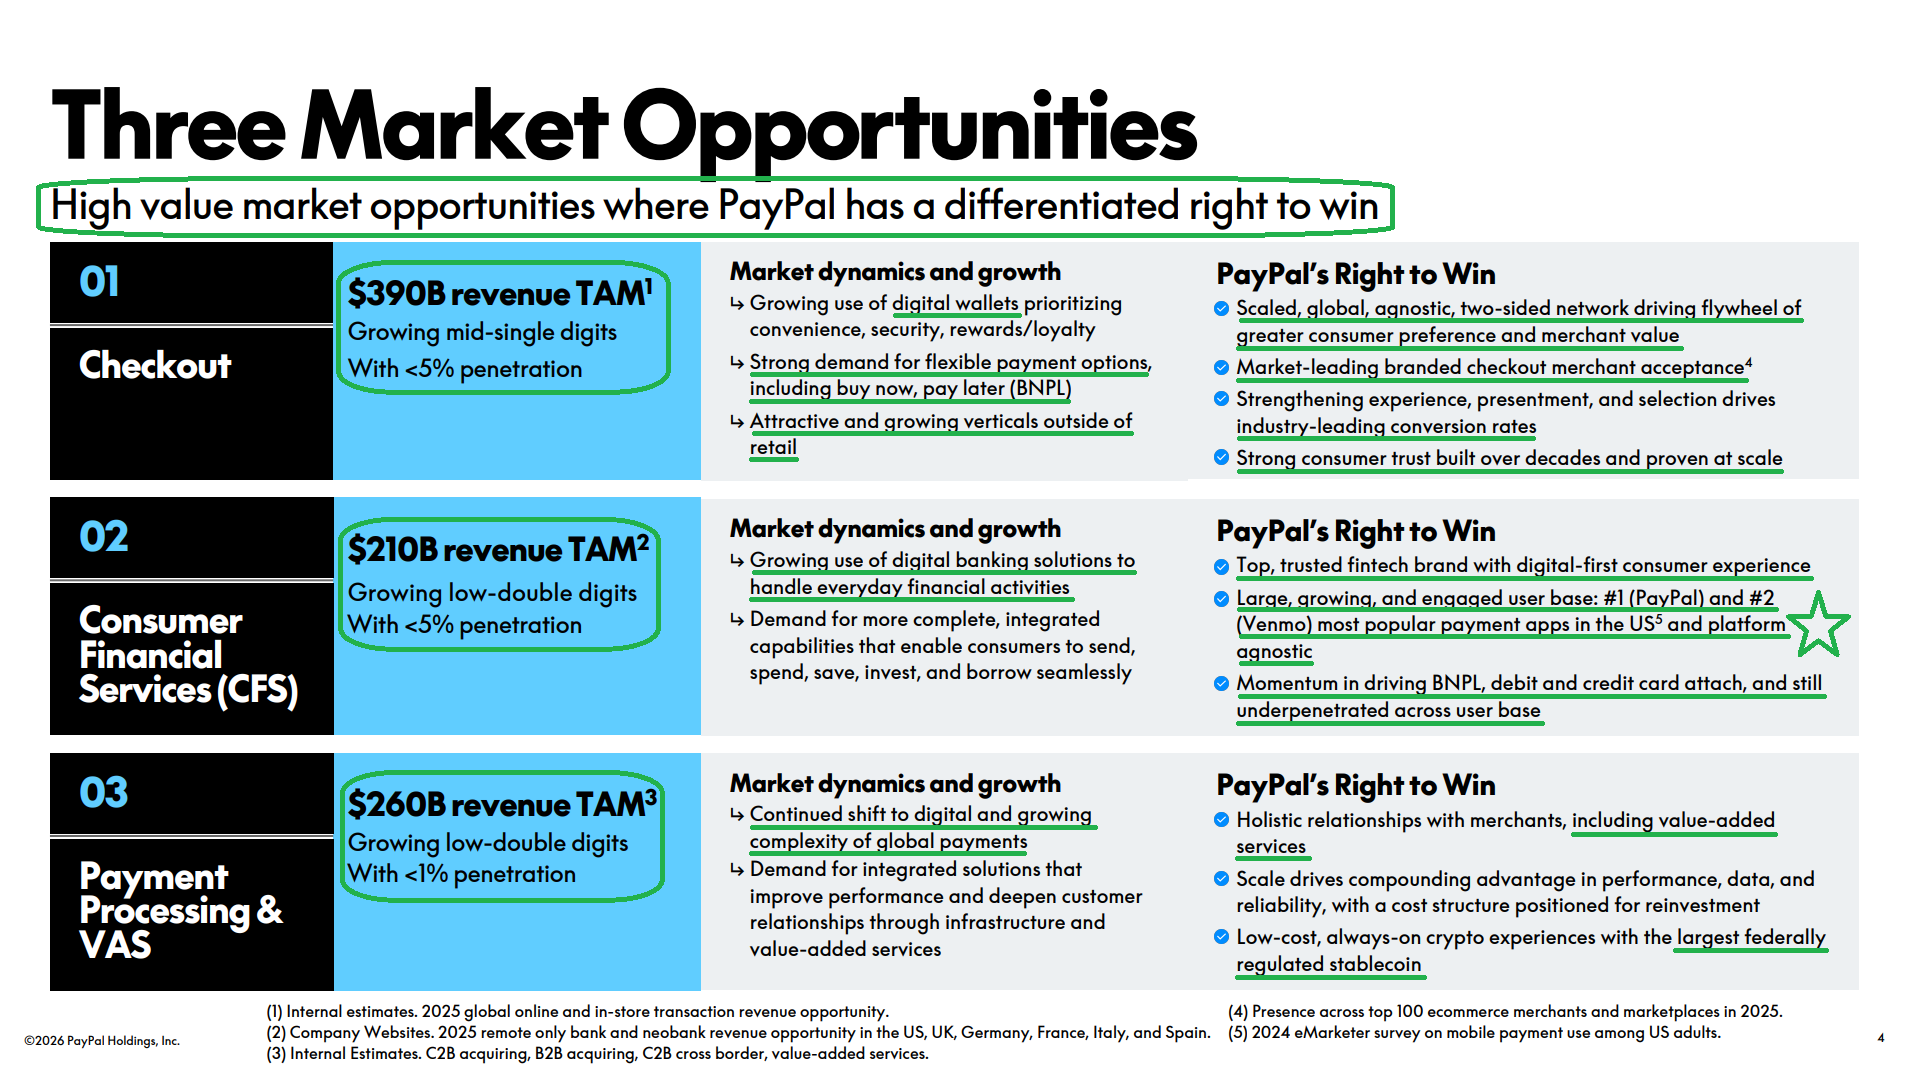
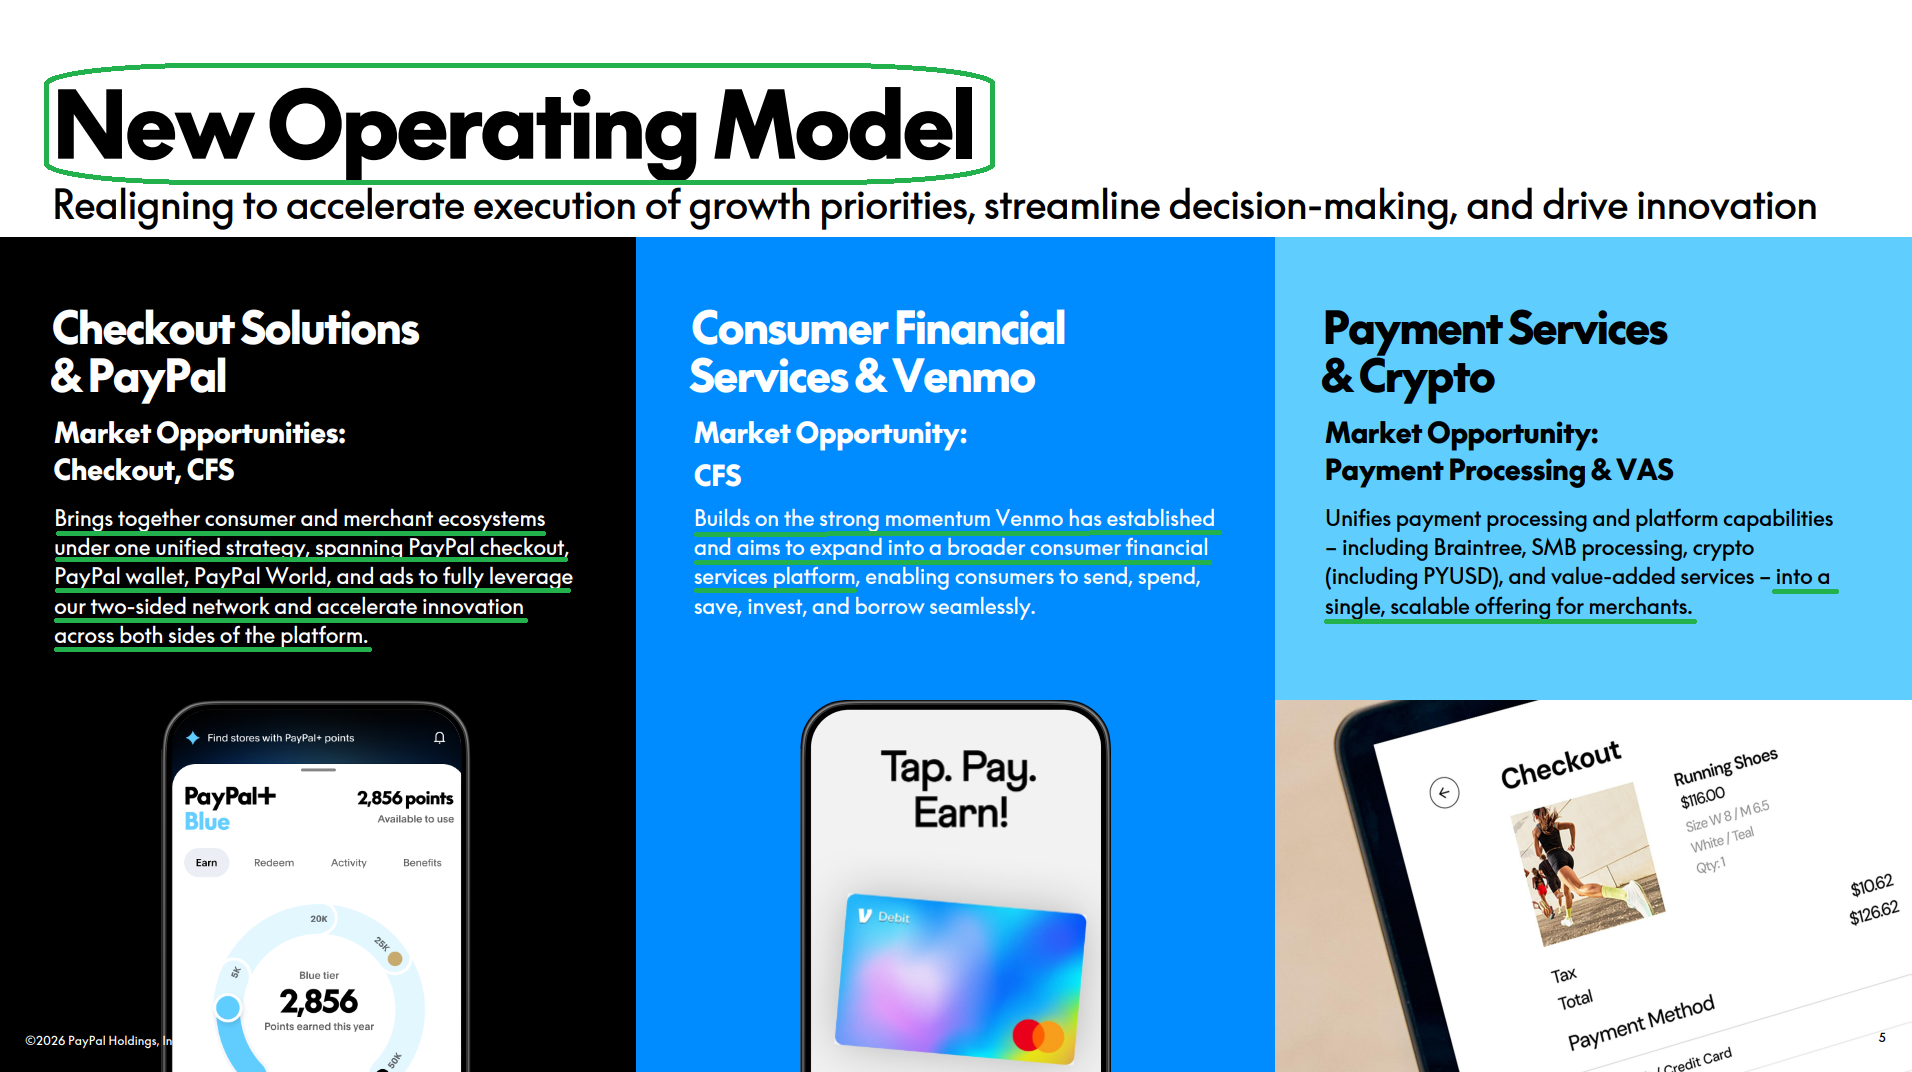
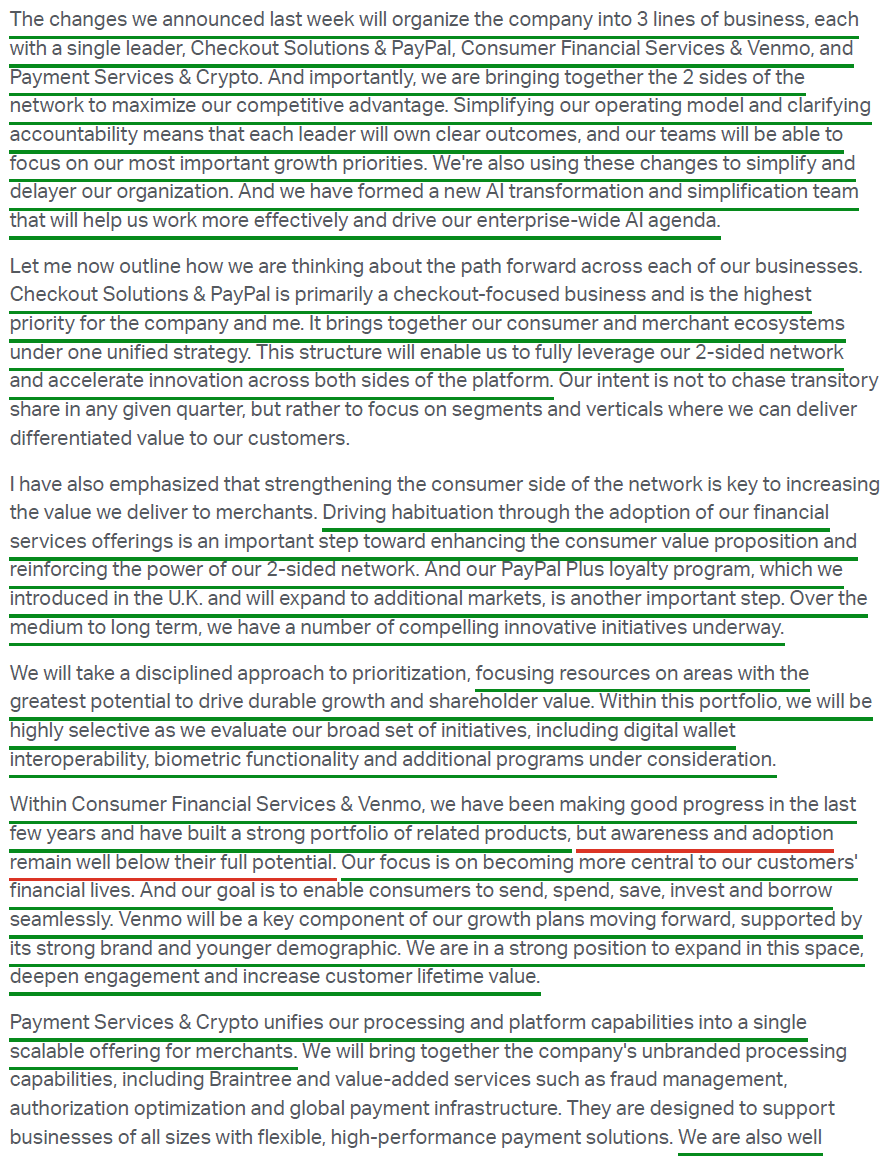
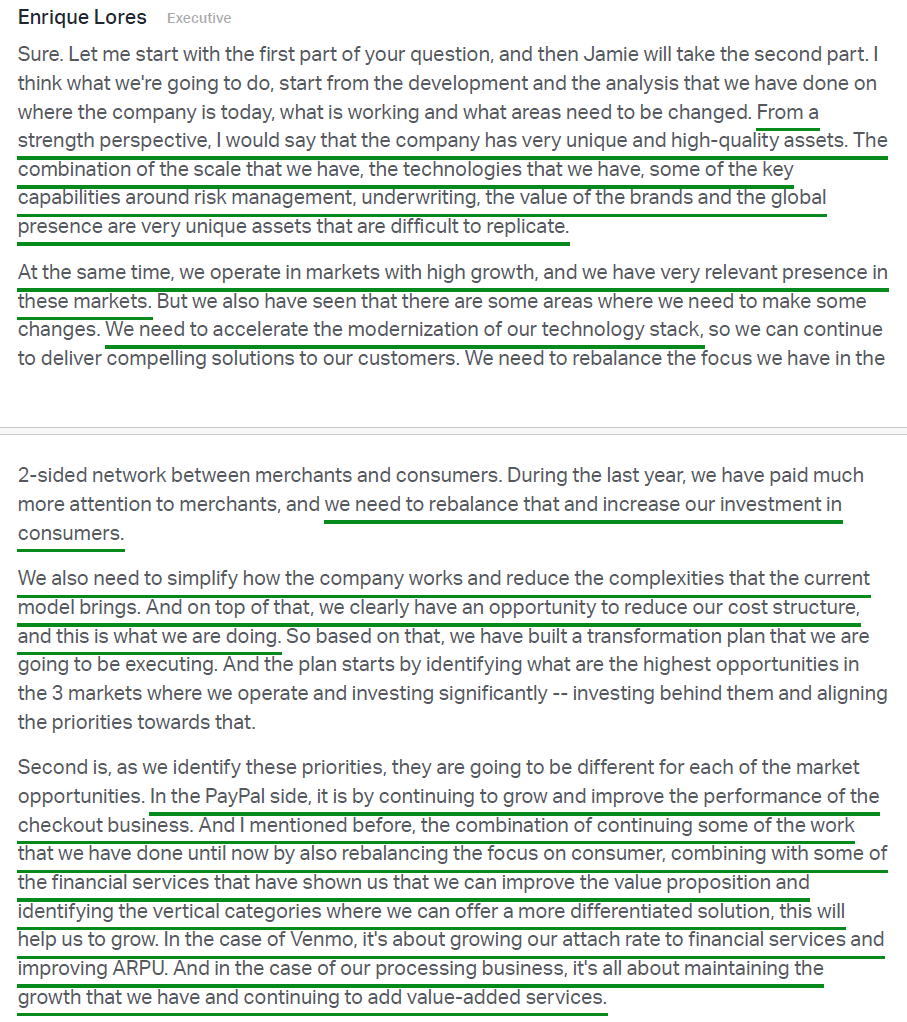
When Lores instead laid out a multi-year transformation plan centered around keeping PayPal, Venmo, and Braintree together under a unified strategy, the quick-money crowd ran for the exits.
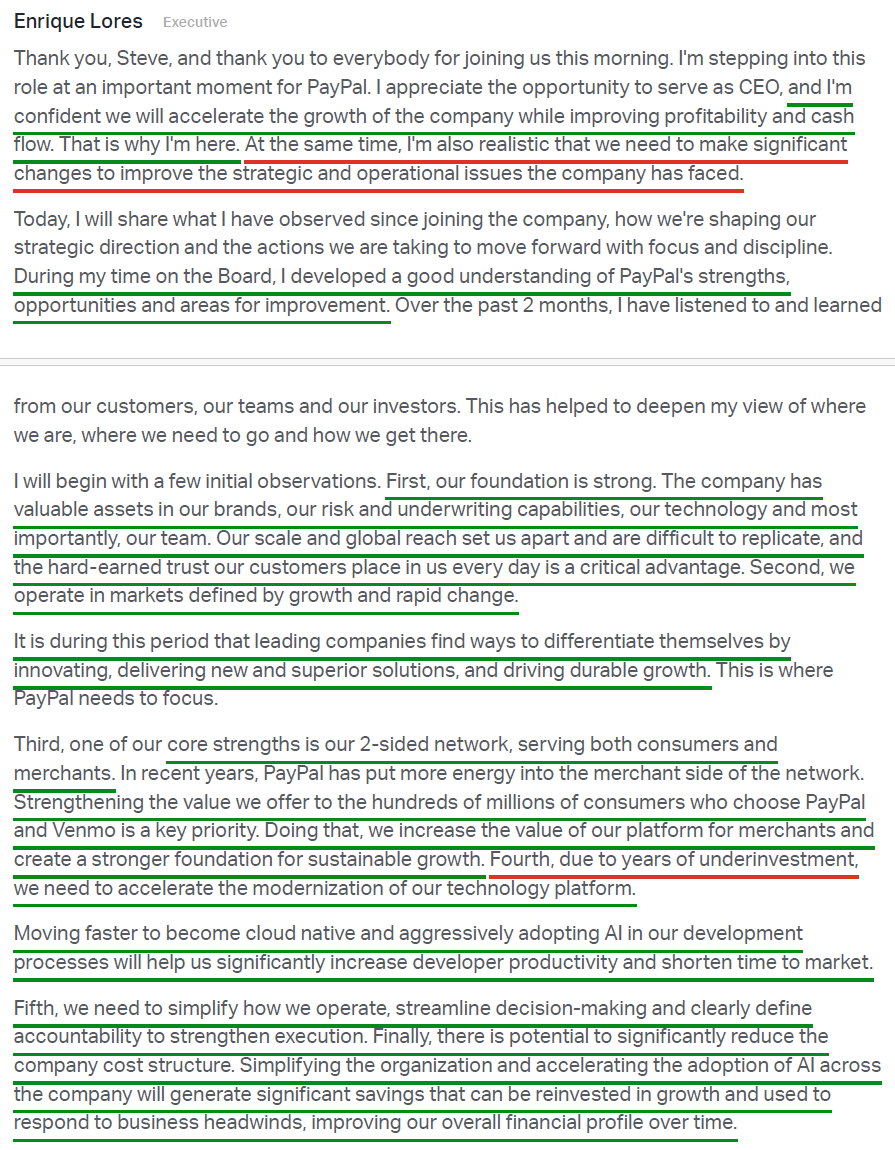
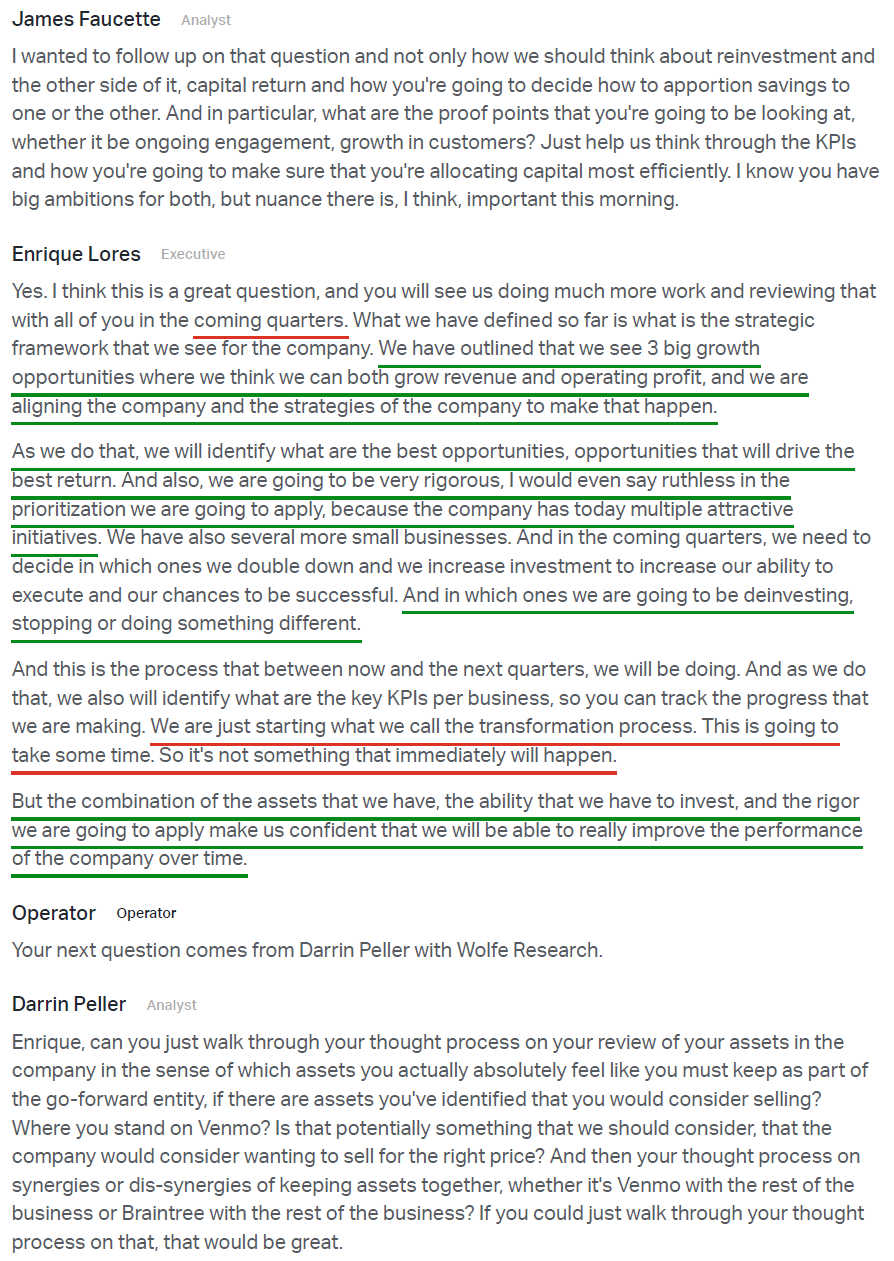
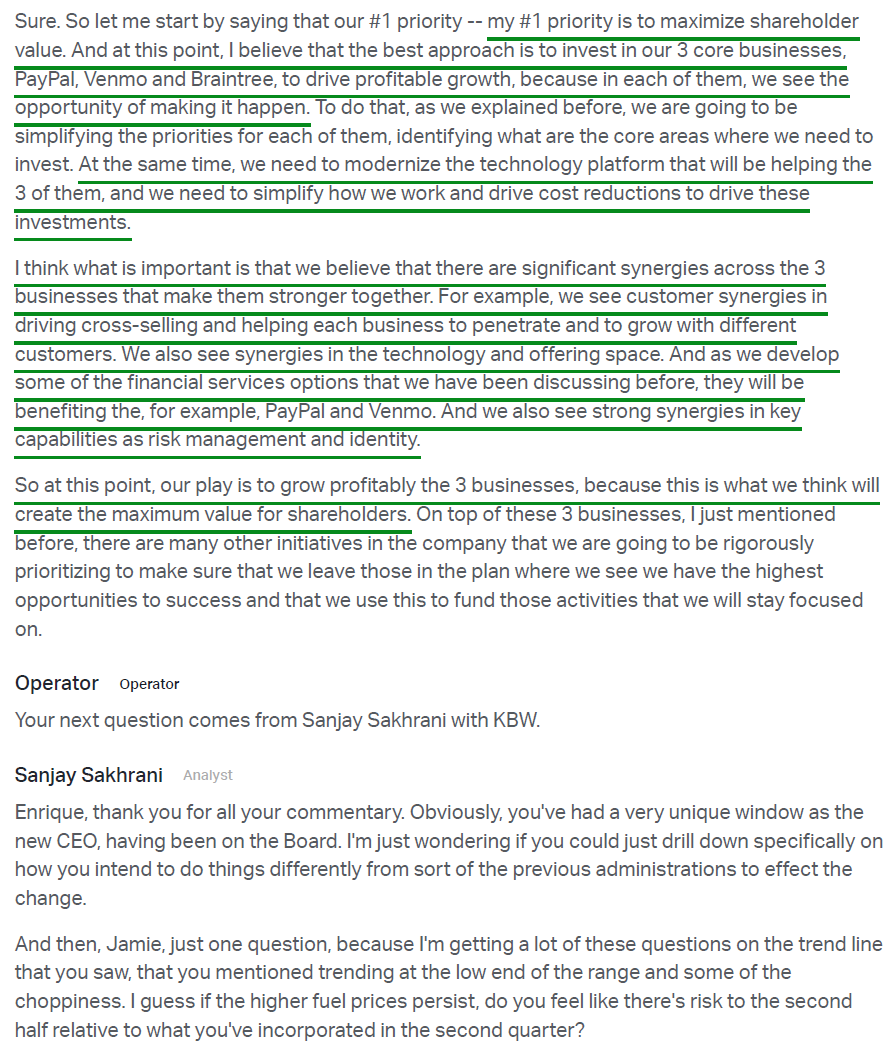
In Lores’s own words: “At this point, I believe that the best approach is to invest in our 3 core businesses, PayPal, Venmo and Braintree, to drive profitable growth, because in each of them, we see the opportunity of making it happen… What is important is that we believe that there are significant synergies across the 3 businesses that make them stronger together.”
We agree.
Lores spent the past five years on PayPal’s board, including the last eighteen months as Chairman, before stepping into the CEO role on March 1. He knows what’s working and what isn’t. He understands the strengths, the weaknesses, and the organizational bottlenecks better than anyone. If there’s one fair critique, it’s that after half a decade inside the boardroom, investors likely wanted more detail around the roadmap and timing of execution.
But that frustration says more about the market’s time horizon than it does about the underlying business, and we are more than happy to benefit from the impatience.
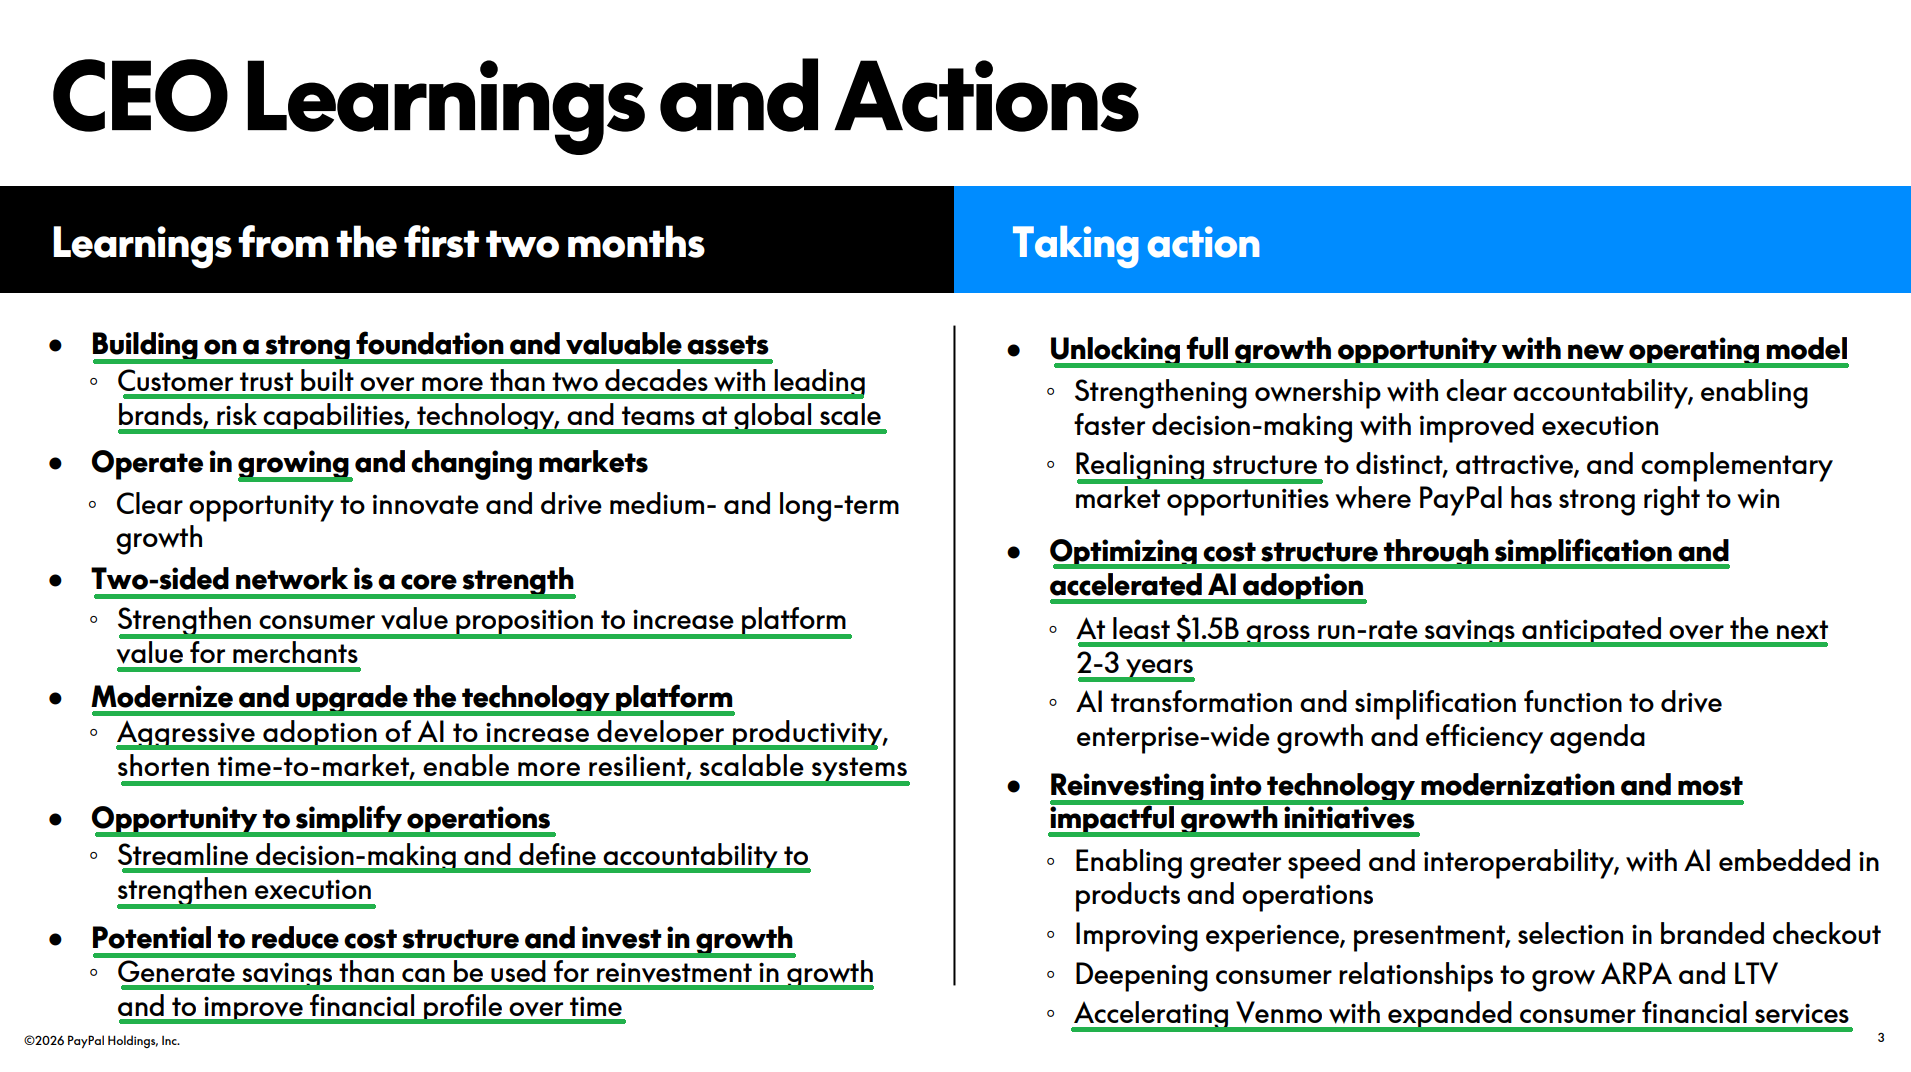
What Lores did provide was a high-level strategic framework going forward, and it reads like a page straight out of his HP playbook: simplify the organization, remove layers, aggressively cut costs, modernize infrastructure, and lean heavily into AI-driven productivity gains.
To do that, PayPal is reorganizing into three lines of business, each with a single leader and clear accountability, ending the multi-dimensional matrix-style structure that Lores himself admitted had “slowed decision-making and weakened execution.”
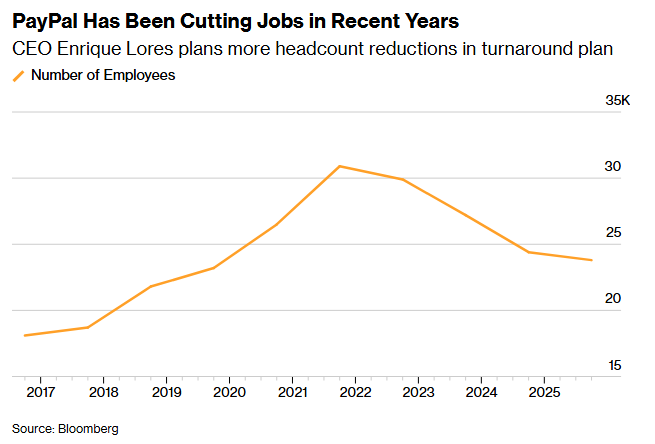
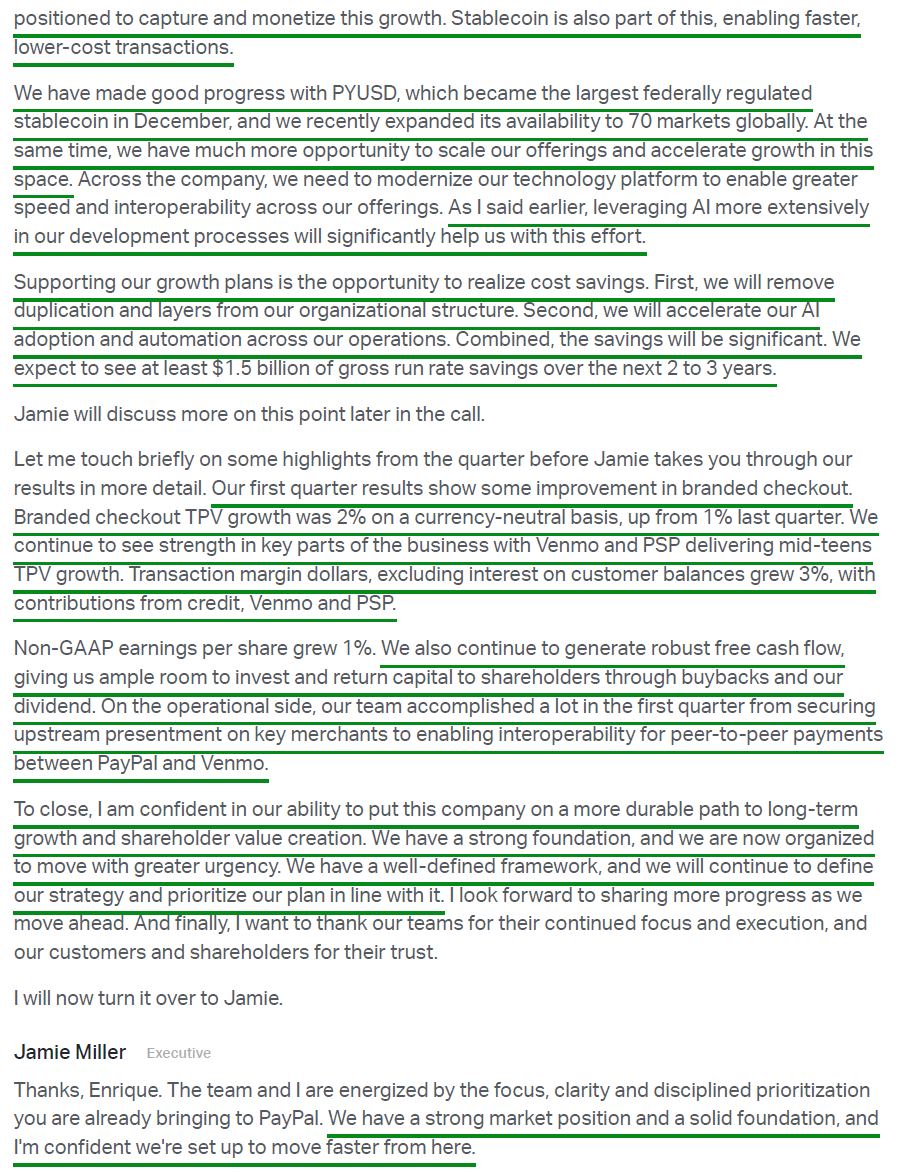
The centerpiece of the plan is a newly announced cost program: $1.5B in gross run-rate savings over the next two to three years through structural simplification and AI-enabled automation. With FY25 non-transaction operating expenses sitting at $9.1B, we suspect there’s plenty of low-hanging fruit. Reports also point to a ~20% workforce reduction, or ~4,760 of the 23,800 employees PayPal reported at year-end 2025, in lockstep with what we’ve seen across other fintech players and the broader tech sector.
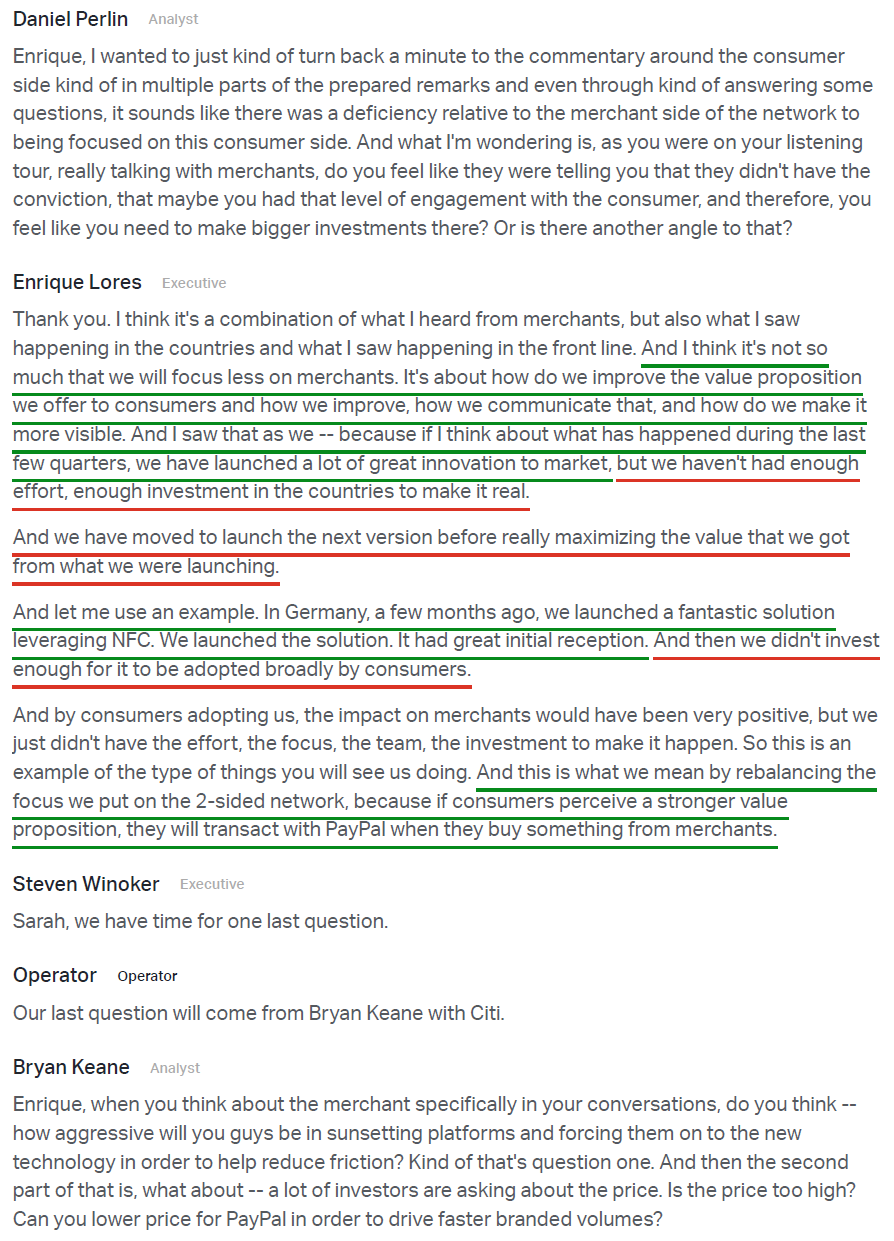
Importantly, this isn’t a slash-and-burn exercise designed to manufacture short-term earnings growth. You cannot cut your way to durable growth. The savings are expected to be reinvested into technology modernization, branded checkout, Venmo, and consumer financial services, all areas where PayPal still possesses massive competitive advantages but has under-executed operationally in recent years.
As long-term shareholders, that is exactly what we want to see.
The other half of the Lores playbook may prove even more powerful over time: aggressive share repurchases.
During his six years running HP, Lores retired 37.5% of the company’s shares outstanding while the stock climbed from trough levels of ~$10 to a peak of ~$37.
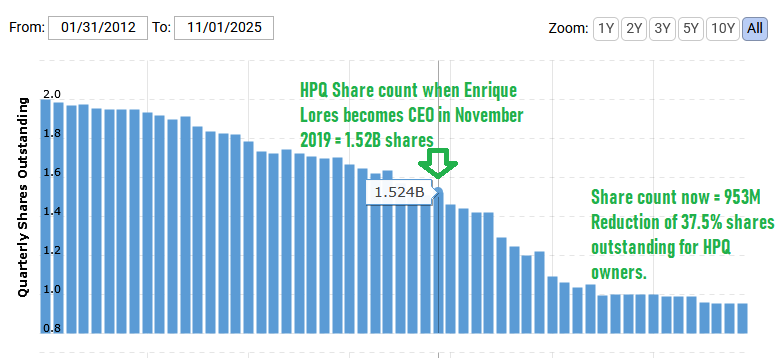
We expect a similar outcome at PayPal.
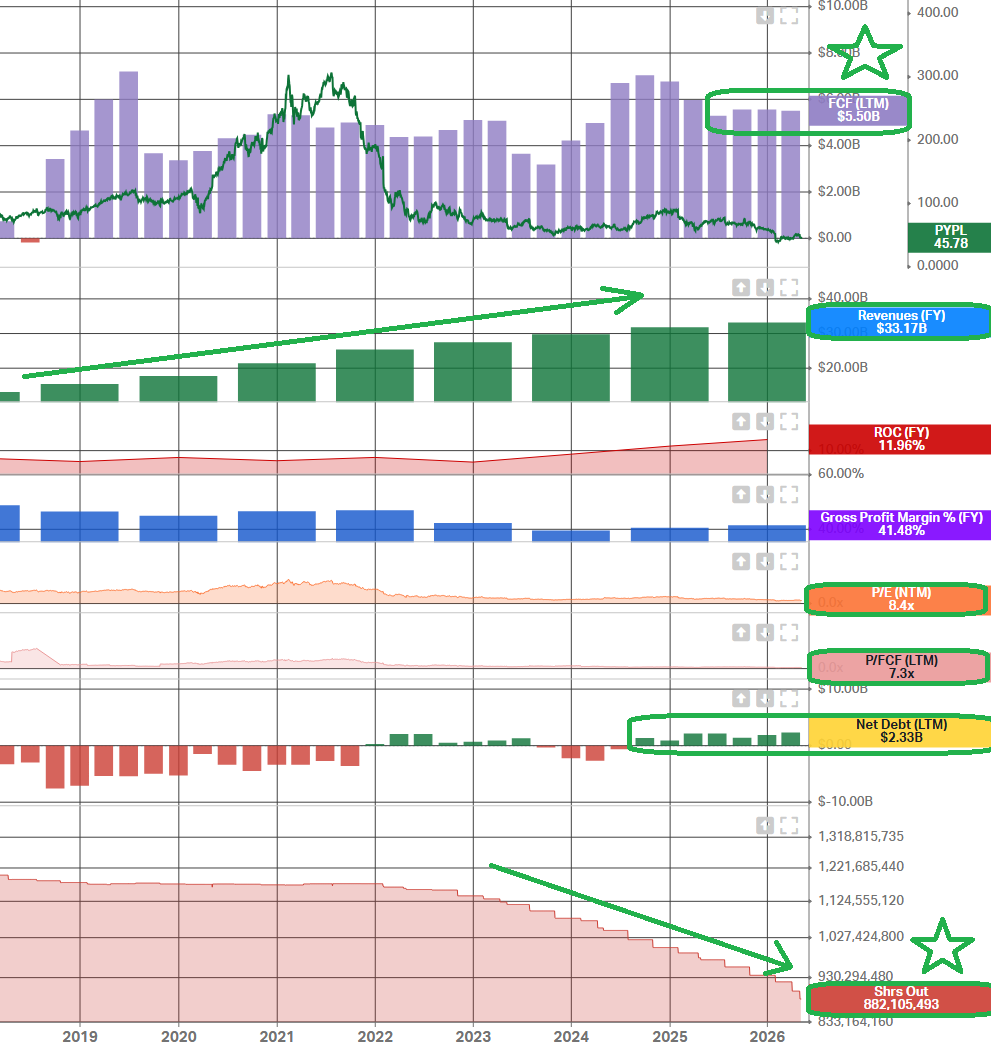
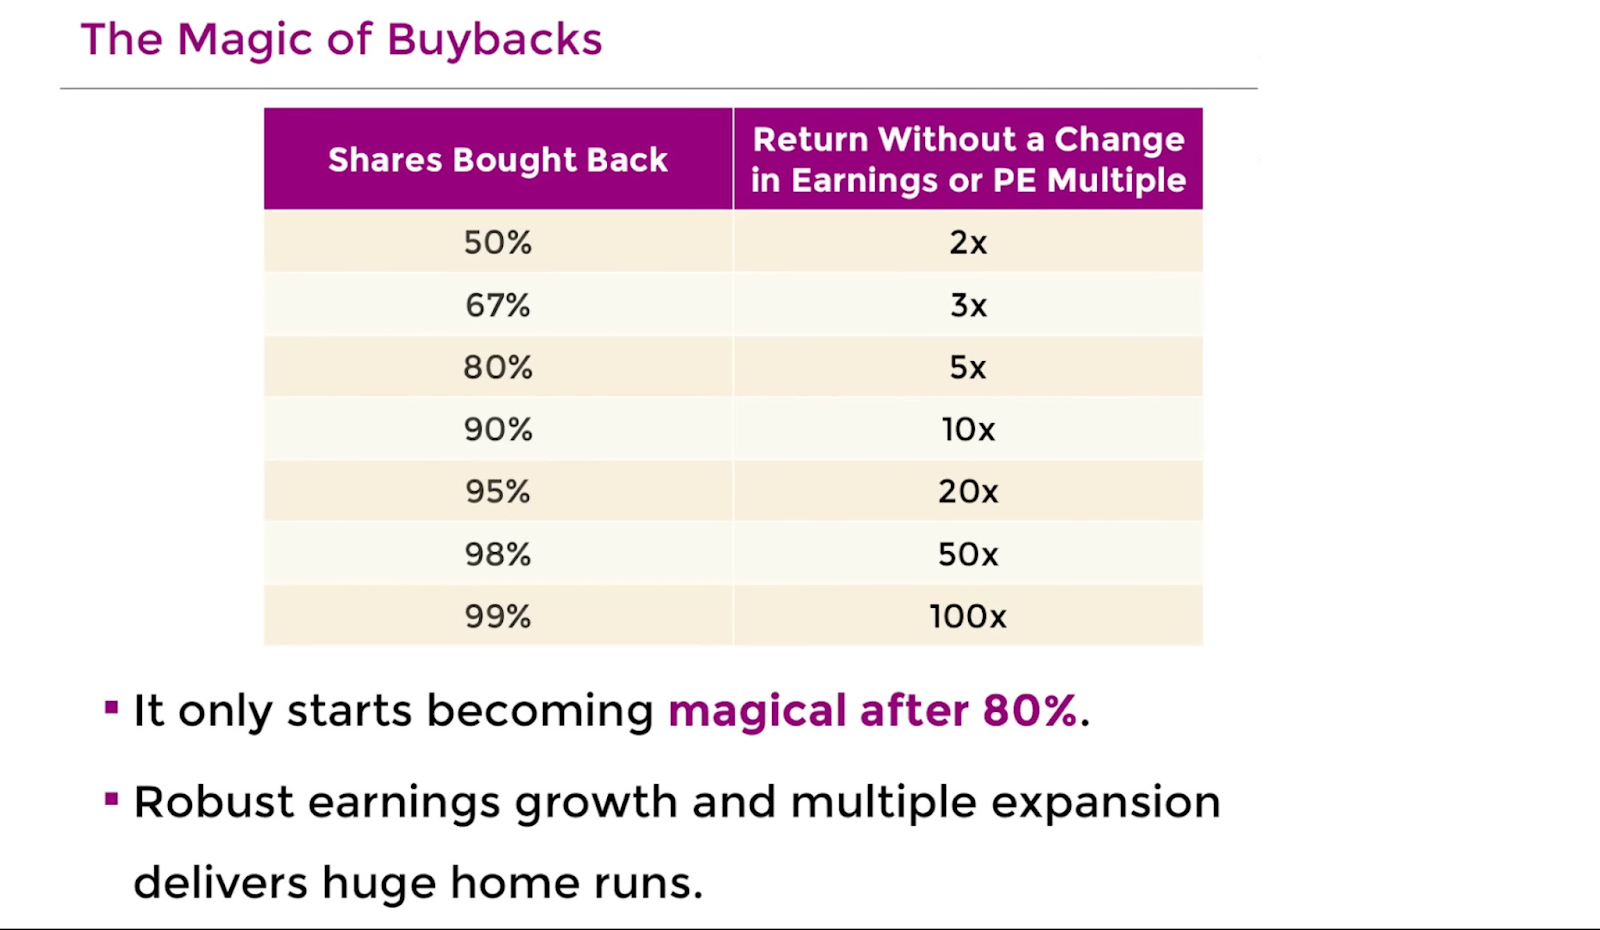
Some quick back-of-the-envelope math puts the power of PayPal’s aggressive buyback program into perspective. ~$40B market cap. ~$6B+ in annualized free cash flow. ~$6B per year earmarked for share repurchases. This means PayPal can retire ~15% of the float annually, entirely self-funded, while still maintaining a net cash position approaching $2B.
At that rate, the entire current share count gets retired in 6-7 years. That’s before any multiple expansion off today’s left-for-dead 8x earnings or any acceleration in the underlying business.
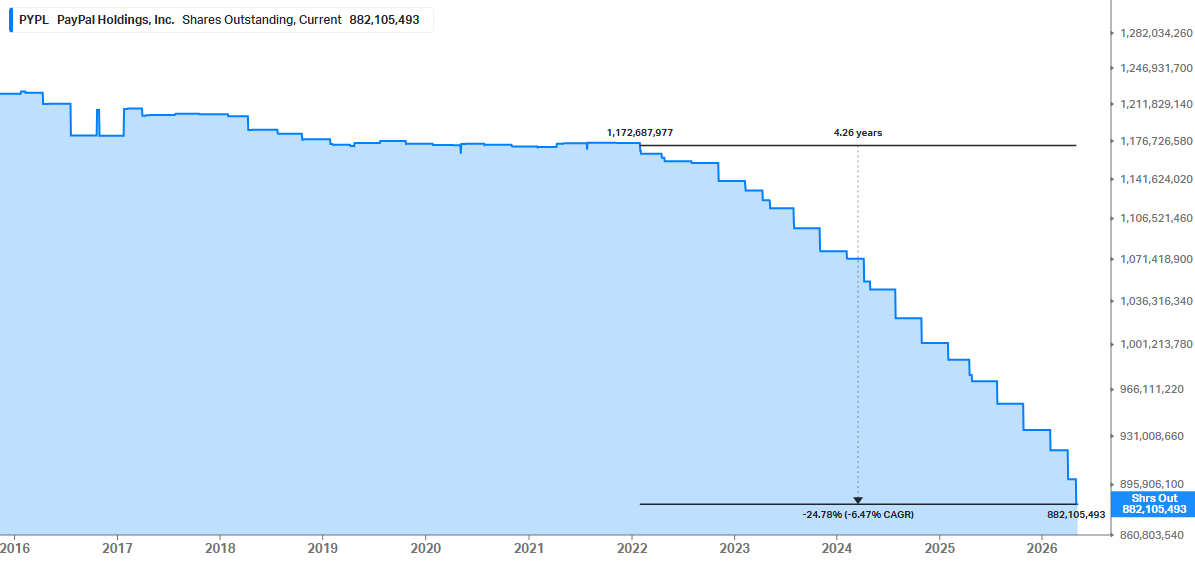
With the share count already down 25% over the past ~four years, the “magic” of buybacks only gets more powerful from here.
You would be hard-pressed to find another business of this quality trading at a ~15% free cash flow yield. Let alone a global payments leader powering the #1 and #2 most popular mobile payment apps in the U.S., processing every Uber ride and Ticketmaster order, and operating the world’s largest two-sided payment network with 439M active accounts. All priced as though the lights are going out.
So while fast money rotates toward the next narrative-driven, flavor-of-the-day trade, we will continue doing what we have always done when other high-quality companies find themselves in dislocation: zoom out, burden ourselves with the facts, and hoover up even more cheap shares alongside the company.
At the end of the day, Enrique Lores was hired to execute a multi-year turnaround, not manage the stock for a quarter. One print in, the framework is clear, the cash machine is humming, and the Lores era is just getting started.
Q1 Earnings Breakdown
10 Key Points
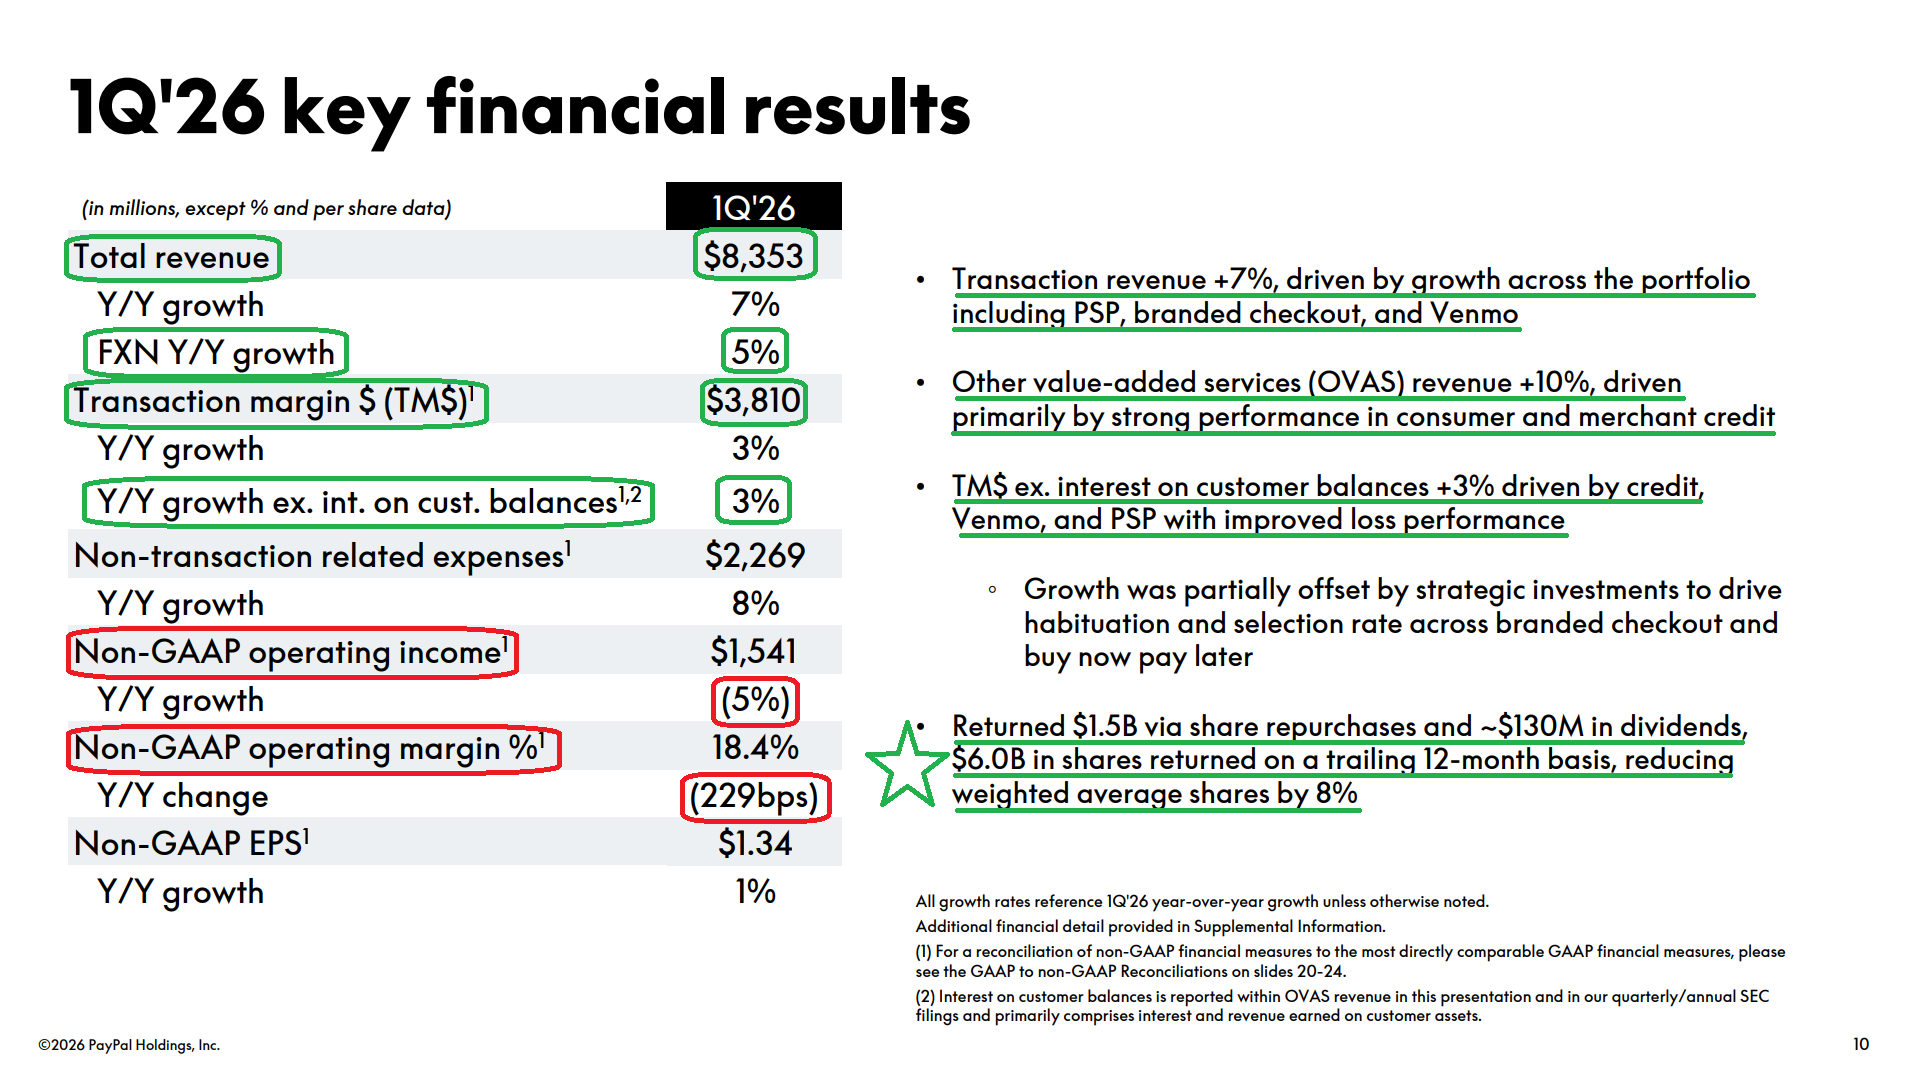
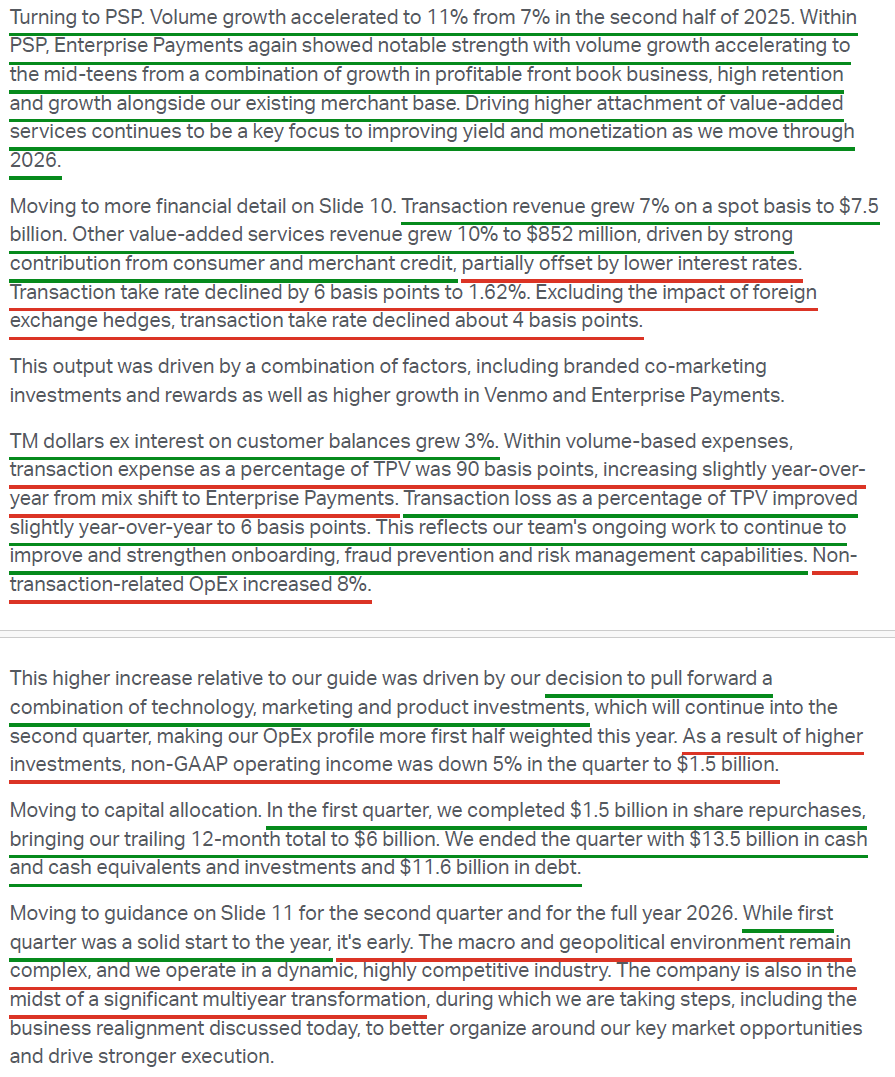
1) PayPal reported Q1 revenue of $8.35B (+7% Y/Y, +5% FXN), beating consensus of $8.05B by ~$340M, with U.S. revenue growing 9% to $4.88B and international revenue up 4% reported (flat FXN) to $3.47B. Transaction revenue grew 7% to $7.5B, while other value-added services rose 10% to $852M, driven by strength in consumer and merchant credit, partially offset by lower interest rates. Adjusted EPS came in at $1.34 (+1% Y/Y), beating consensus of $1.27 by $0.07.
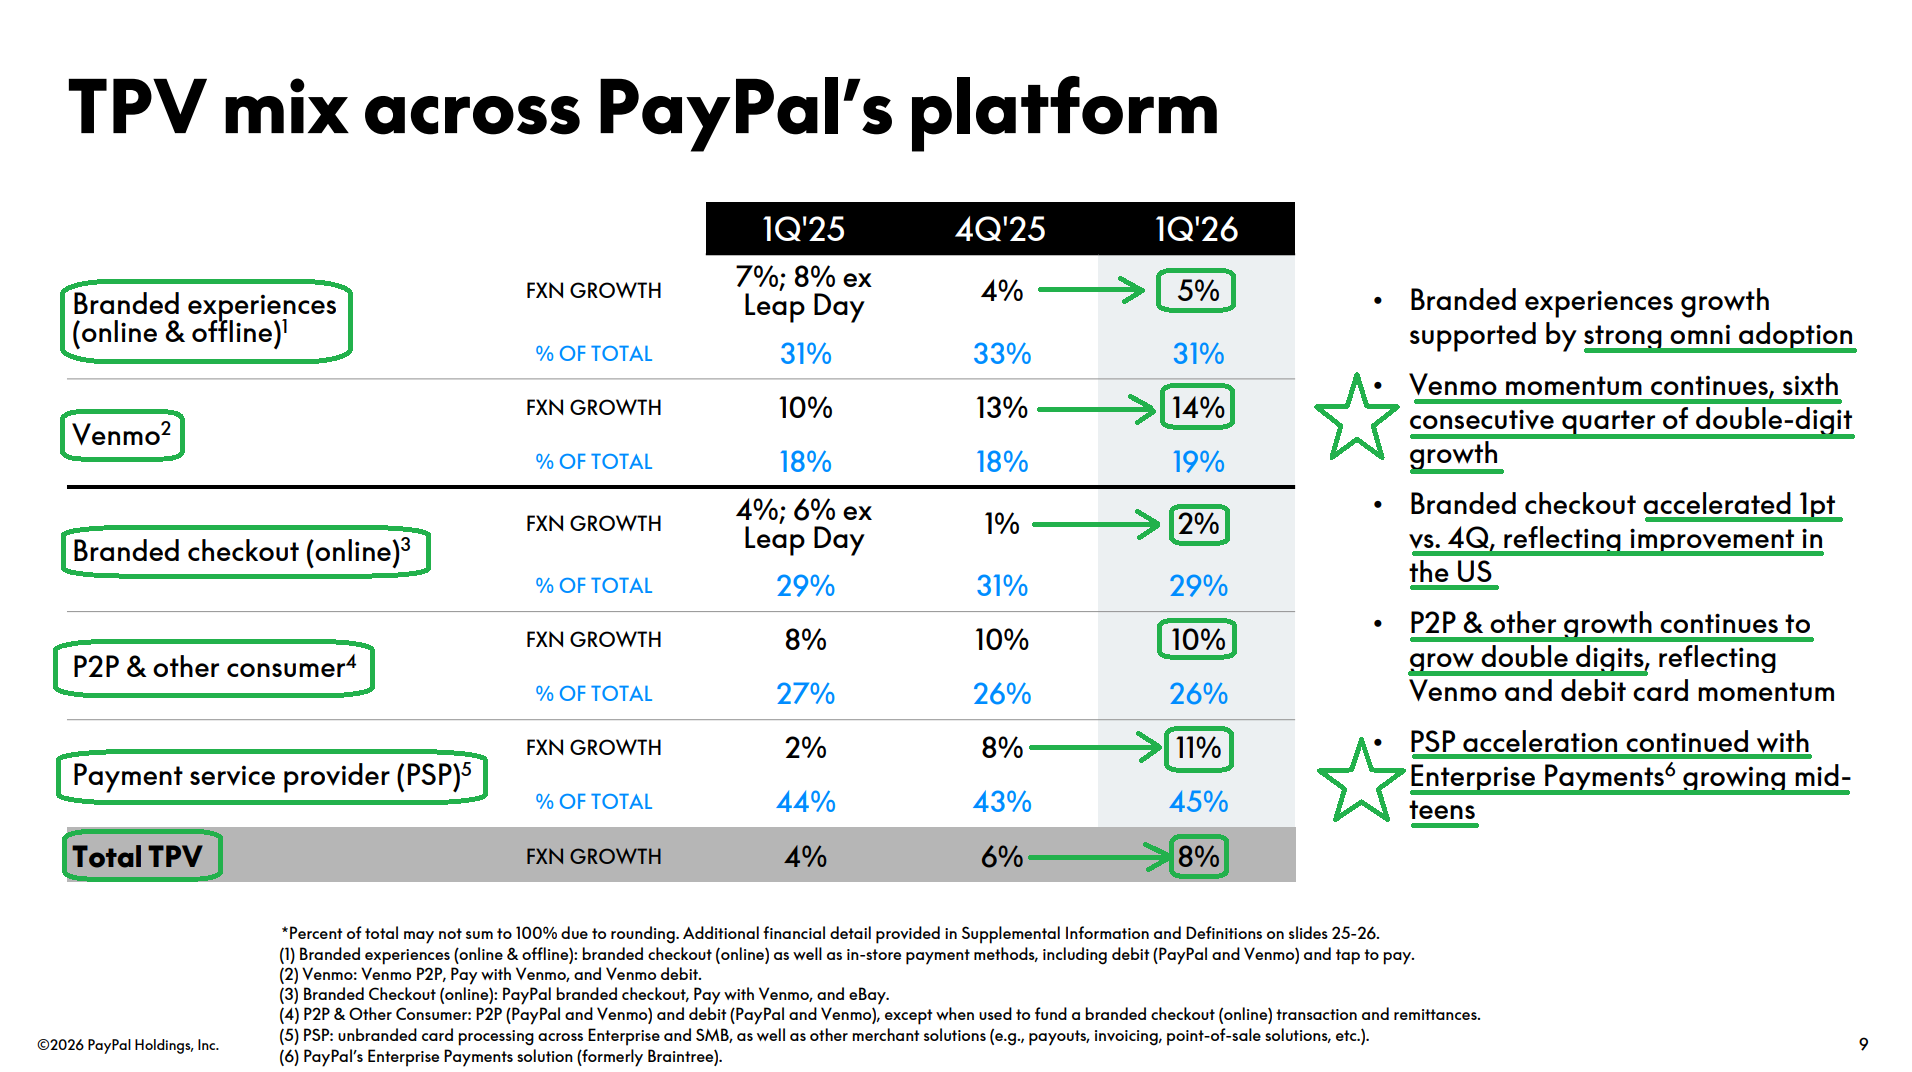
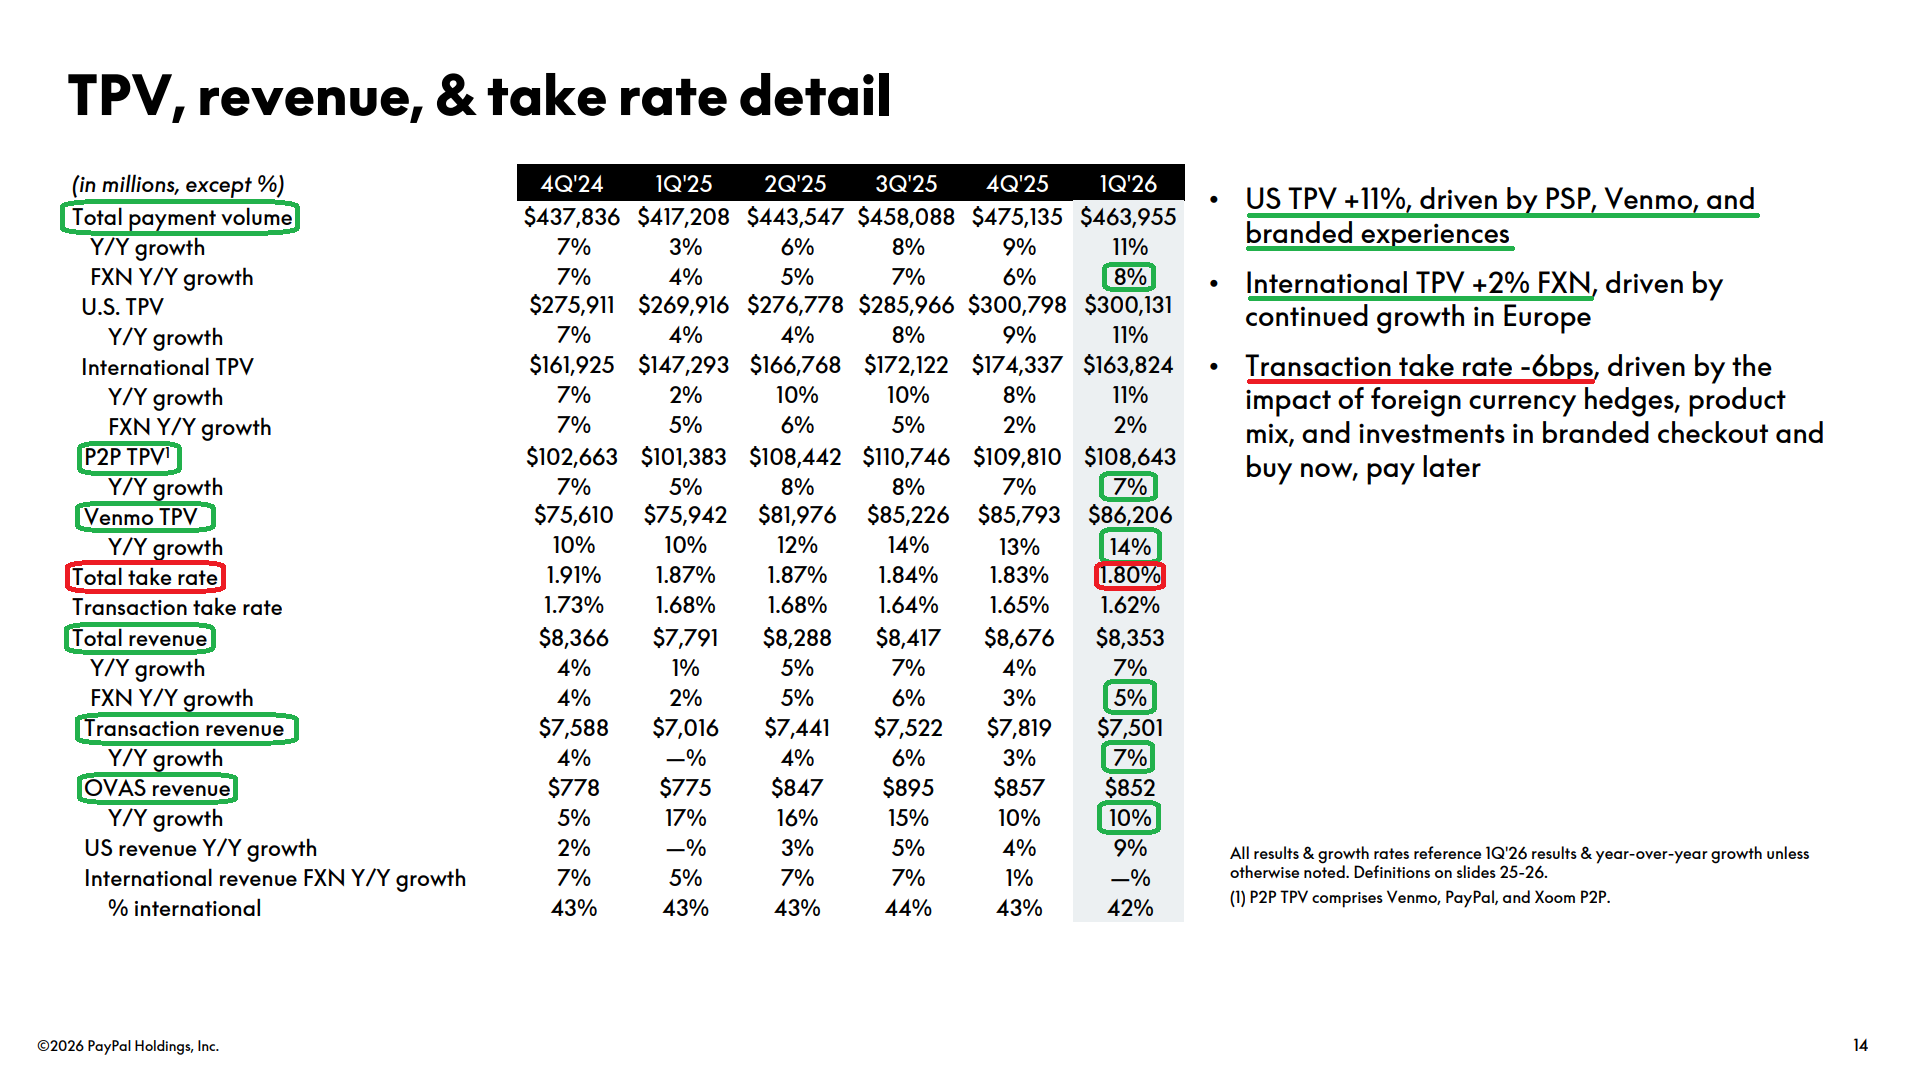
2) Venmo delivered its sixth consecutive quarter of double-digit growth, with TPV accelerating to +14% Y/Y FXN from +13% last quarter, reaching a new high of $86.2B and coming in ahead of Street expectations of +12%. Pay with Venmo grew 34% and continues to take share from other payment methods. Management called Venmo a key component of the go-forward growth plan, with a focus on ARPU expansion through deeper attachment of financial services, including debit, credit, savings, and investing.
3) The PSP segment delivered another quarter of accelerating growth, with TPV increasing +11% to $208.8B versus +8% last quarter. Enterprise Payments (Braintree) volume growth also accelerated into the mid-teens, driven by a combination of profitable front-book growth, strong retention, and continued expansion with existing merchants. Following the segment’s multi-quarter price-to-value reset, the business is now contributing meaningfully to TM$ growth. Looking ahead, management remains focused on increasing attachment rates of value-added services across the segment, which is expected to support improved yield and monetization as the year progresses.
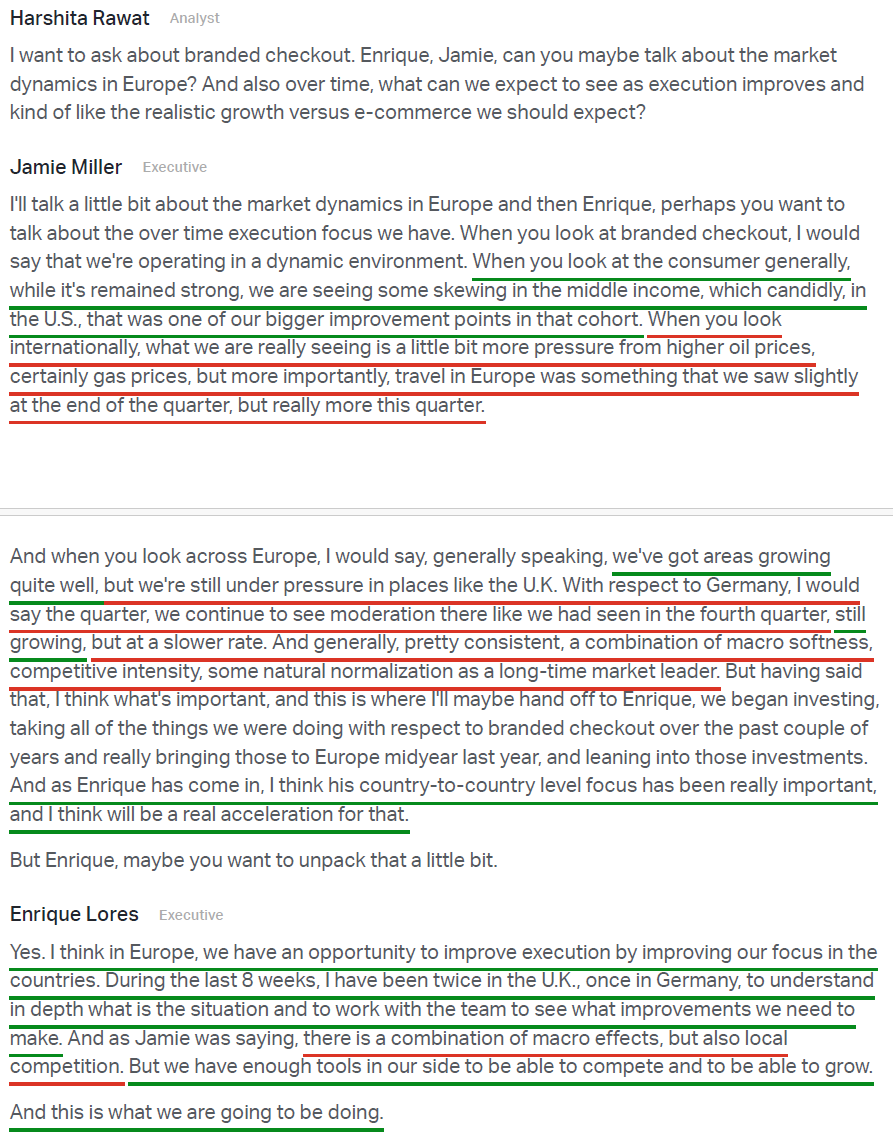
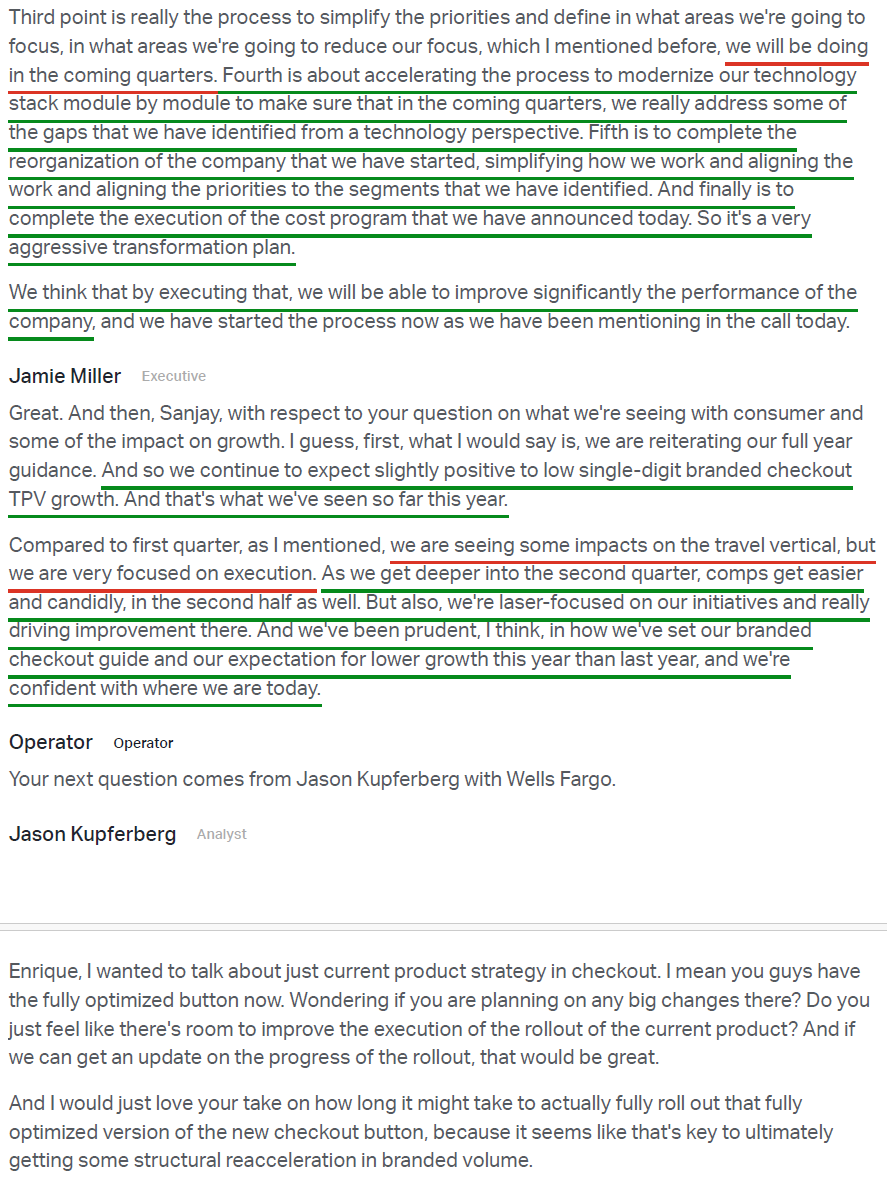
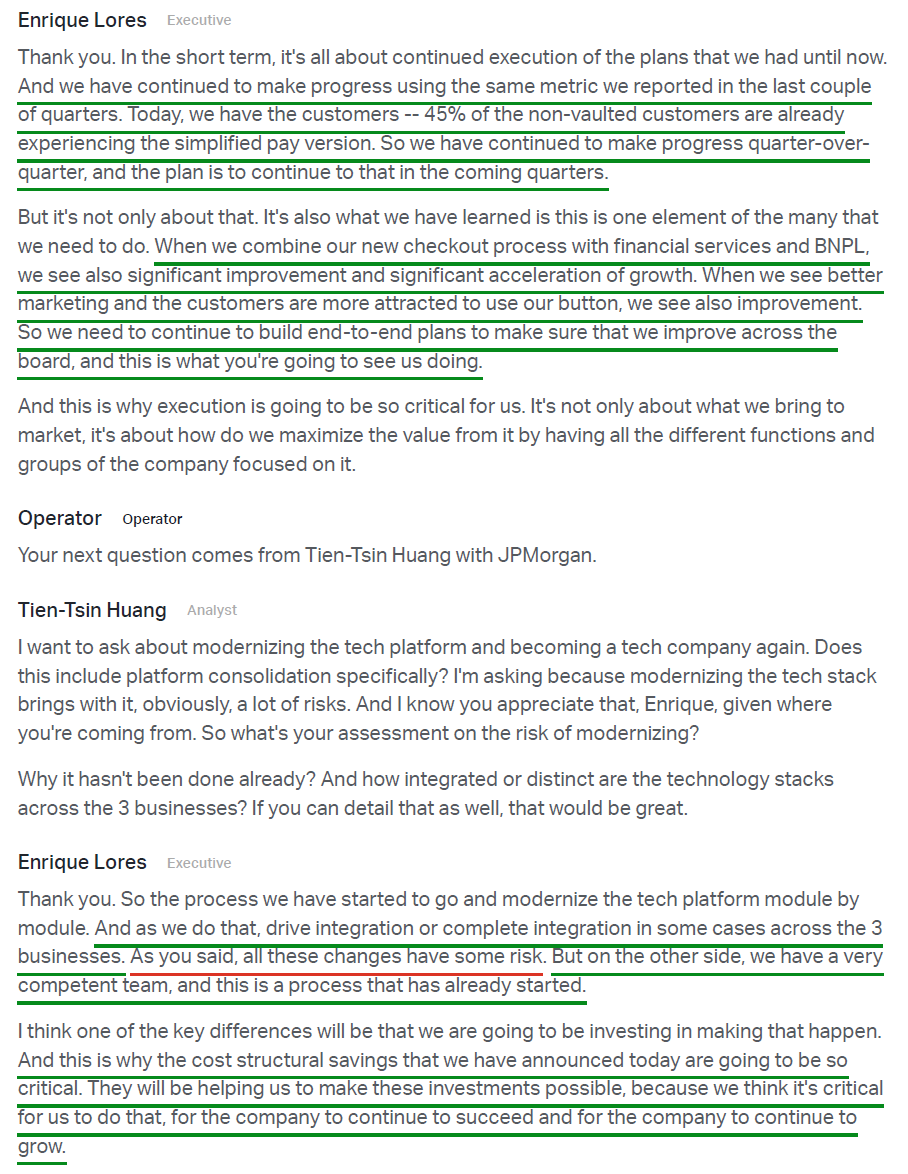
4) Branded checkout TPV accelerated 100 bps to $134.5B (+2% FXN) from +1% last quarter, beating expectations and showing modest sequential improvement. Meanwhile, branded experiences TPV (online checkout, PayPal/Venmo debit, tap-to-pay) accelerated to $143.8B (+5% FXN) from +4% last quarter, supported by BNPL growth of 23%, Pay with Venmo growth of 34%, and debit card and tap-to-pay spend growing 60% Y/Y. ~45% of non-vaulted customers are now experiencing the simplified checkout, with the new checkout experience, combined with financial services and BNPL, continuing to drive significant acceleration in growth. Quarter-to-date, branded checkout TPV growth has decelerated to ~1%, driven by a slowdown in travel and more muted European growth, particularly in the U.K. and Germany, with full-year branded checkout TPV currently tracking at the low end of the slightly positive to LSD guidance range.
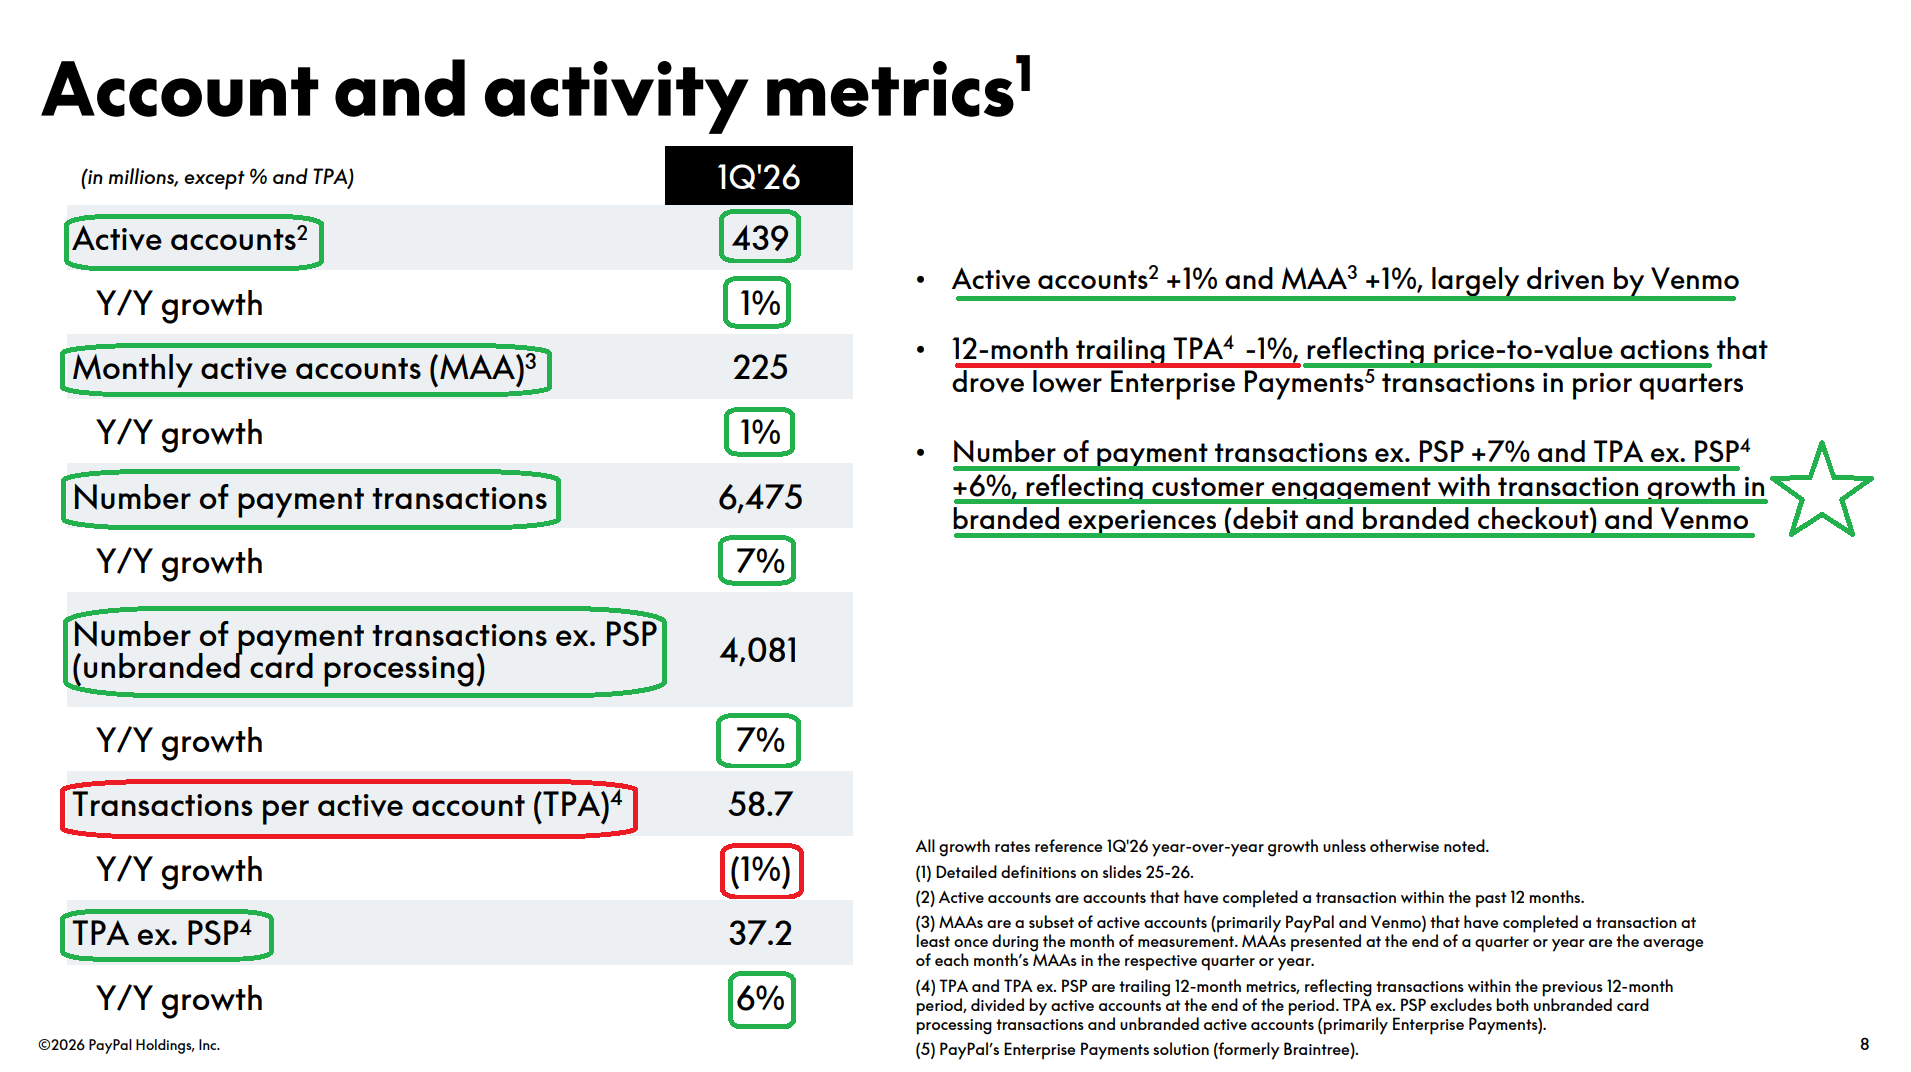
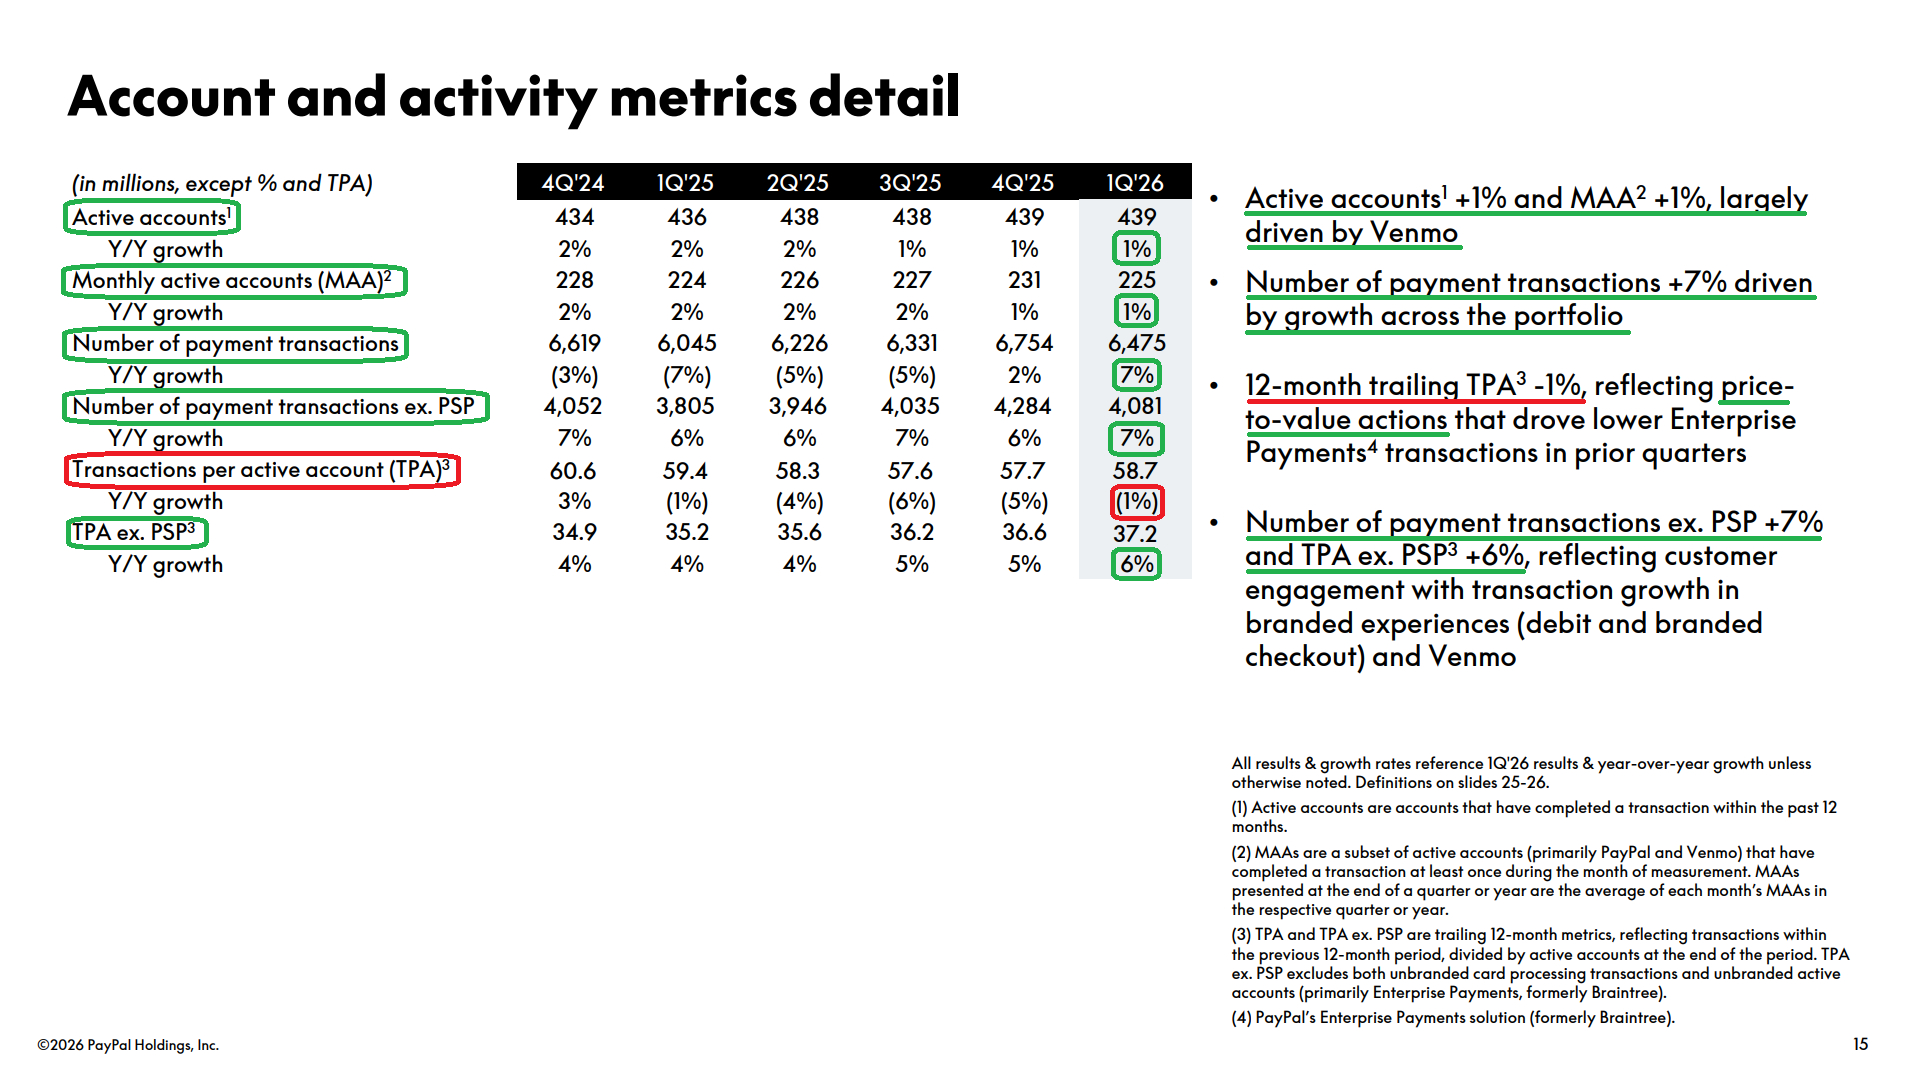
5) Transactions per active account on a TTM basis declined 1% to 58.7, driven by price-to-value actions that affected Enterprise Payments transactions in prior quarters. Backing out PSP, TPA increased 6% to 37.2, driven by customer engagement growth in branded experiences and Venmo. Total active accounts increased 1% Y/Y to 439M (down 0.04% sequentially), while monthly active accounts grew 1% to 225M, with active account growth largely driven by Venmo.
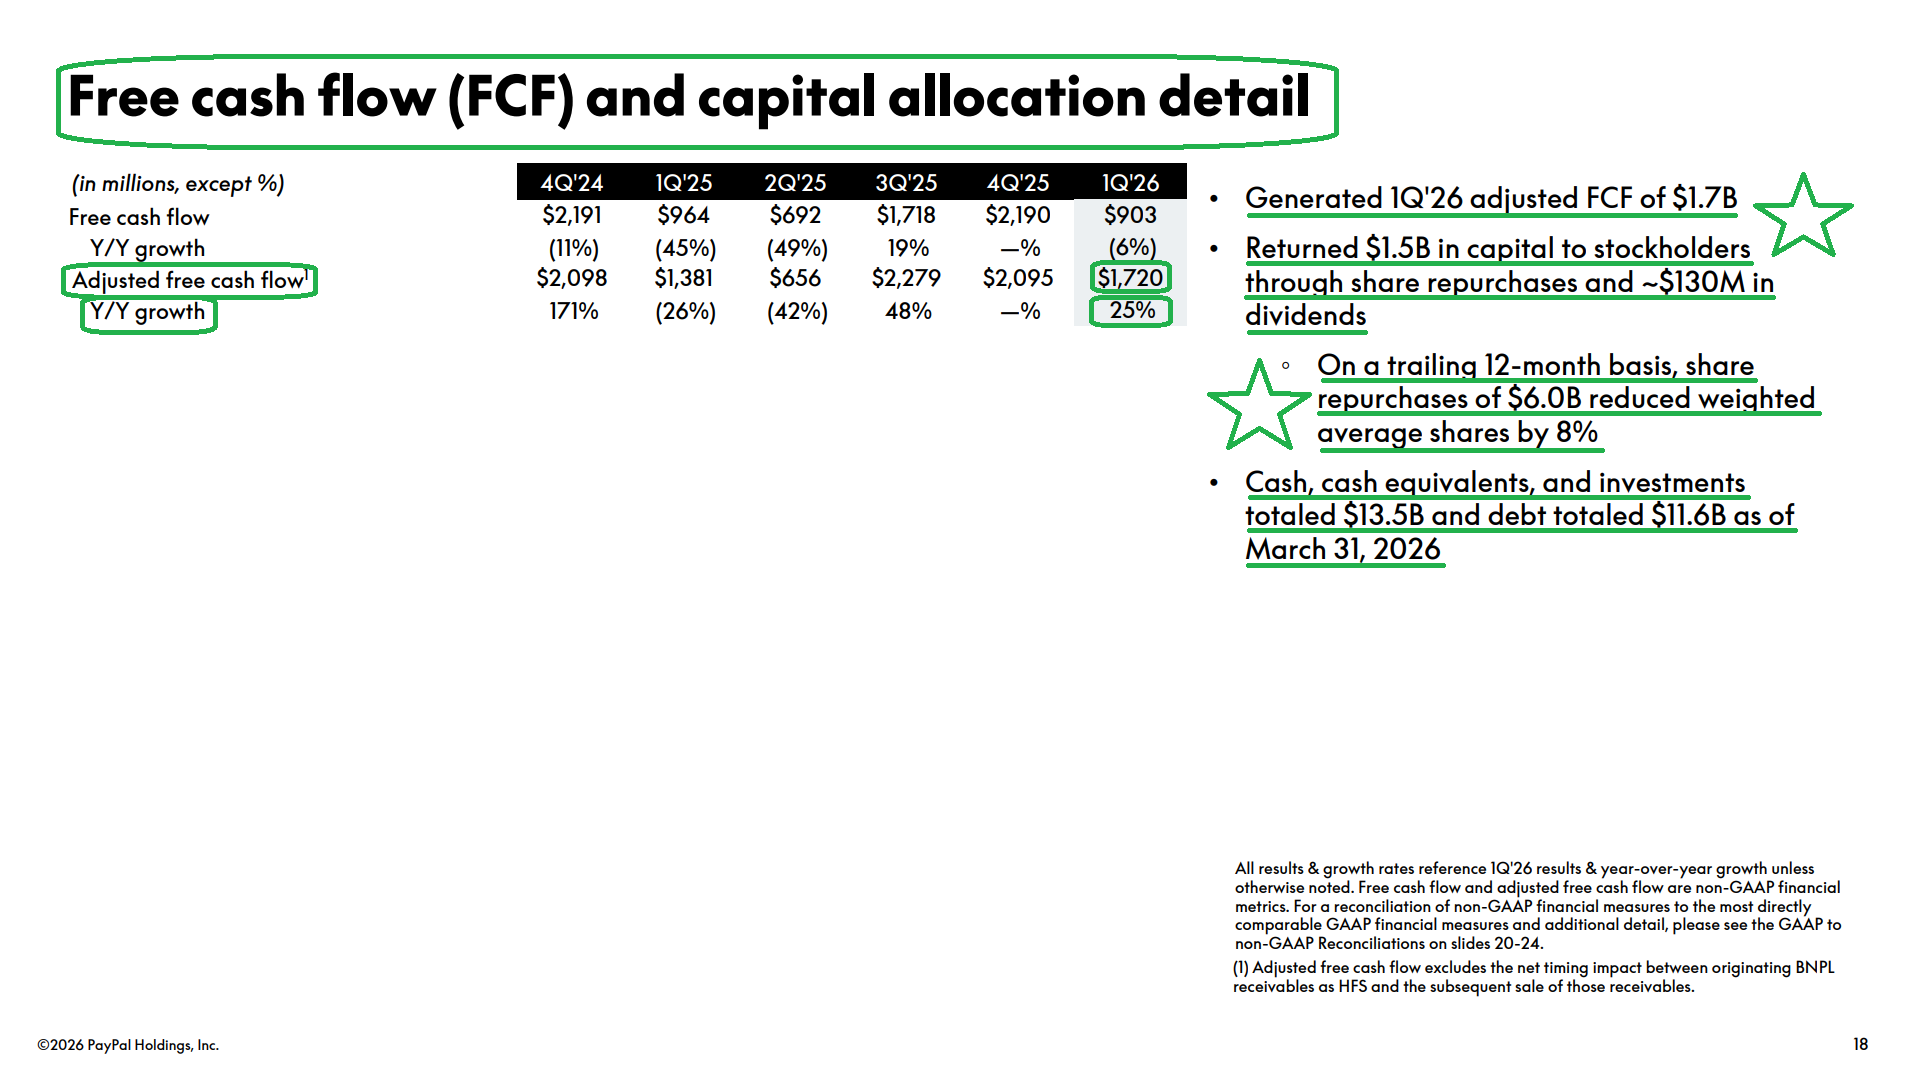
6) PayPal generated $1.7B in adjusted free cash flow (+25% Y/Y), bringing TTM adjusted FCF to ~$6.8B. Management reiterated guidance of at least $6B of adjusted FCF for FY26, implying a ~15% FCF yield at current prices. Management repurchased $1.5B (~34M shares) in Q1, bringing TTM buybacks to $6B (~100M shares) and reducing weighted average diluted shares by 8% Y/Y. PayPal reiterated expectations of ~$6B in buybacks for the full year, which, combined with a dividend yield of ~1.2%, brings total shareholder yield to >16%. Plenty of dry powder remains, with cash, equivalents, and investments totaling $13.5B against $11.6B of debt as of quarter-end.
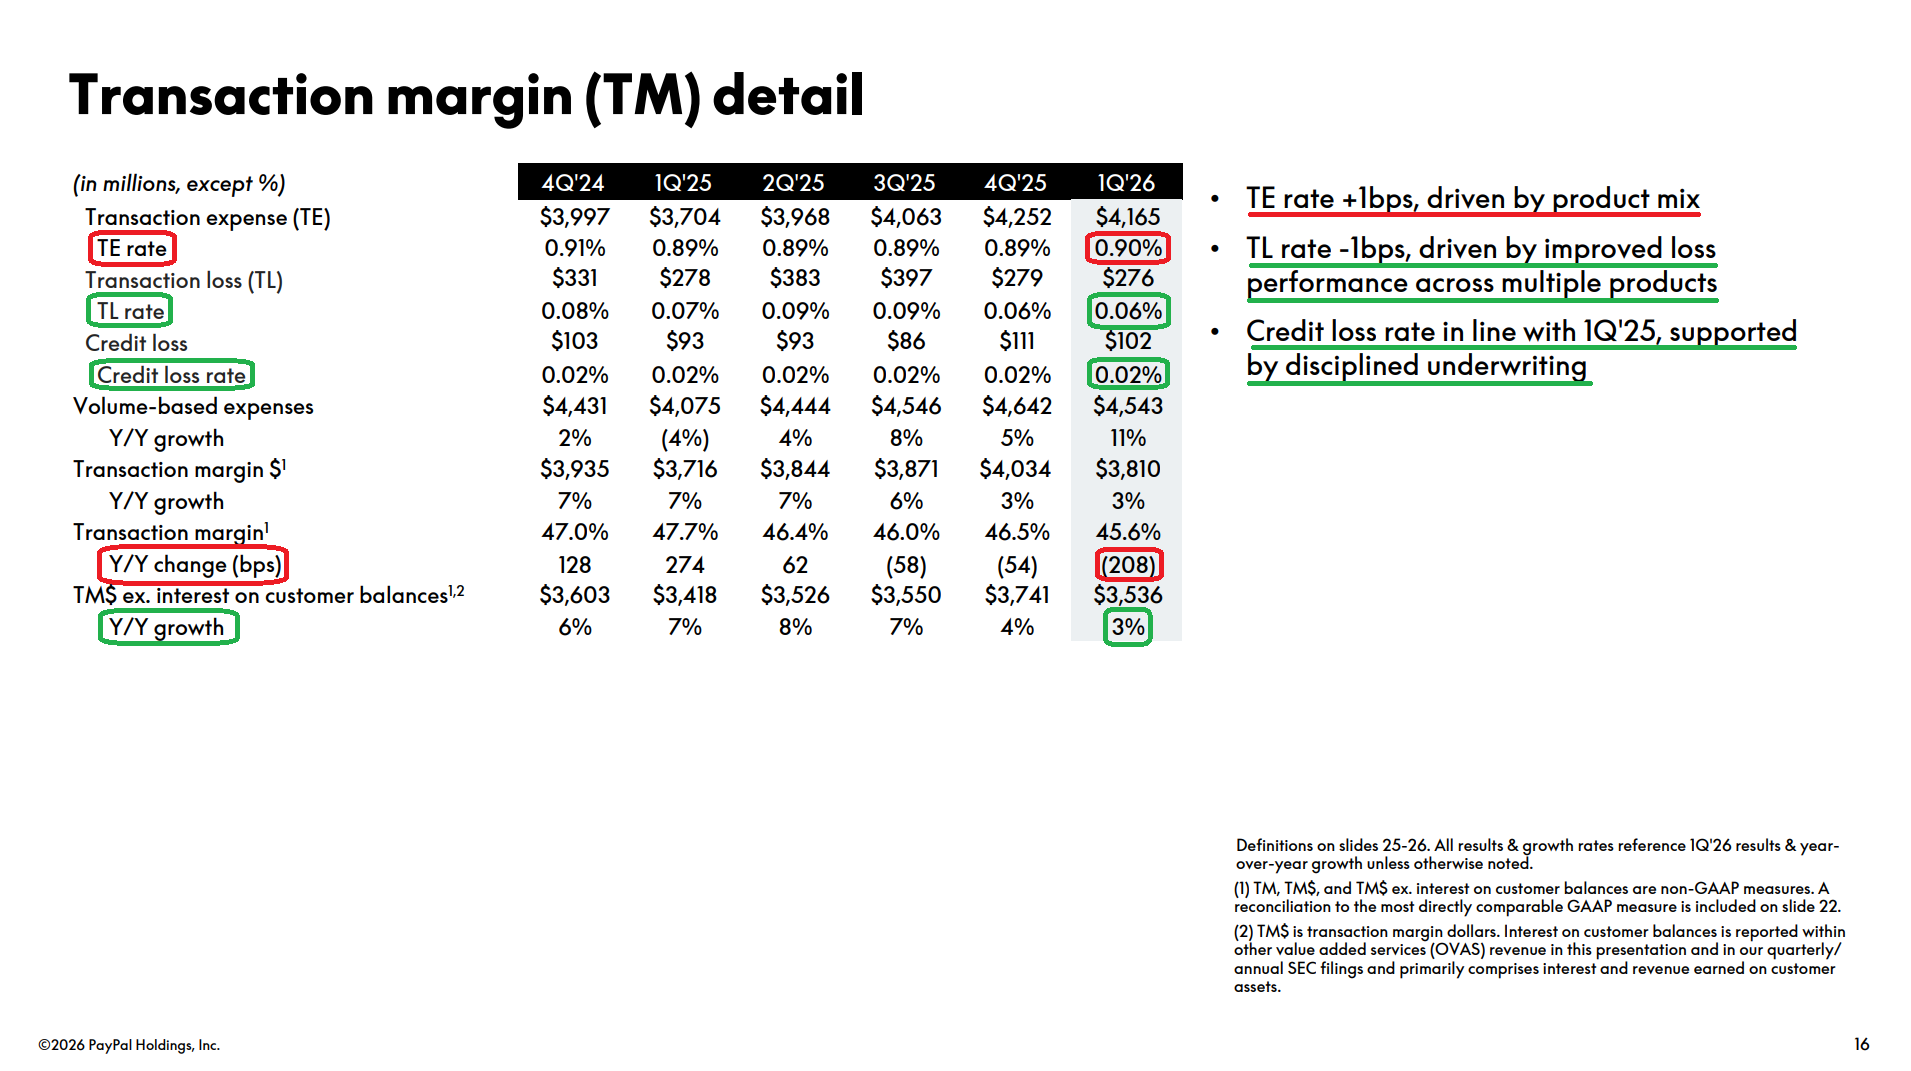
7) Transaction margin dollars grew 3% Y/Y to $3.81B, beating consensus of $3.67B by ~$140M, with TM ex-interest on customer balances also up 3% to $3.54B. Growth was broad-based, led by credit performance, Venmo monetization, PSP profitability, and loss improvement across multiple products, more than offsetting the ~3 pt headwind from branded checkout investments that will continue through 2026. Transaction margin of 45.6% came in line with consensus but contracted 208 bps Y/Y from 47.7%, reflecting the investment ramp and mix shift. Transaction loss rate improved 1 bp Y/Y to 0.06%, while transaction expense increased 1 bp to 0.90% on Enterprise mix.
8) Total payment volume came in at $464.0B (+11% reported and +8% FXN), beating consensus of $446.8B and accelerating from last quarter’s +6% growth. Growth was led by Venmo at +14% to $86.2B, followed by PSP at +11% to $208.8B, P2P & other consumer at +10% to $120.6B, branded experiences at +5% to $143.8B, and branded checkout at +2% to $134.5B. By region, U.S. TPV grew 11% to $300.1B, while international TPV grew 2% FXN to $163.8B.
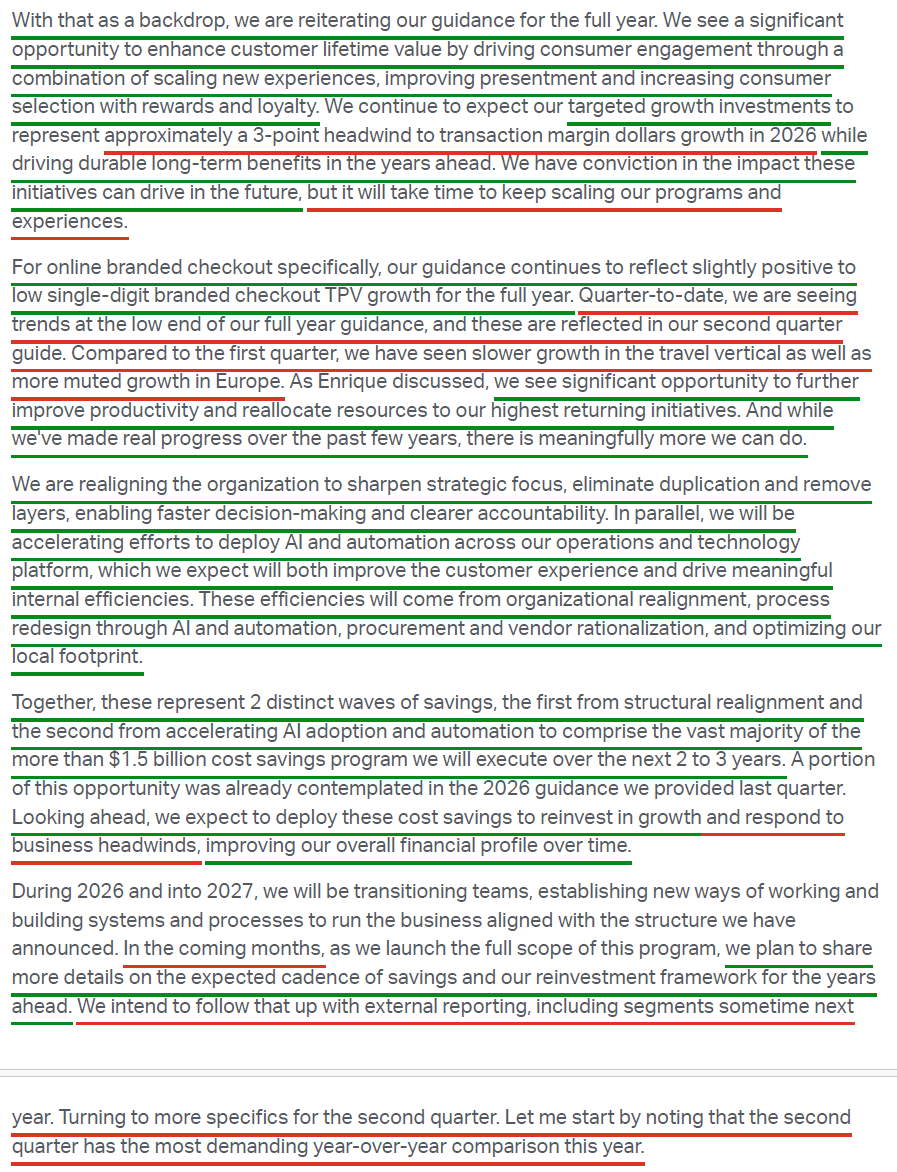
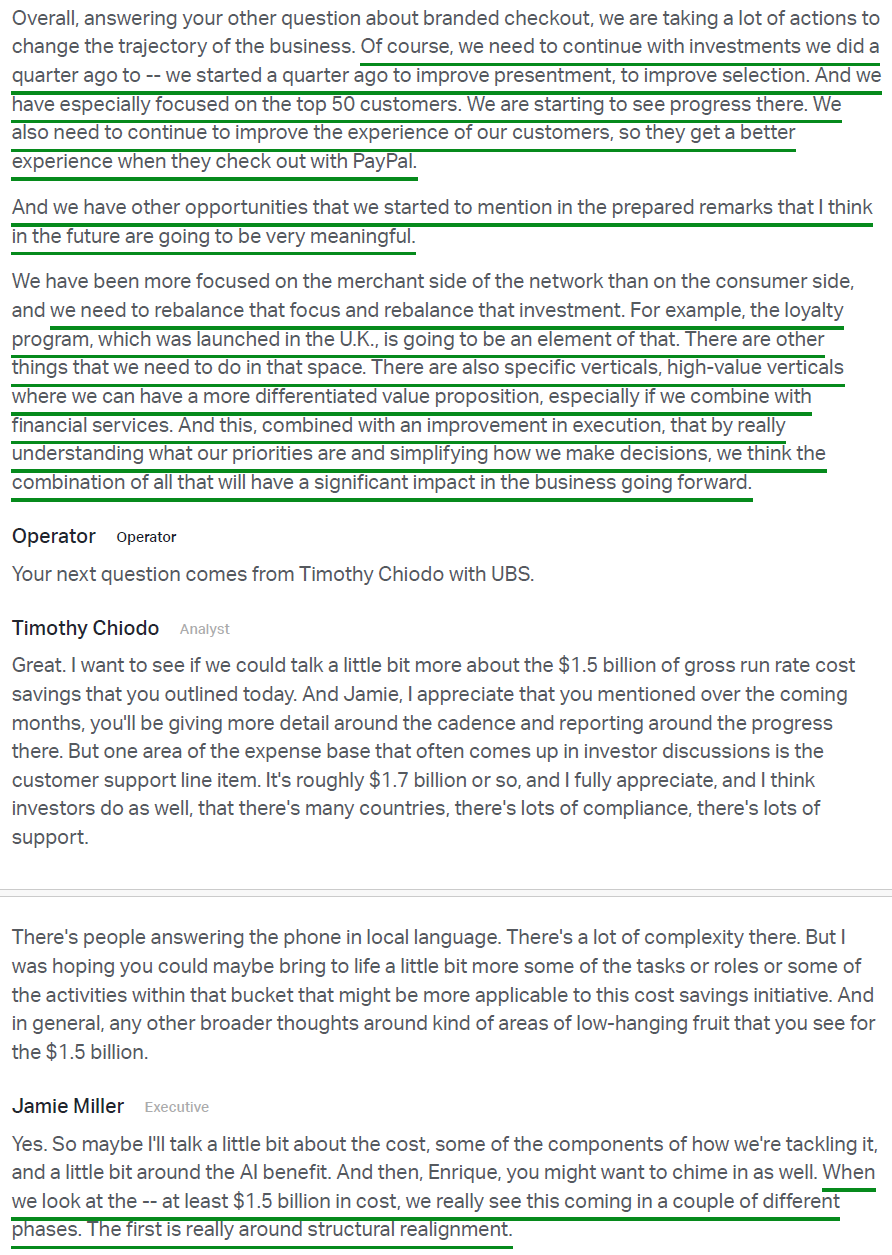
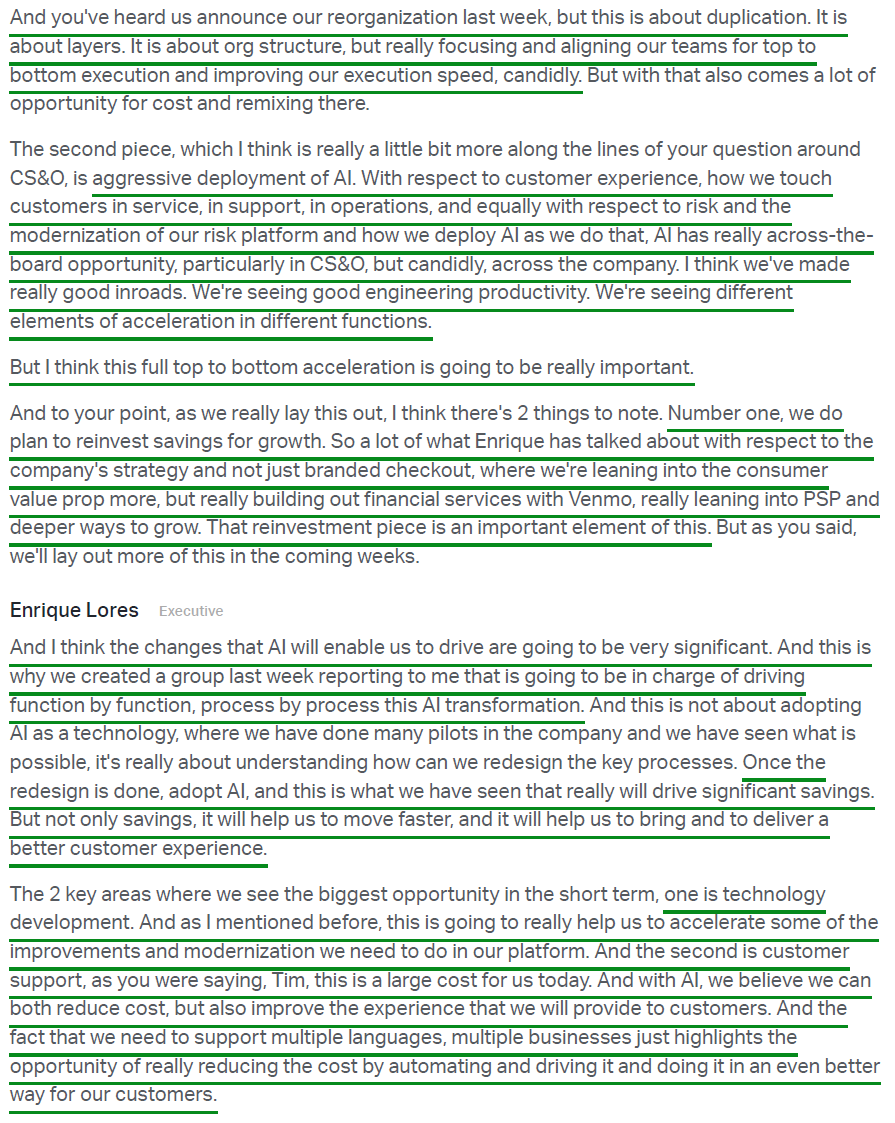
9) Management announced a new $1.5B+ gross run-rate cost savings program to be executed over the next two to three years, rolled out in two phases: first, structural realignment by removing duplication and layers from the organization, and second, aggressive AI and automation deployment across operations, with the biggest near-term opportunities in technology development and customer support. With FY25 non-transaction operating expenses sitting at $9.1B, there is likely plenty of low-hanging fruit, and while not officially confirmed, reports point to a ~20% workforce reduction, or ~4,760 positions based on the 23,800 employees PayPal reported at year-end 2025. Savings will be reinvested into technology modernization, branded checkout, Venmo, and consumer financial services, with more detail on the cadence and reinvestment framework expected in the coming months, and with segment-level reporting expected sometime next year.
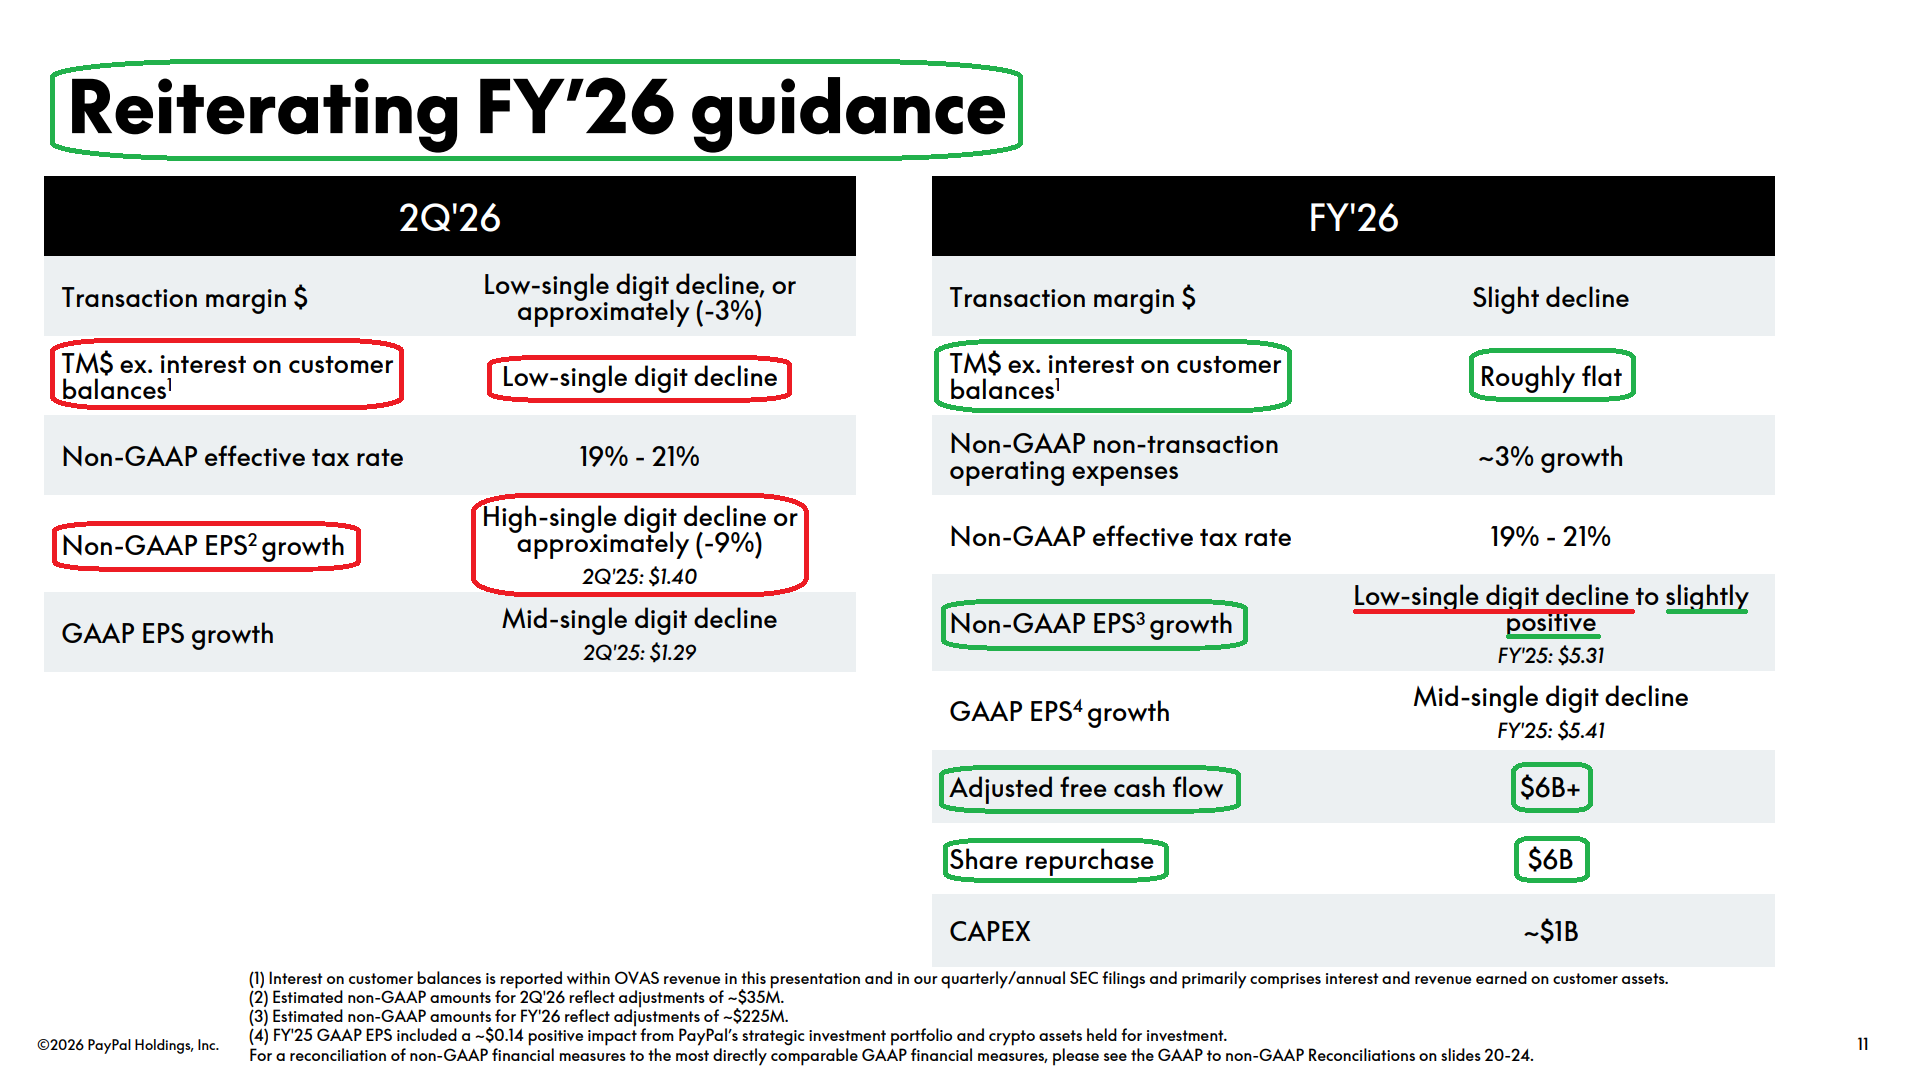
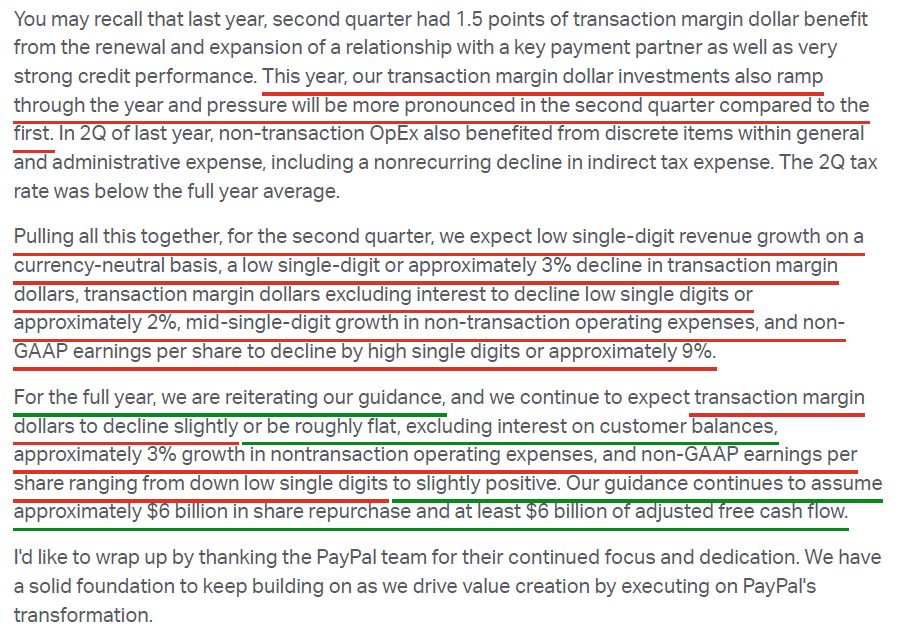
10) Management reiterated full-year 2026 guidance, calling for adjusted EPS in the low-single-digit decline to slightly positive range (vs. FY25 EPS of $5.31), with TM$ expected to slightly decline or remain roughly flat. 2Q is expected to be the toughest comp of the year, with guidance for adjusted EPS to decline high single digits (~9%, ~$1.27 vs. Street expectations of $1.34) and TM to decline ~3% (vs. Street -1%), reflecting the non-recurrence of a 1.5 pt prior-year benefit from a key payment partner renewal, ramping growth investments, and a lower prior-year tax rate.
Earnings Call Highlights
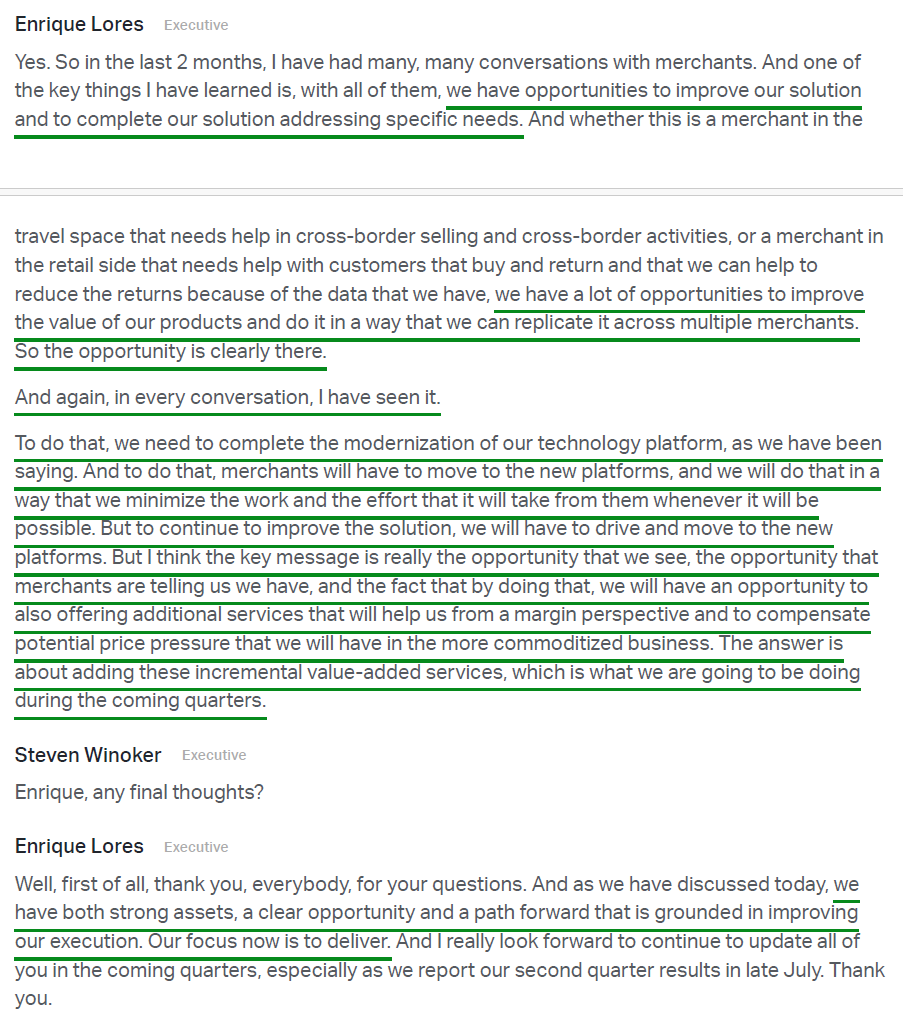
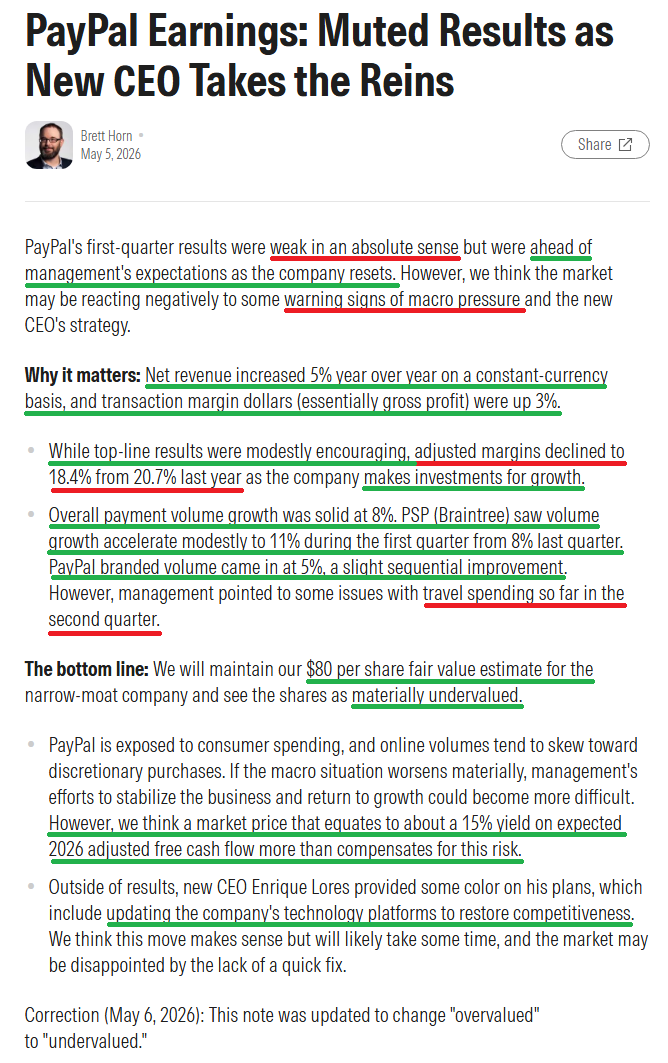
Morningstar Analyst Note
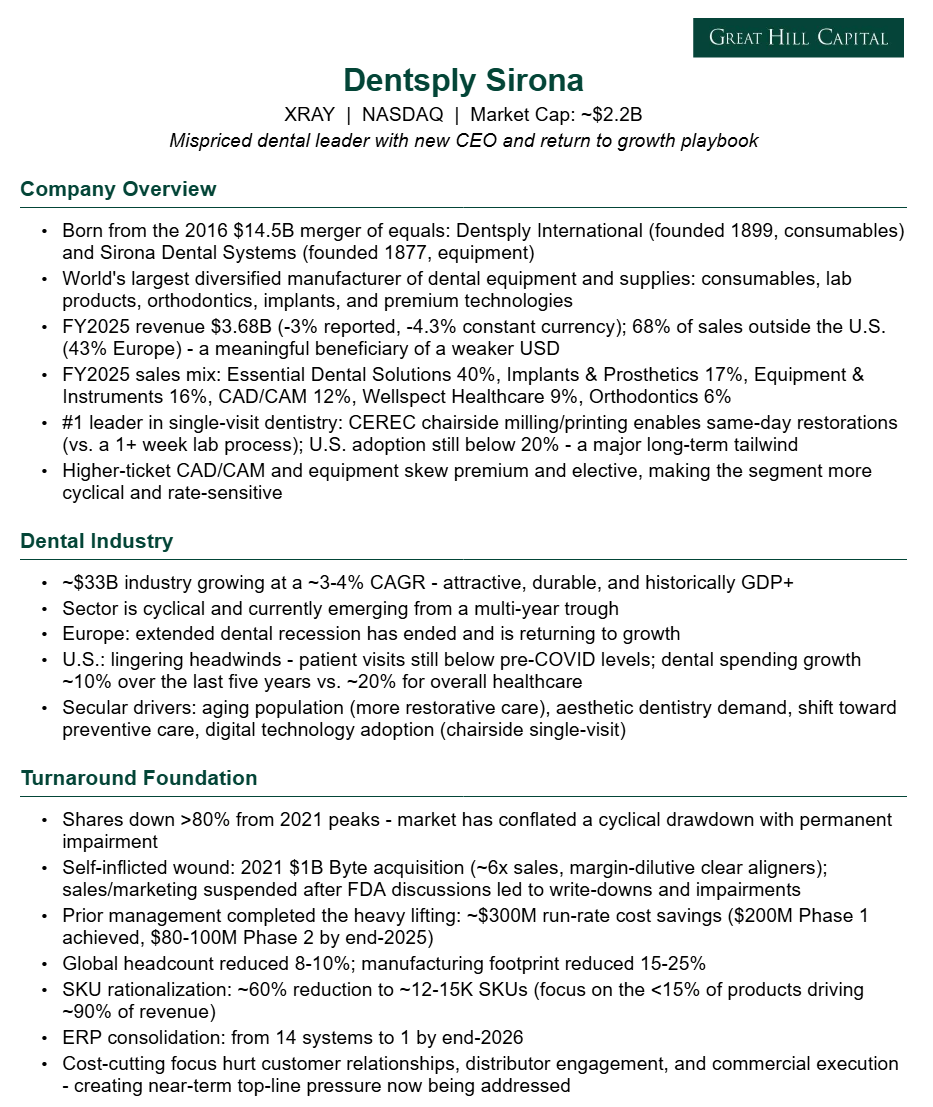
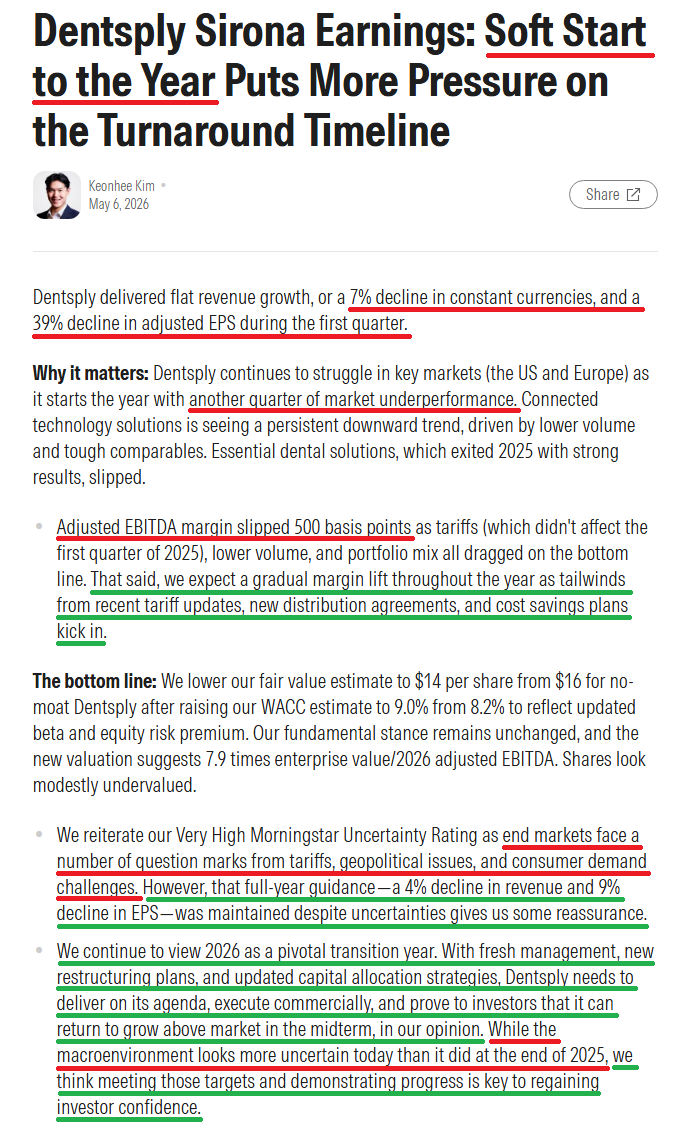
Dentsply Sirona Update
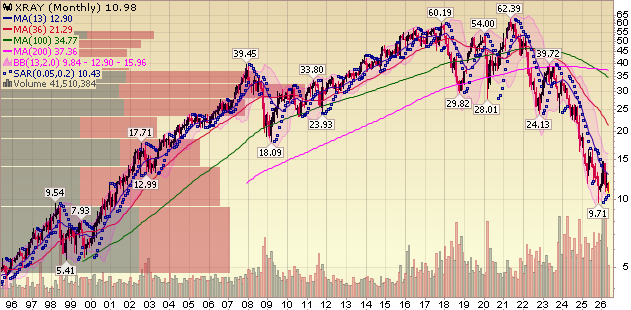
For newer readers, here’s a brief overview of the key drivers behind our Dentsply Sirona thesis, a global dental leader with a proven new CEO, a clear self-help playbook, and a cyclical inflection underway as the industry turns the corner:
Q1 Earnings Breakdown
10 Key Points
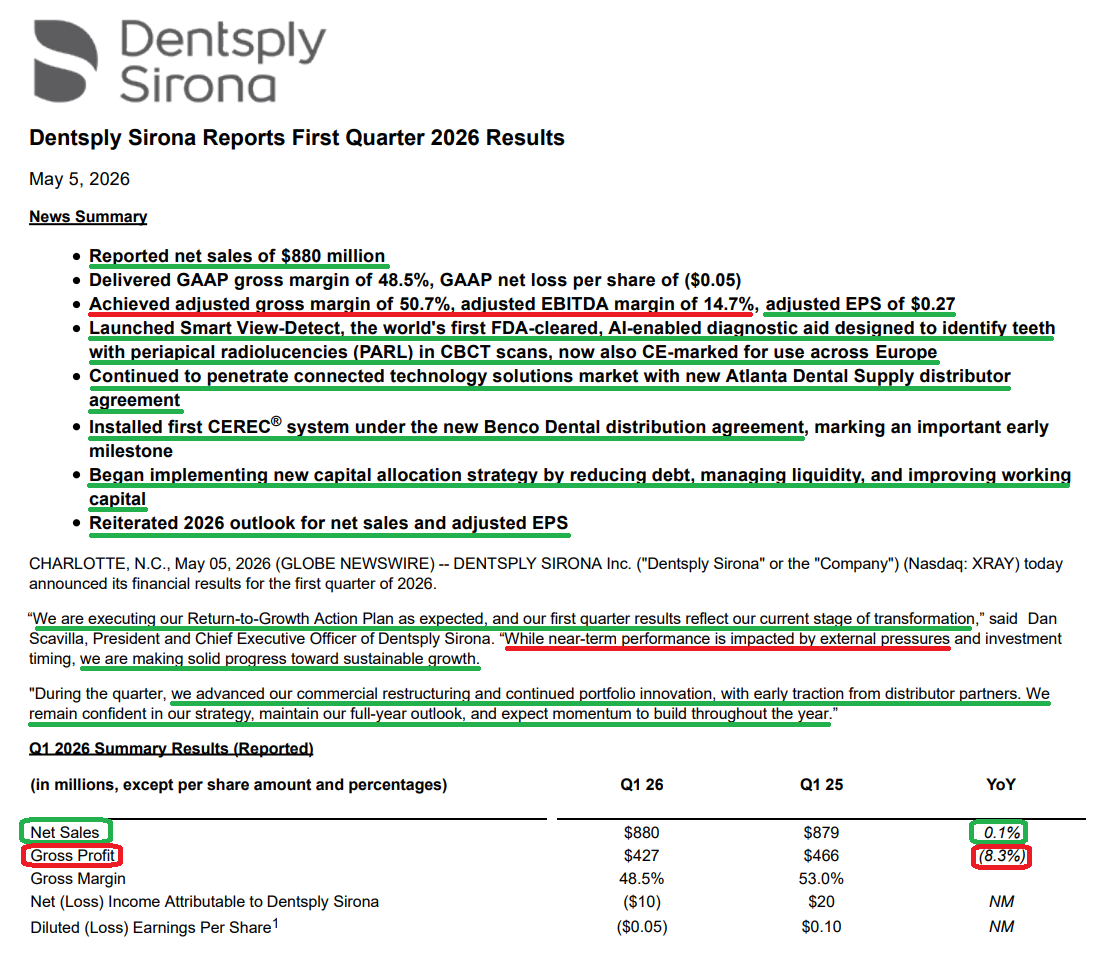
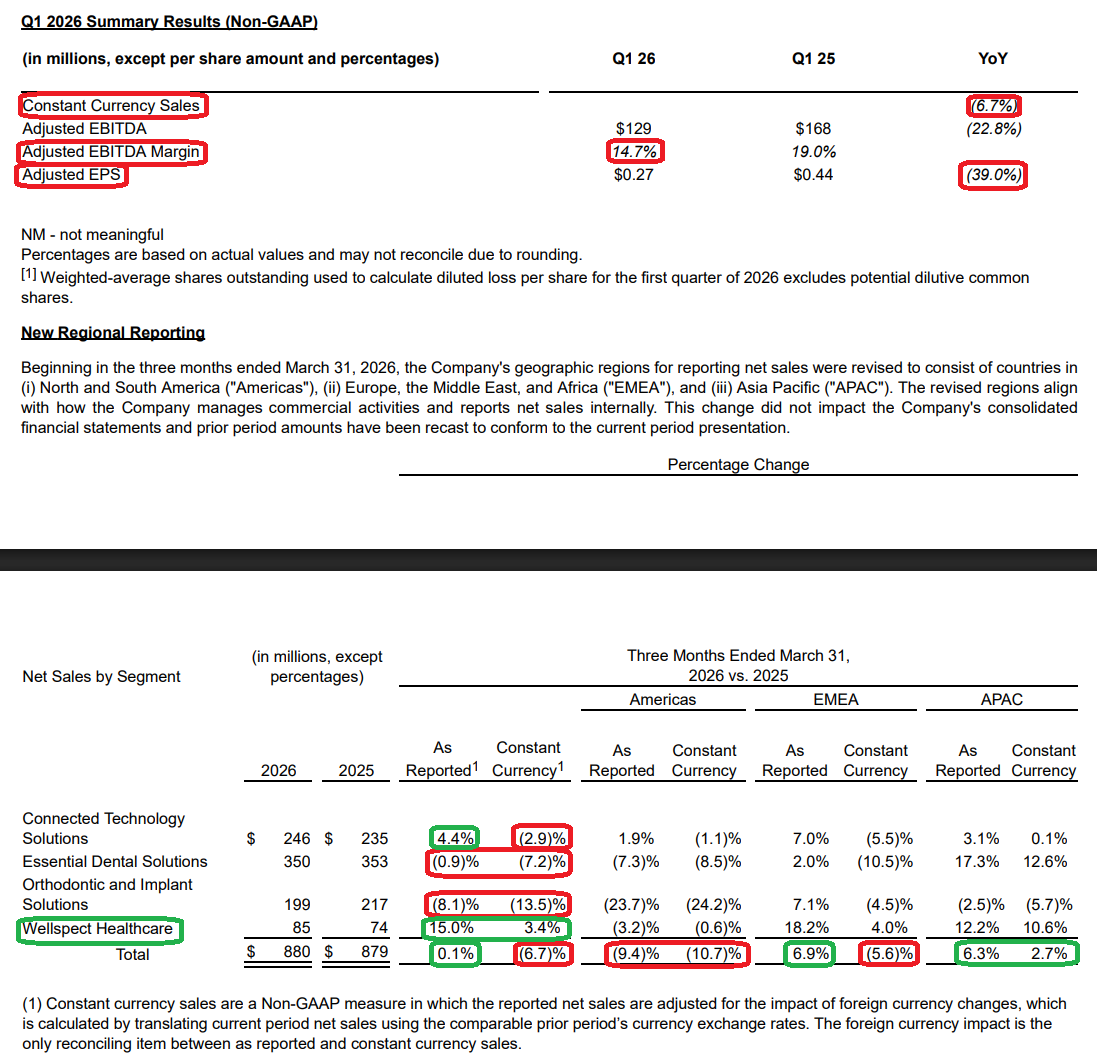
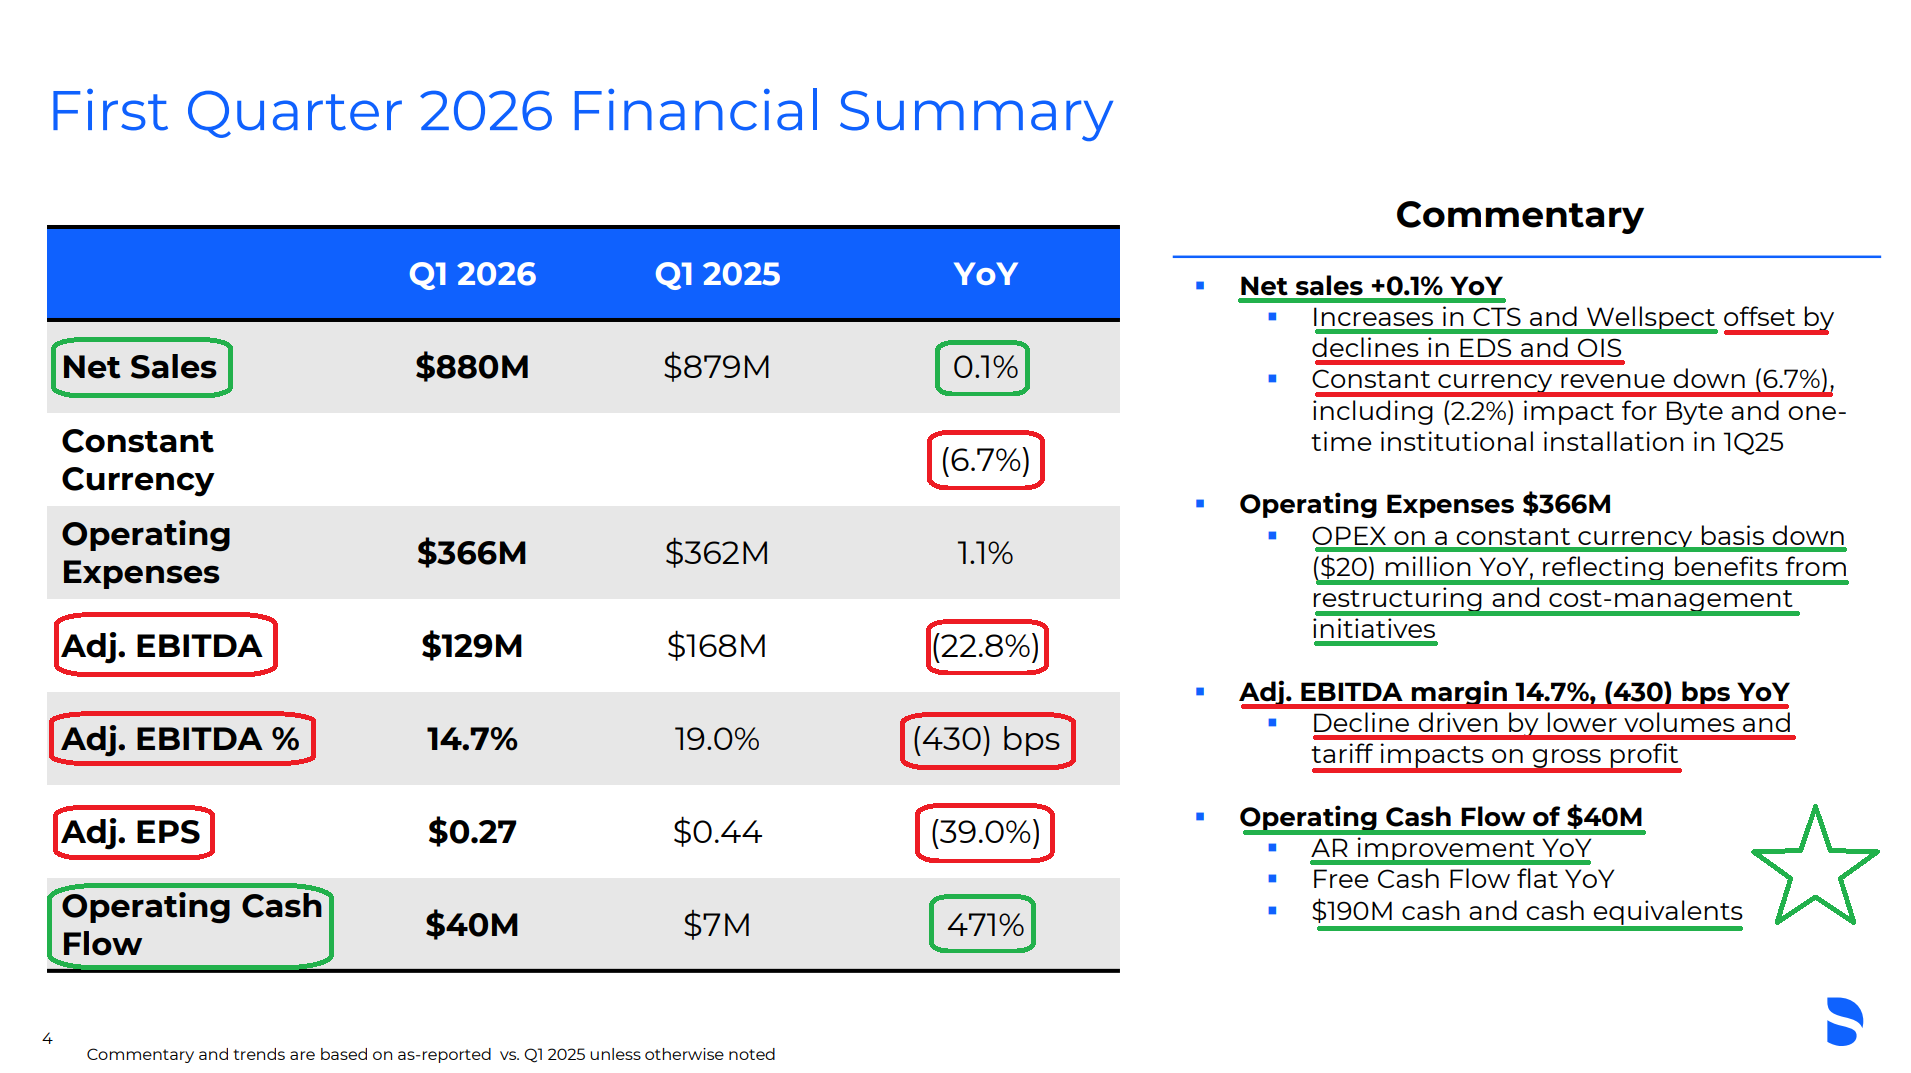
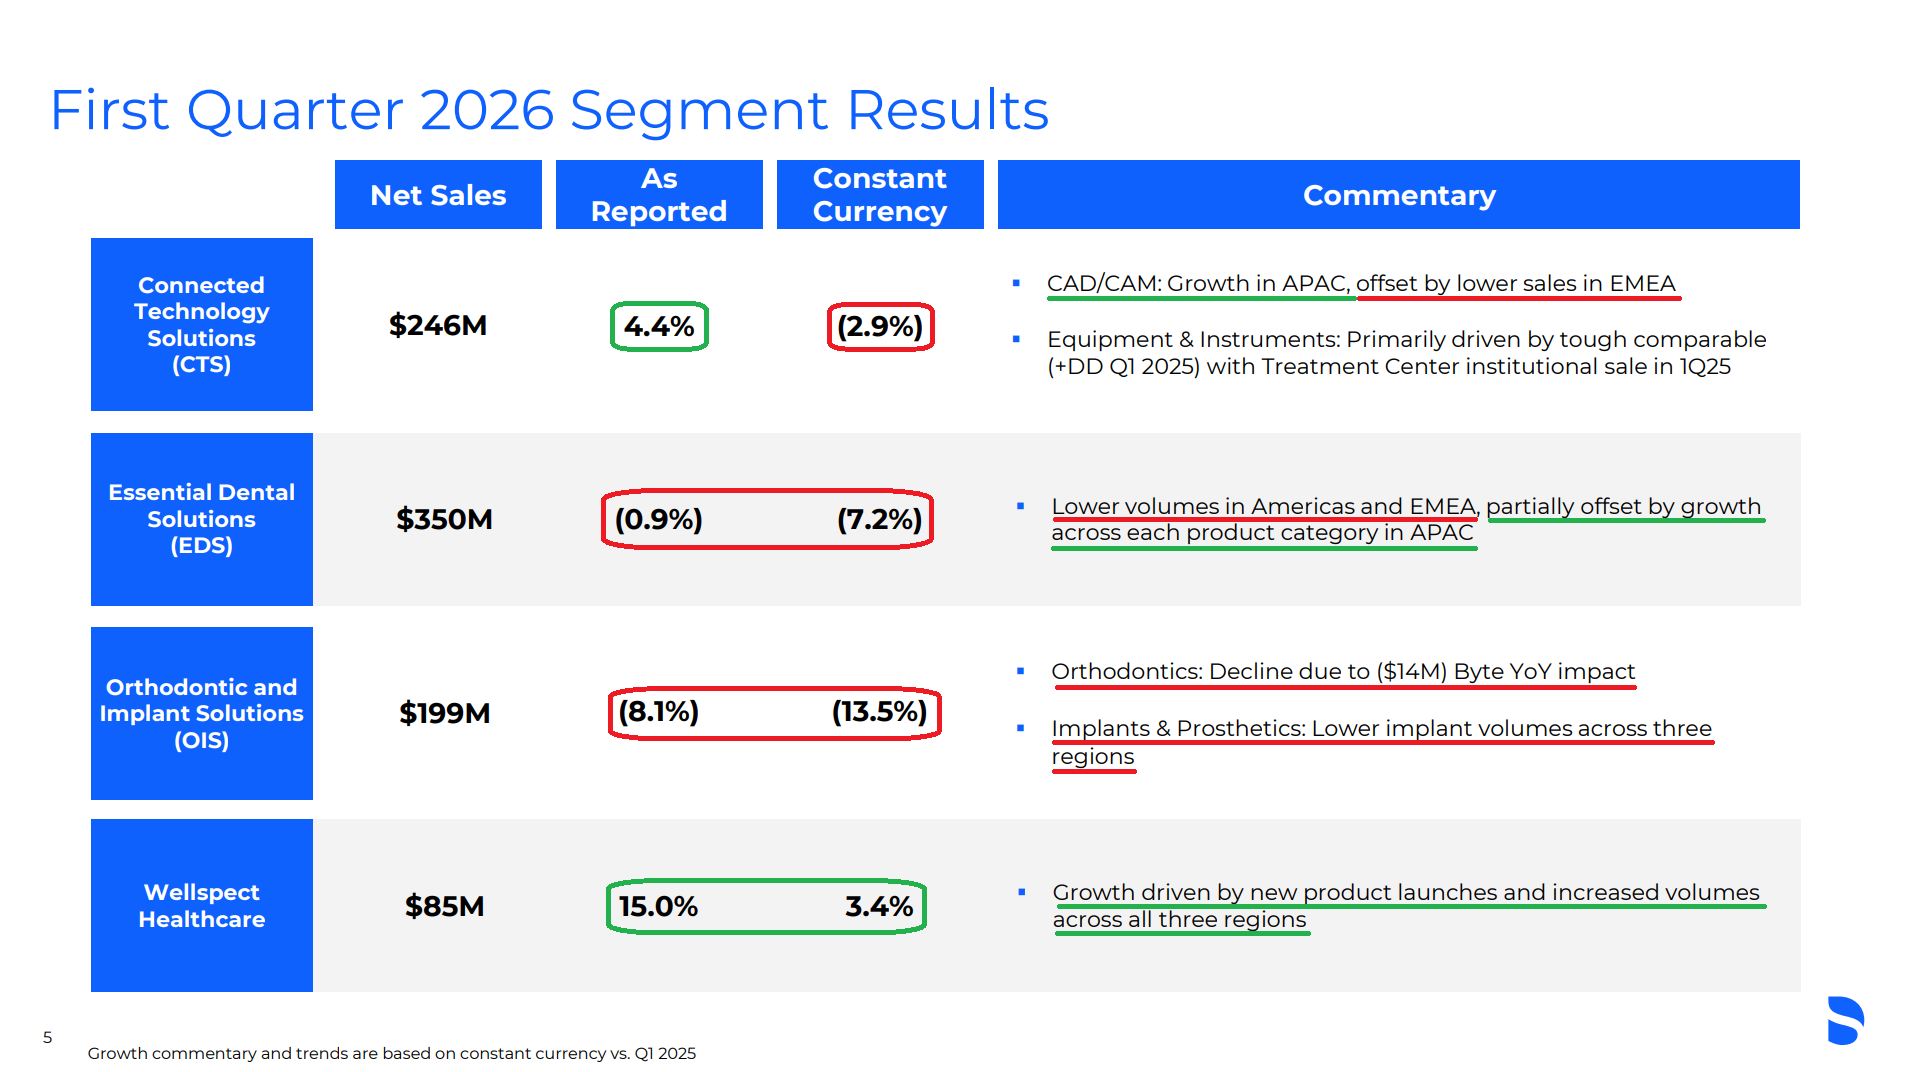
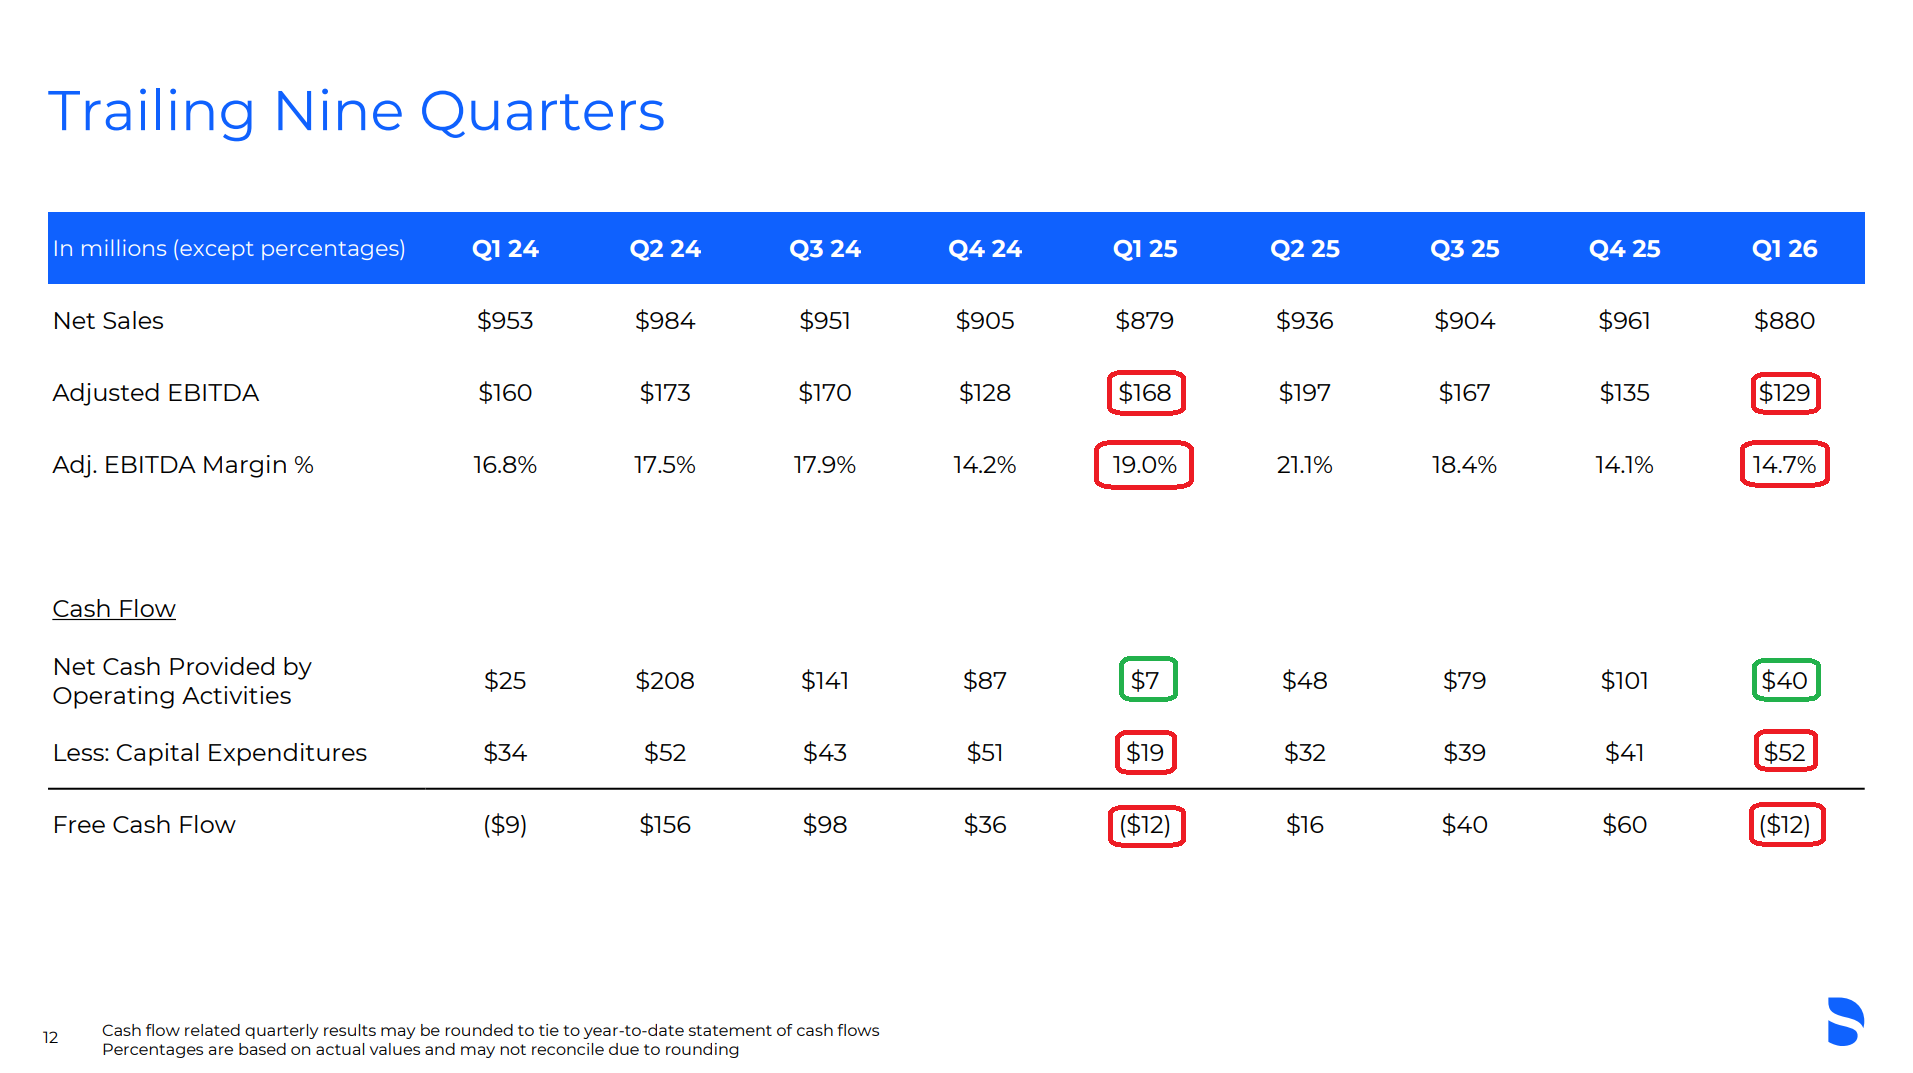
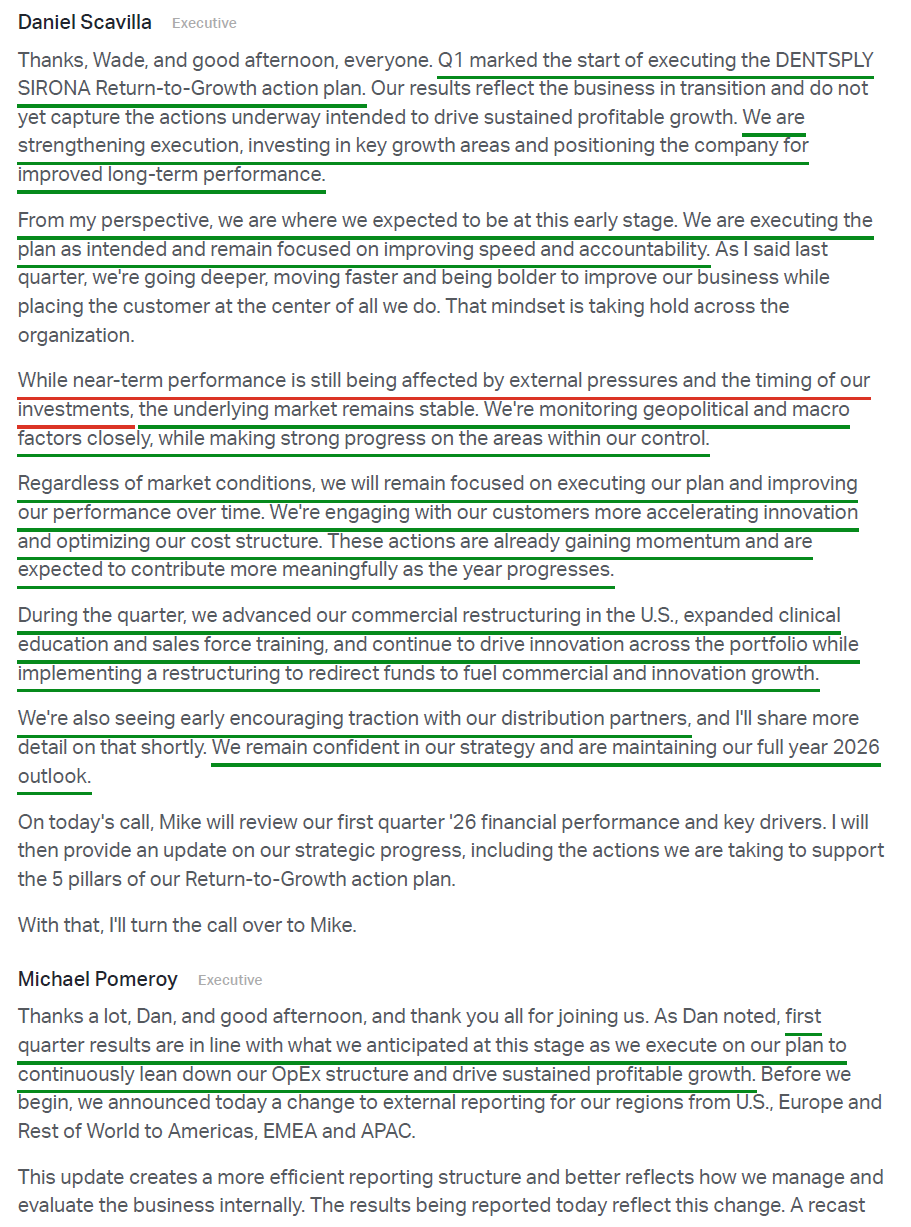
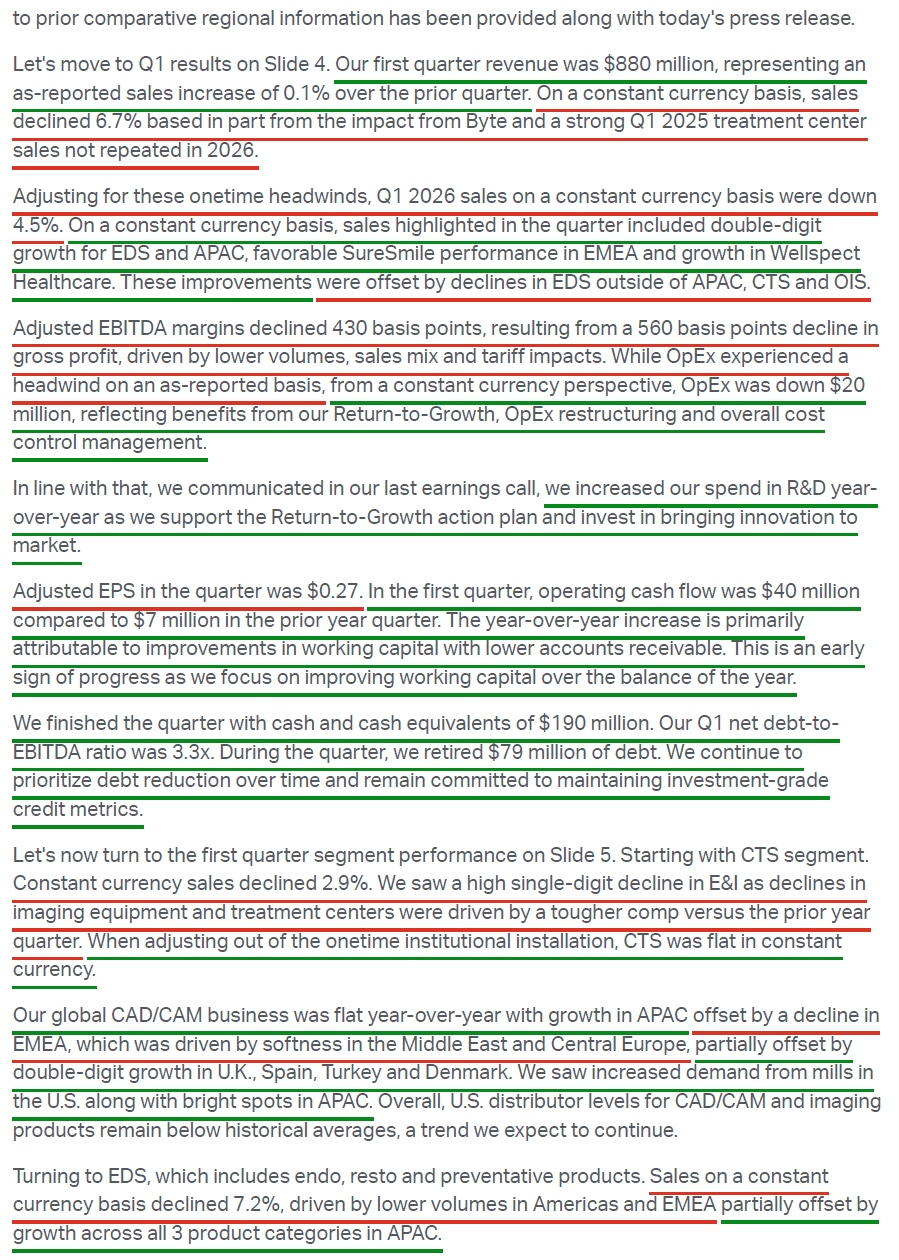
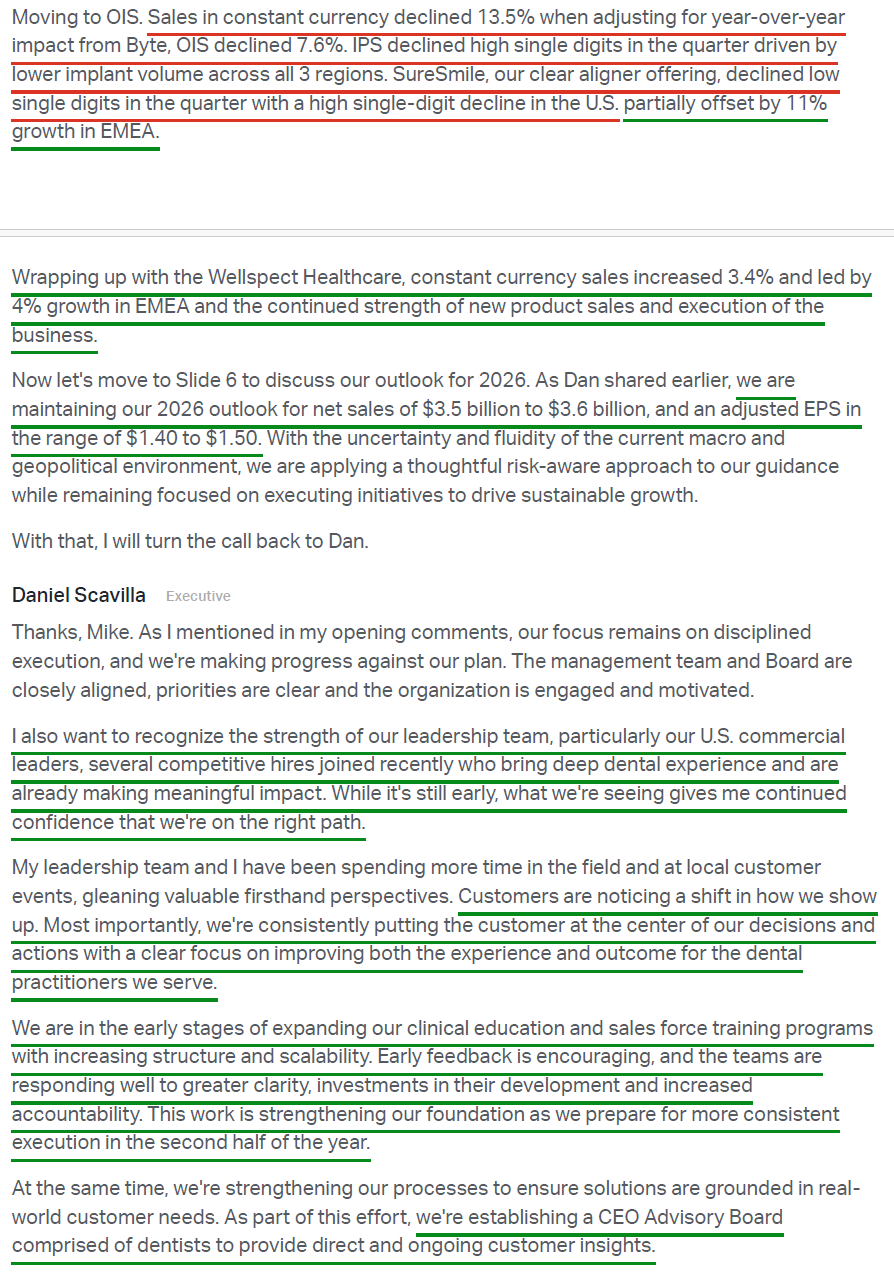
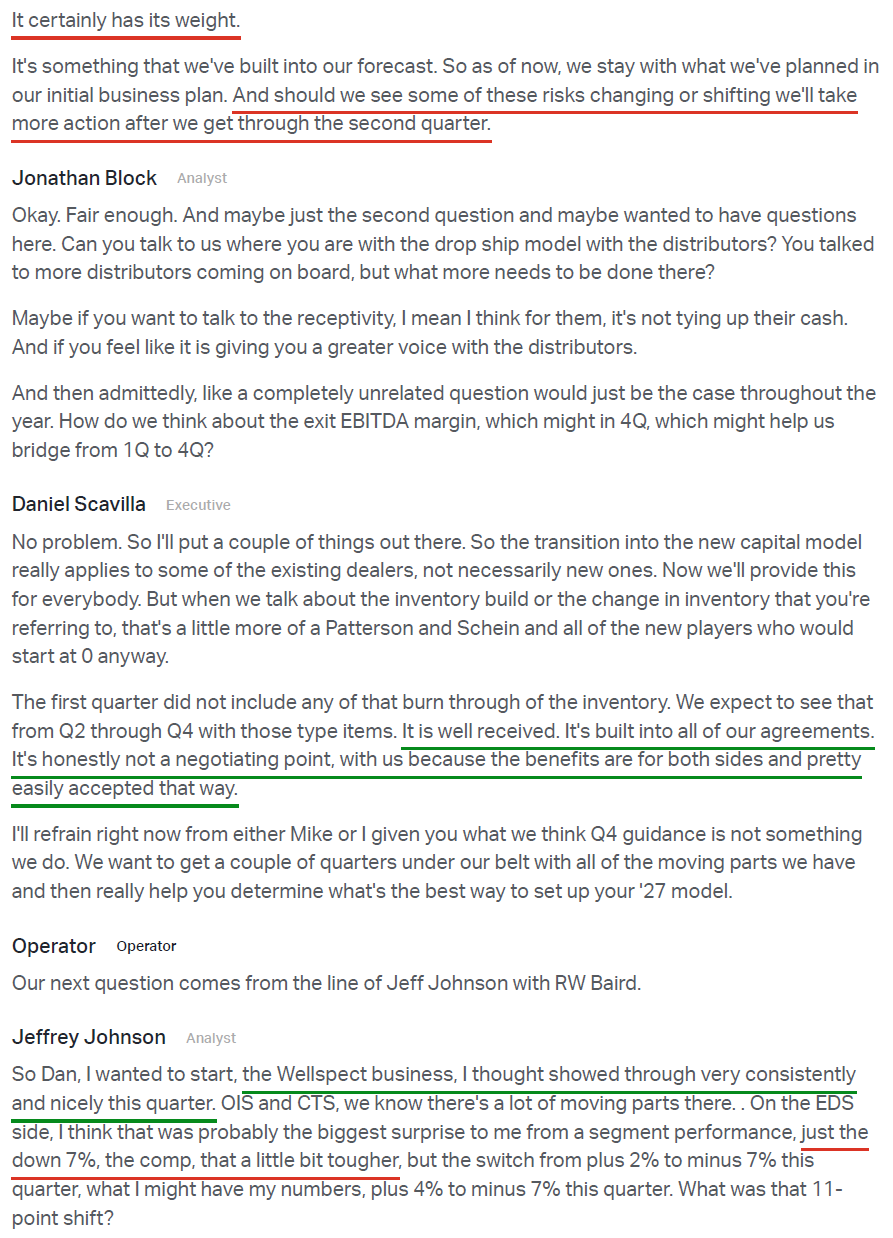
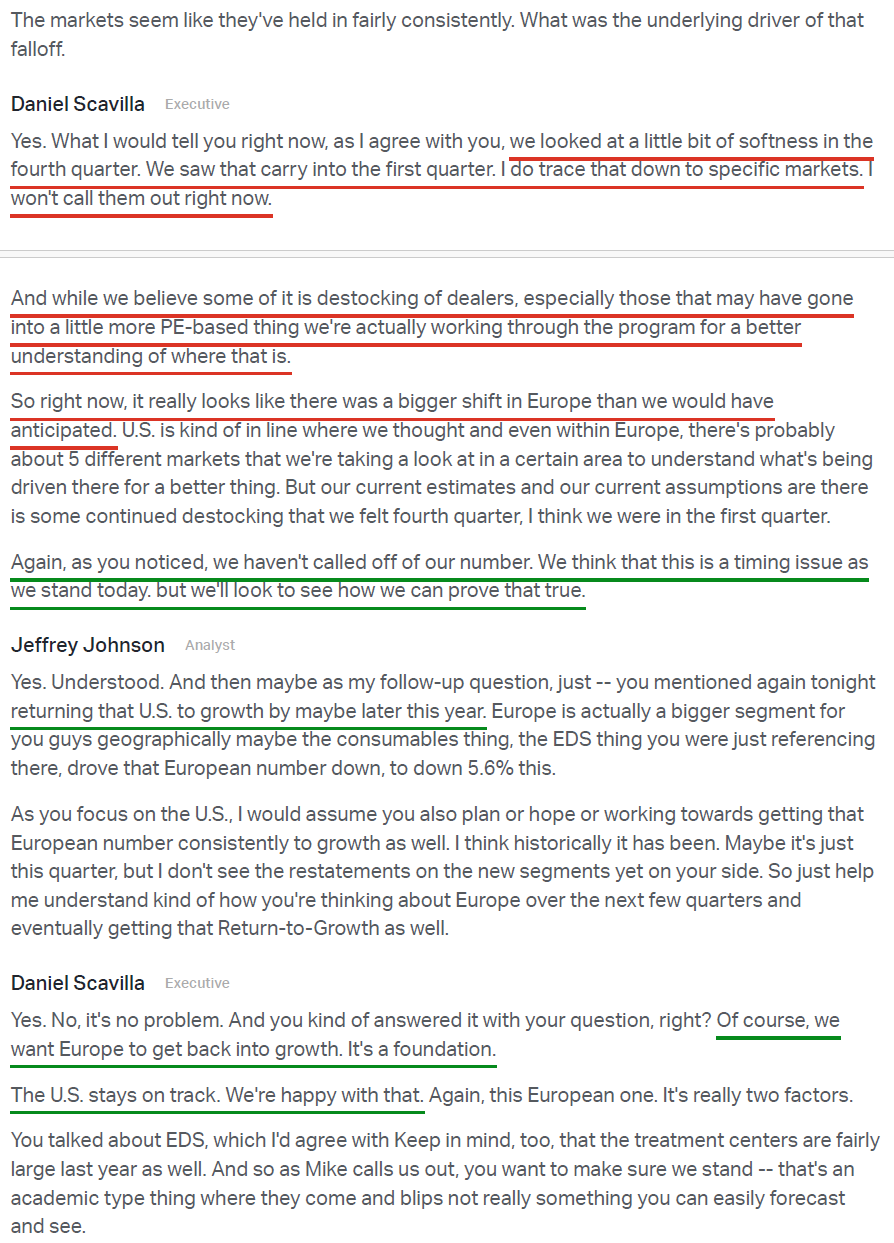
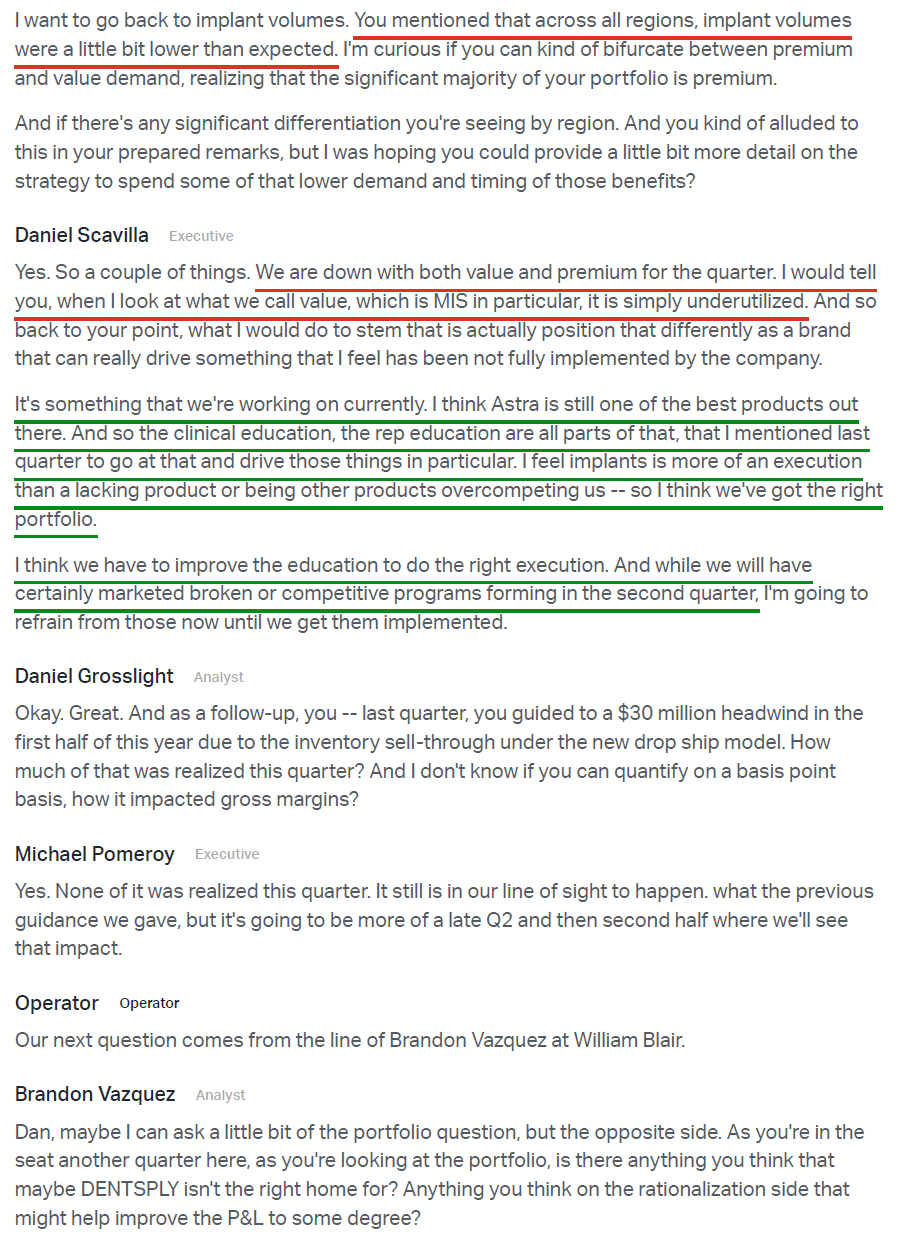
1) XRAY posted Q1 revenue of $880M (+0.1% reported, -6.7% constant currency), beating consensus of ~$842M, with constant currency sales down 4.5% after adjusting for the (2.2%) Byte headwind and a one-time institutional treatment center installation in Q1 2025 that did not repeat. At the segment level, Wellspect Healthcare led the way again (+15.0% reported, +3.4% constant currency), followed by CTS (+4.4% reported, -2.9% constant currency), while EDS (-0.9% reported, -7.2% constant currency) and OIS (-8.1% reported, -13.5% constant currency) remained the key drags. Adjusted EPS of $0.27 (-39% Y/Y) was in line with consensus.
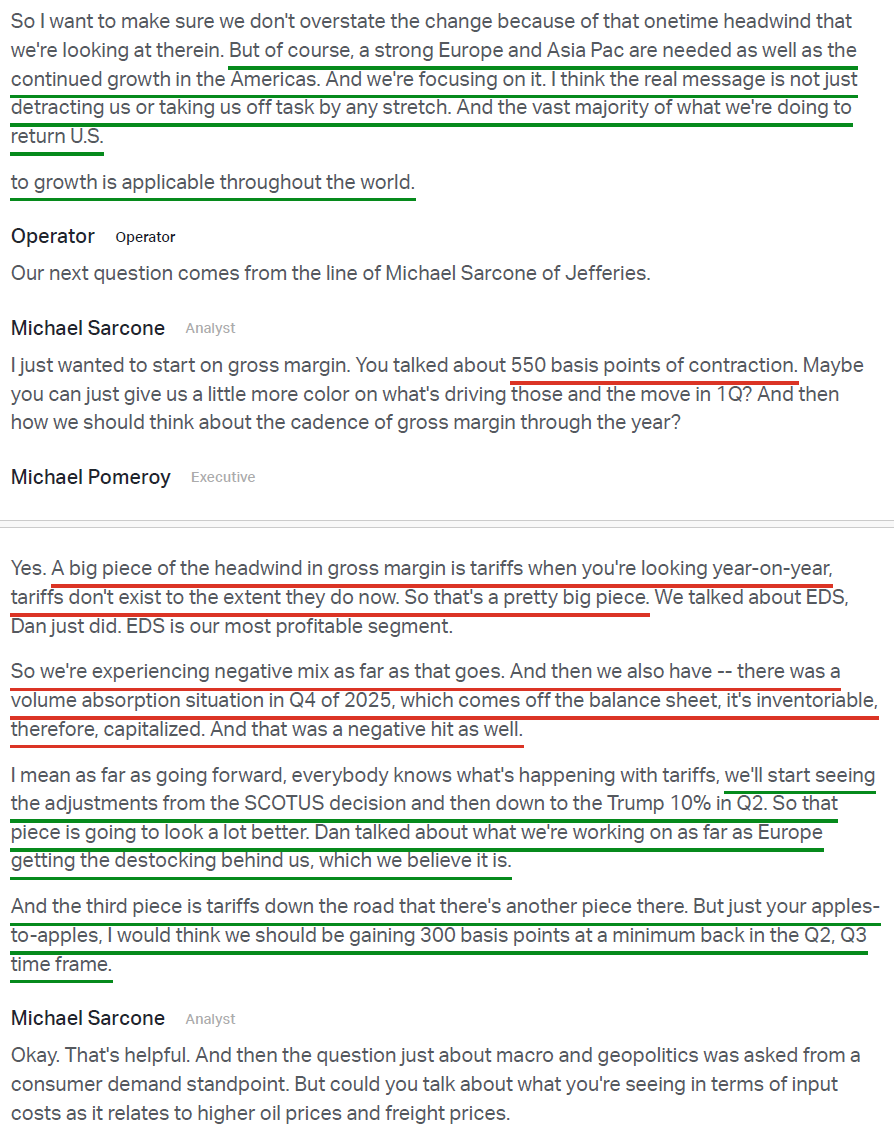
2) Adjusted gross margin came in at 50.7%, down 560 bps Y/Y from 56.3%, pressured by lower volumes, negative segment mix (lighter EDS, the highest-margin segment), tariff impacts, and higher-cost inventory absorption rolling through from Q4 2025. Management expects gross margin to recover at least ~300 bps in Q2/Q3 as tariffs normalize following the recent SCOTUS decision and as European destocking dynamics work through.
3) Adjusted EBITDA of $129M (-22.8% Y/Y from $168M) came in roughly in line with consensus of $128.6M, with adjusted EBITDA margin contracting 430 bps Y/Y to 14.7% from 19.0%, driven by lower volumes and tariff impacts on gross profit. Encouragingly, OpEx on a constant currency basis was down ~$20M Y/Y, reflecting early benefits from the Return-to-Growth program, OpEx restructuring, and overall cost control.
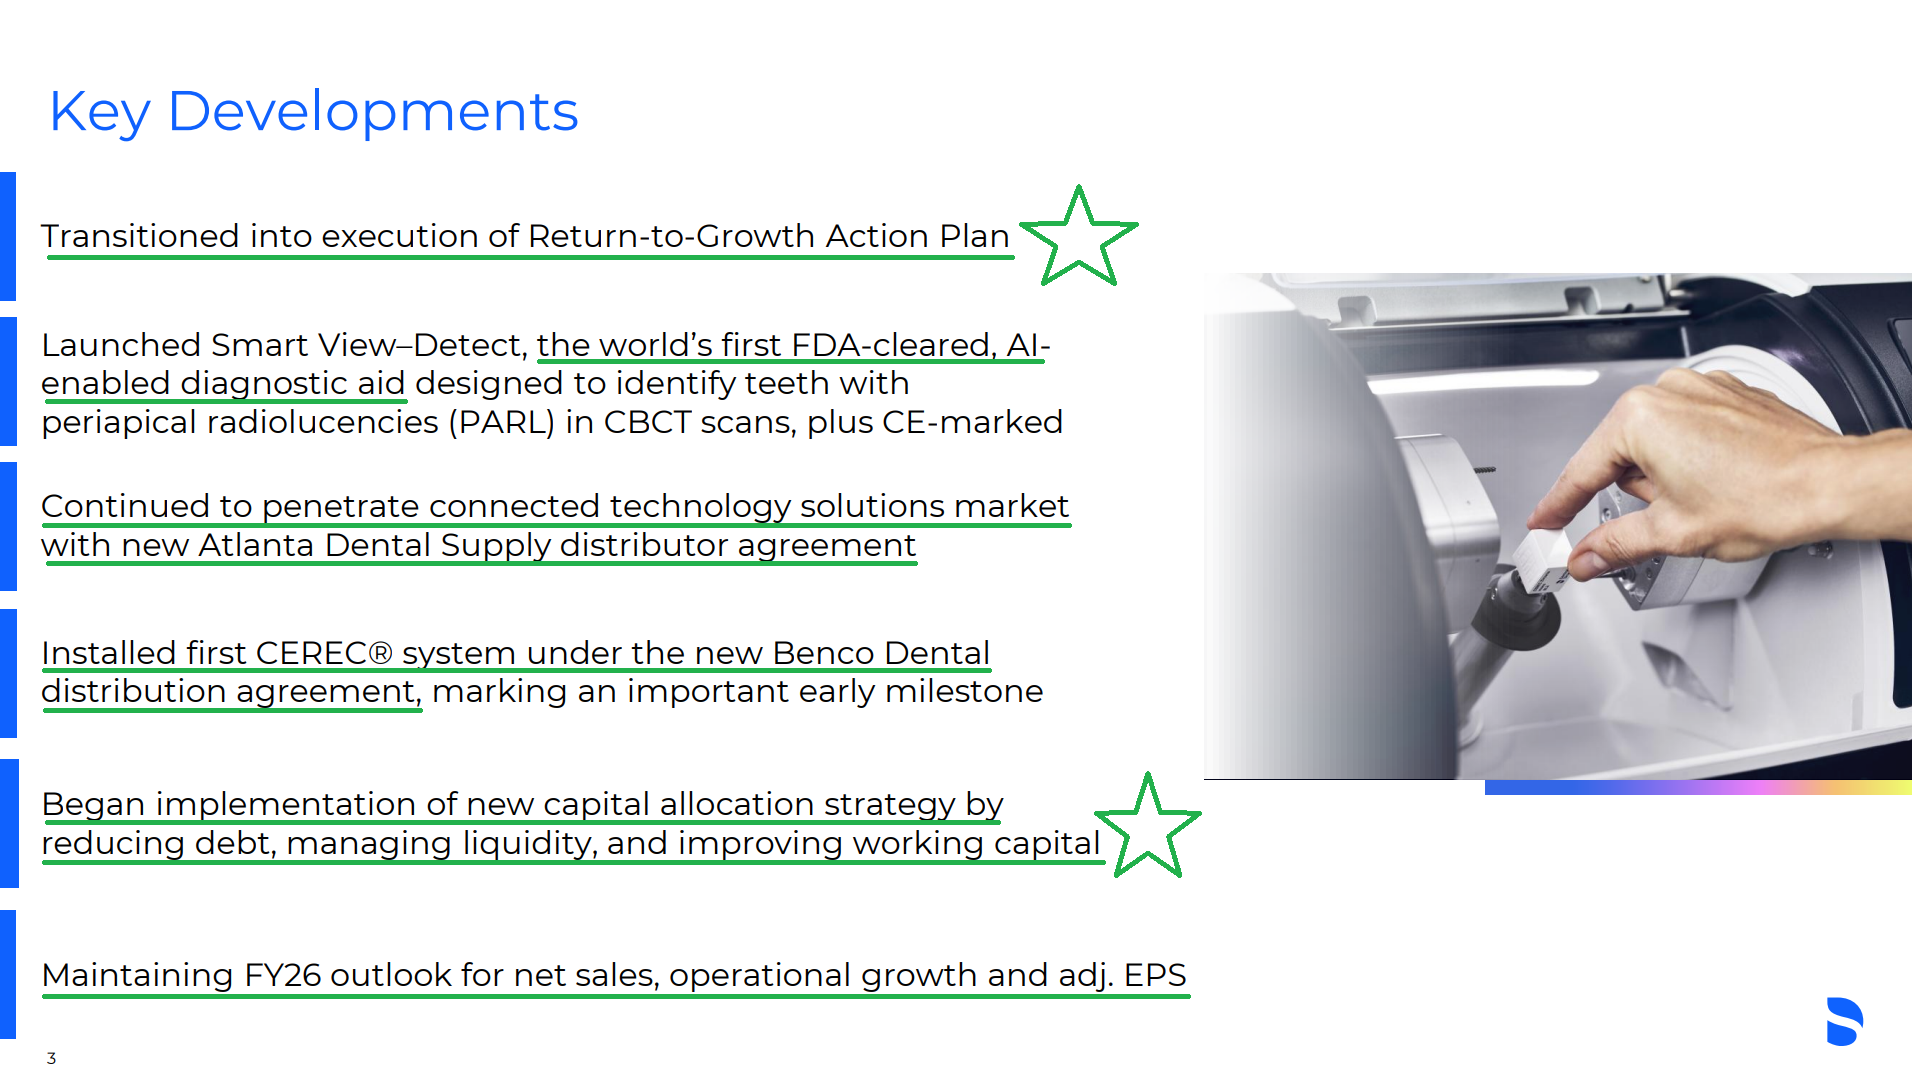
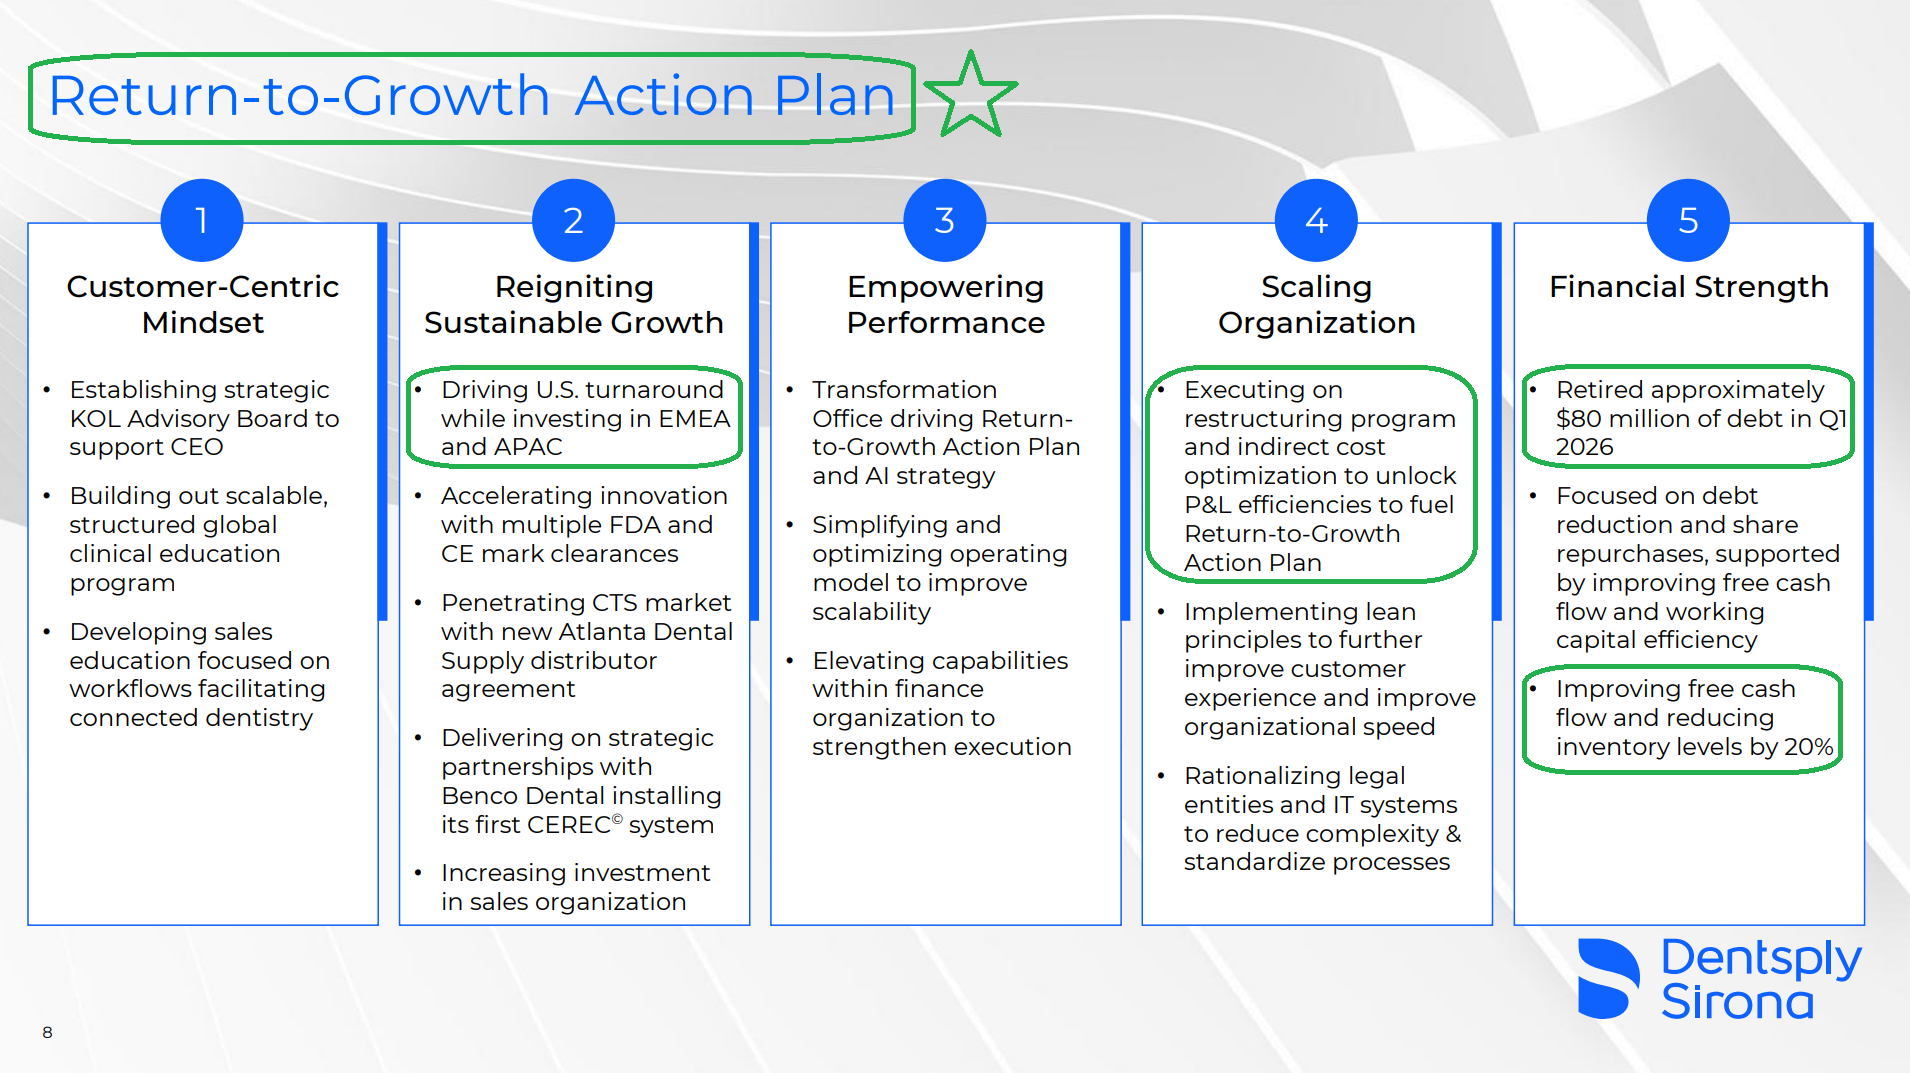
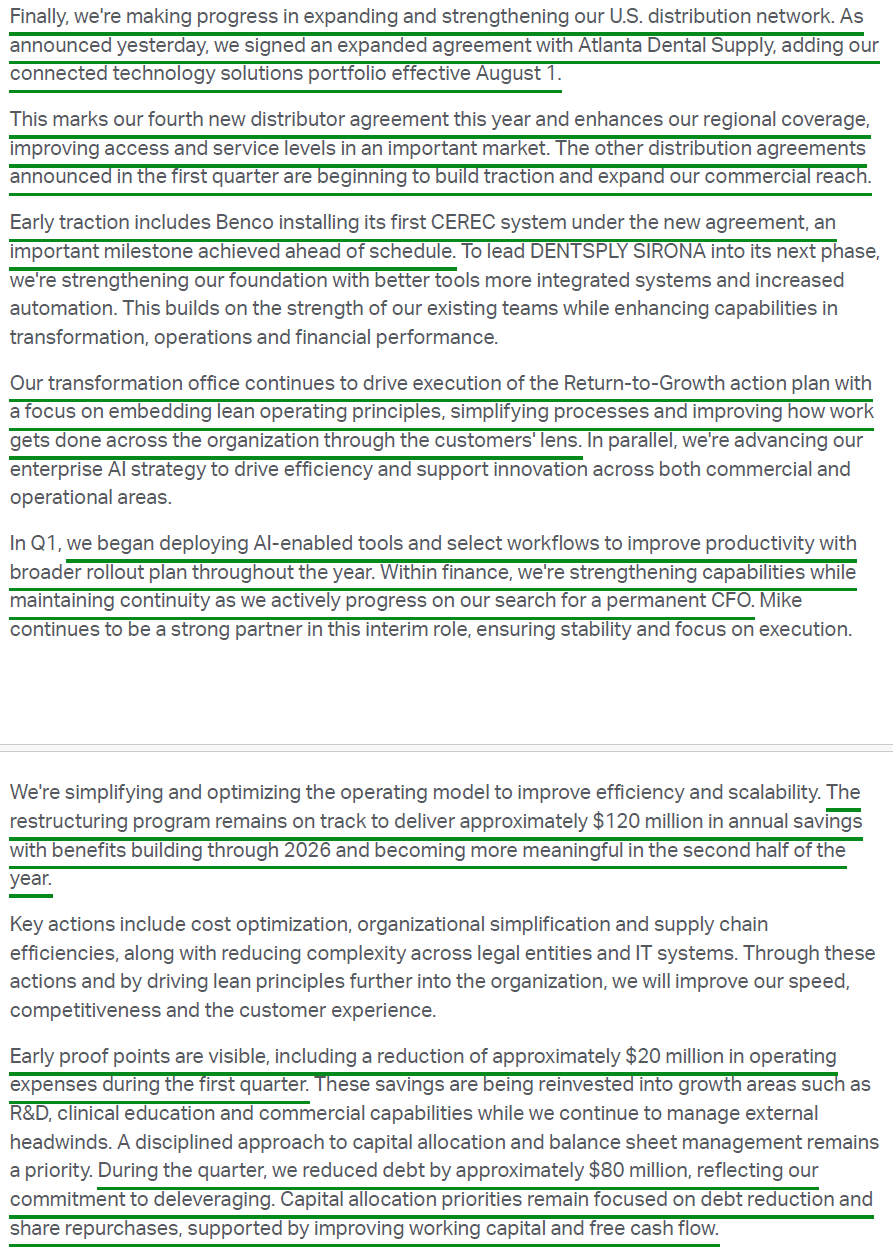
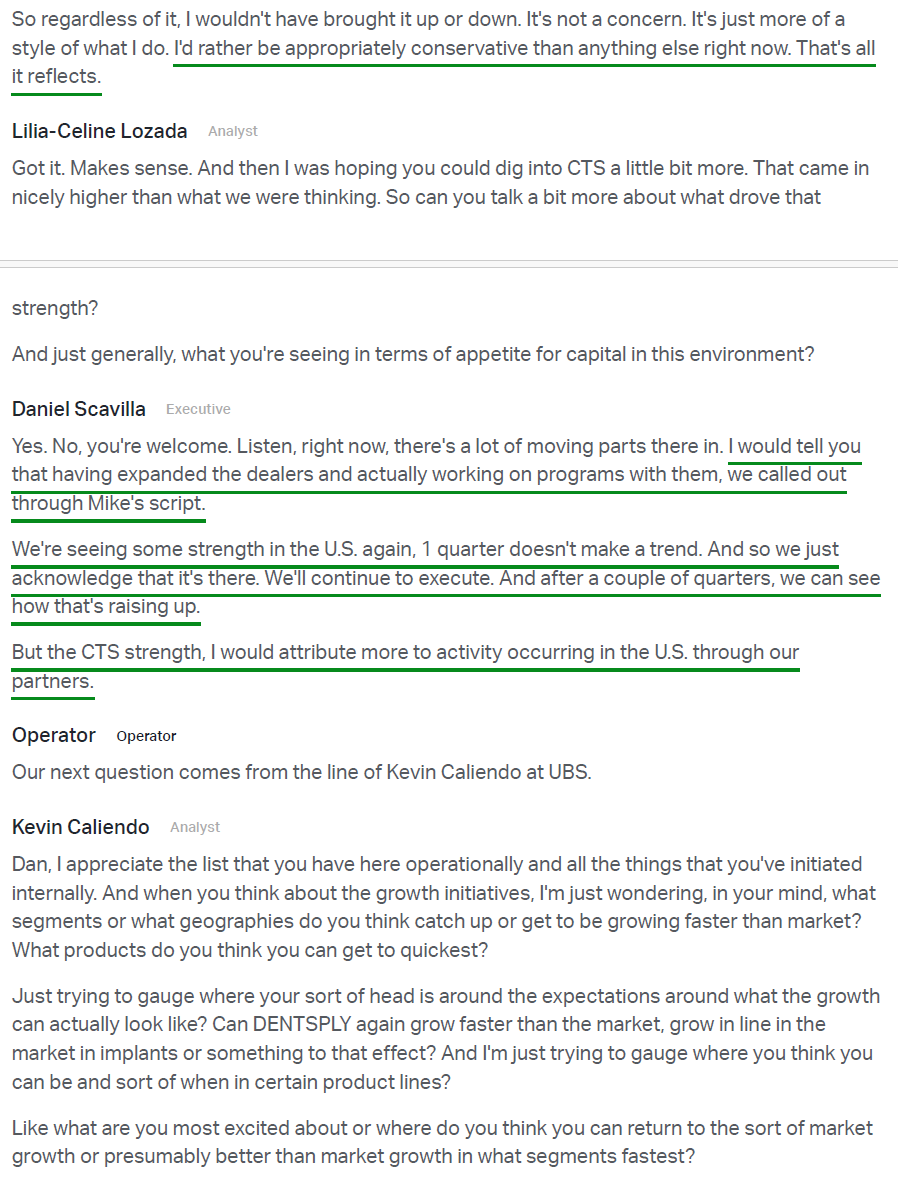
4) XRAY made further progress rebuilding its U.S. commercial footprint, signing its fourth new distributor agreement of the year with Atlanta Dental Supply (effective August 1) to expand CTS portfolio access. Benco Dental also installed its first CEREC system under the new agreement ahead of schedule, an early sign that the rebuilt dealer network is beginning to convert agreements into real product flow. Combined with prior agreements (Patterson, Burkhart, and A-dec), management views the expanded footprint as a key lever for the U.S. turnaround, with commercial improvements expected in the back half as the bulk of dealer inventory build under the new drop-ship model rolls through Q2-Q4.
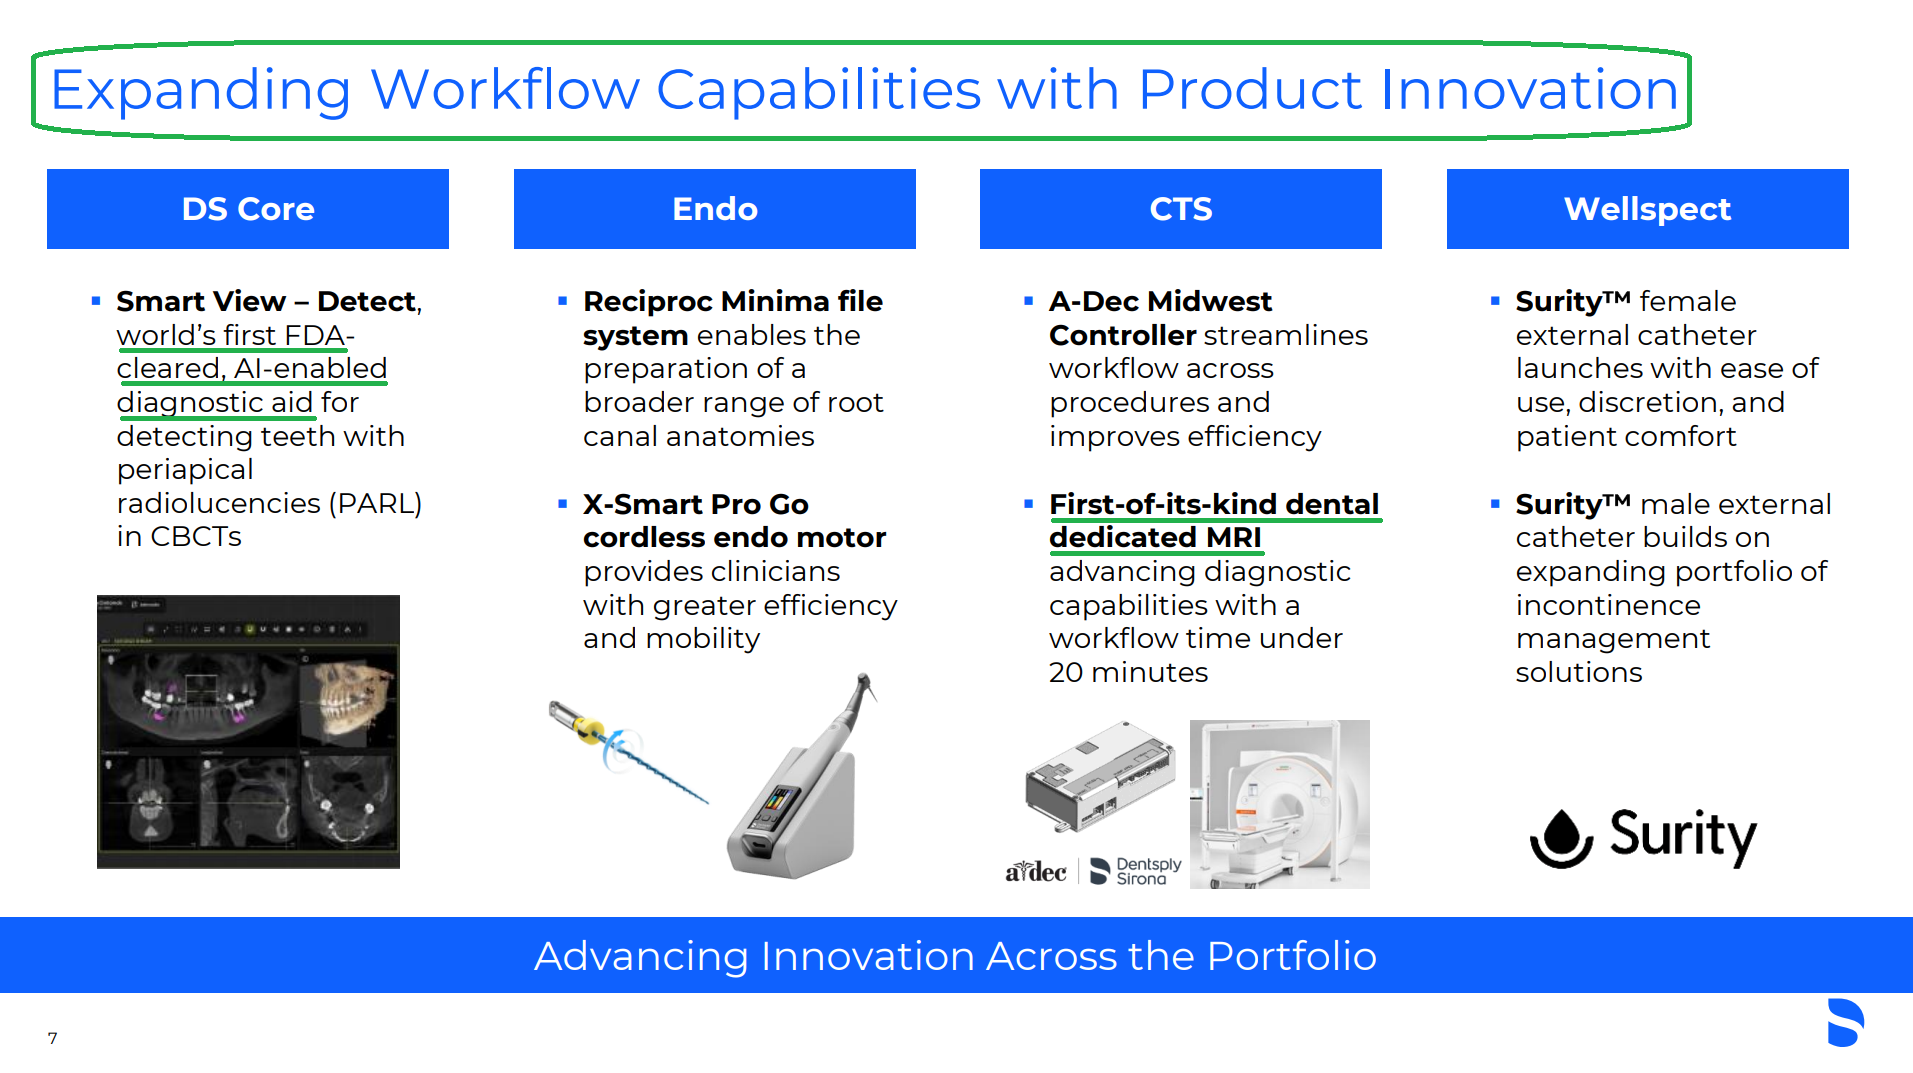
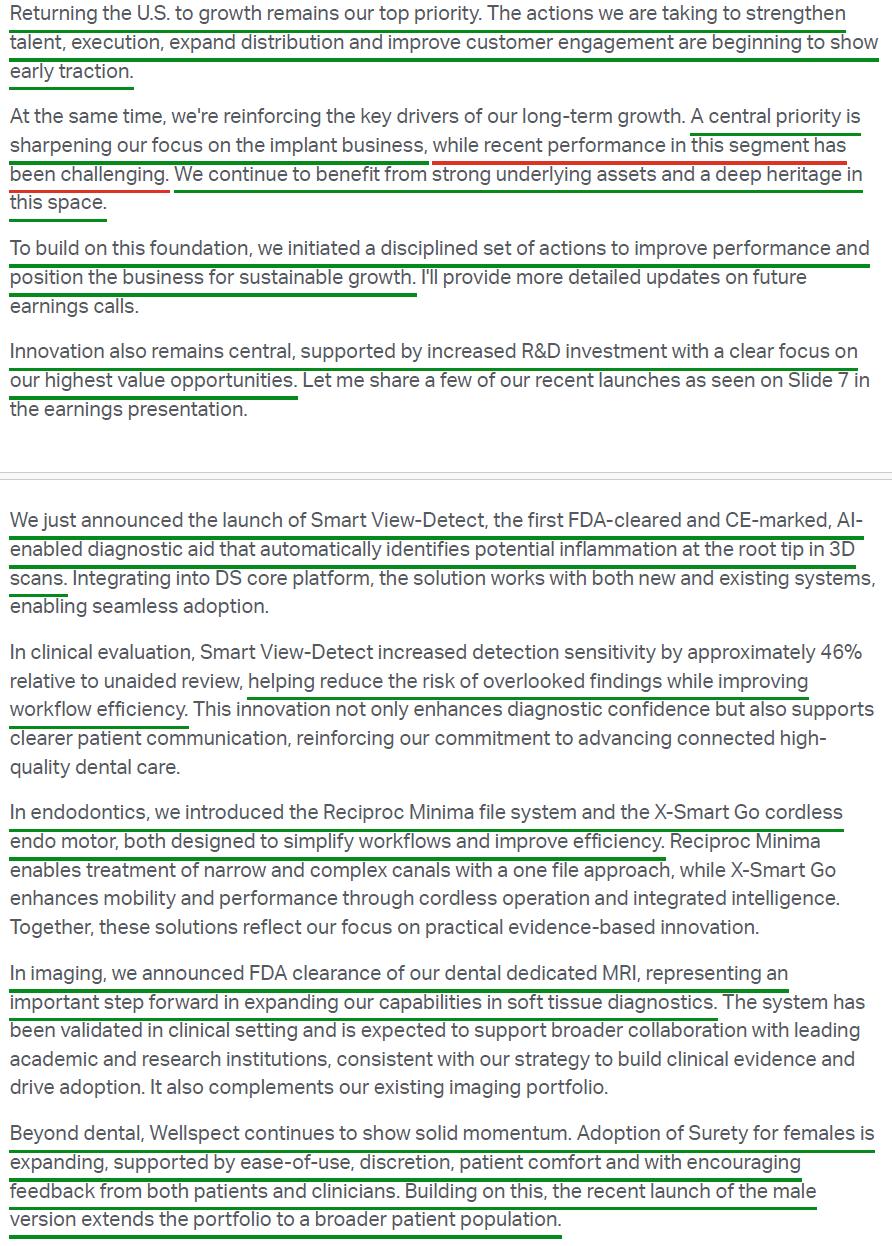
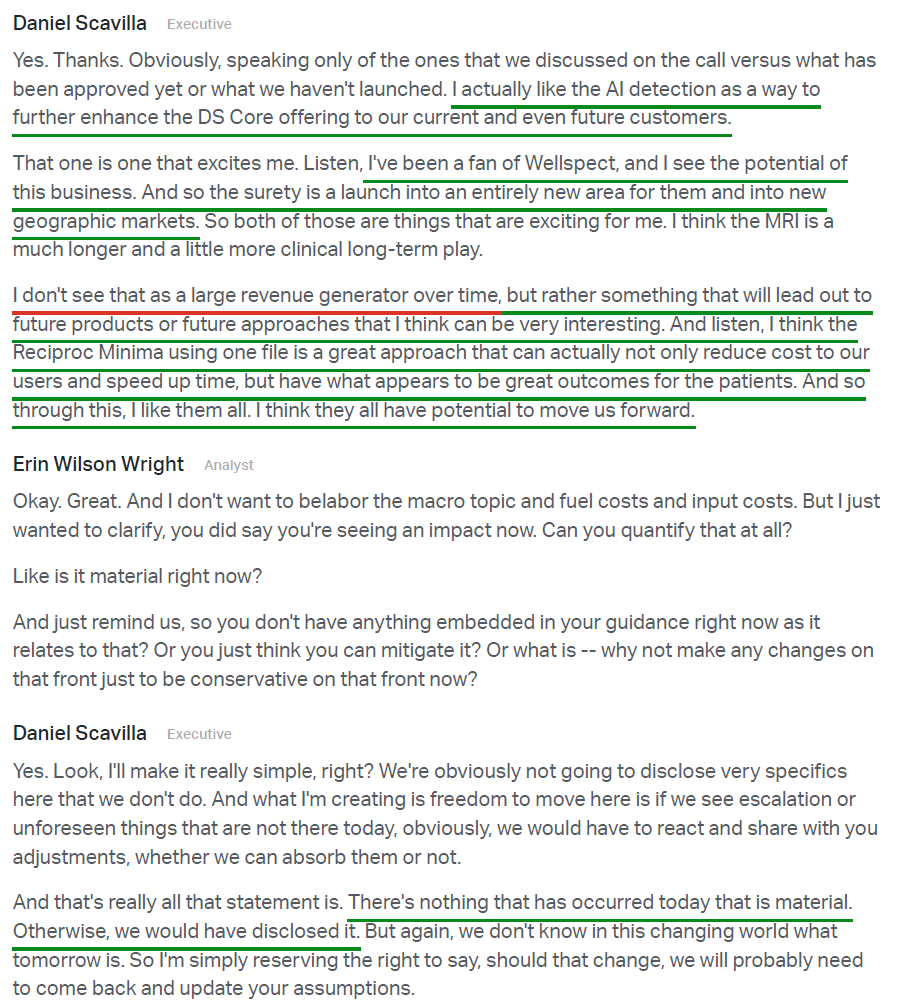
5) R&D spending stepped up to $44M in Q1 (5.0% of sales vs. 4.1% in Q1 2025) to support the Return-to-Growth plan, with multiple FDA and CE mark clearances during the quarter. The headline launch was Smart View-Detect, the world’s first FDA-cleared and CE-marked AI-enabled diagnostic aid. Other notable launches included the Reciproc Minima file system and X-Smart Go cordless endo motor in endodontics, FDA clearance of a first-of-its-kind dental-dedicated MRI, and Wellspect’s Surity male and female external catheters. While management did not offer specific product contribution details, they indicated that meaningful new product contribution will ramp into 2027 and continue into 2028.
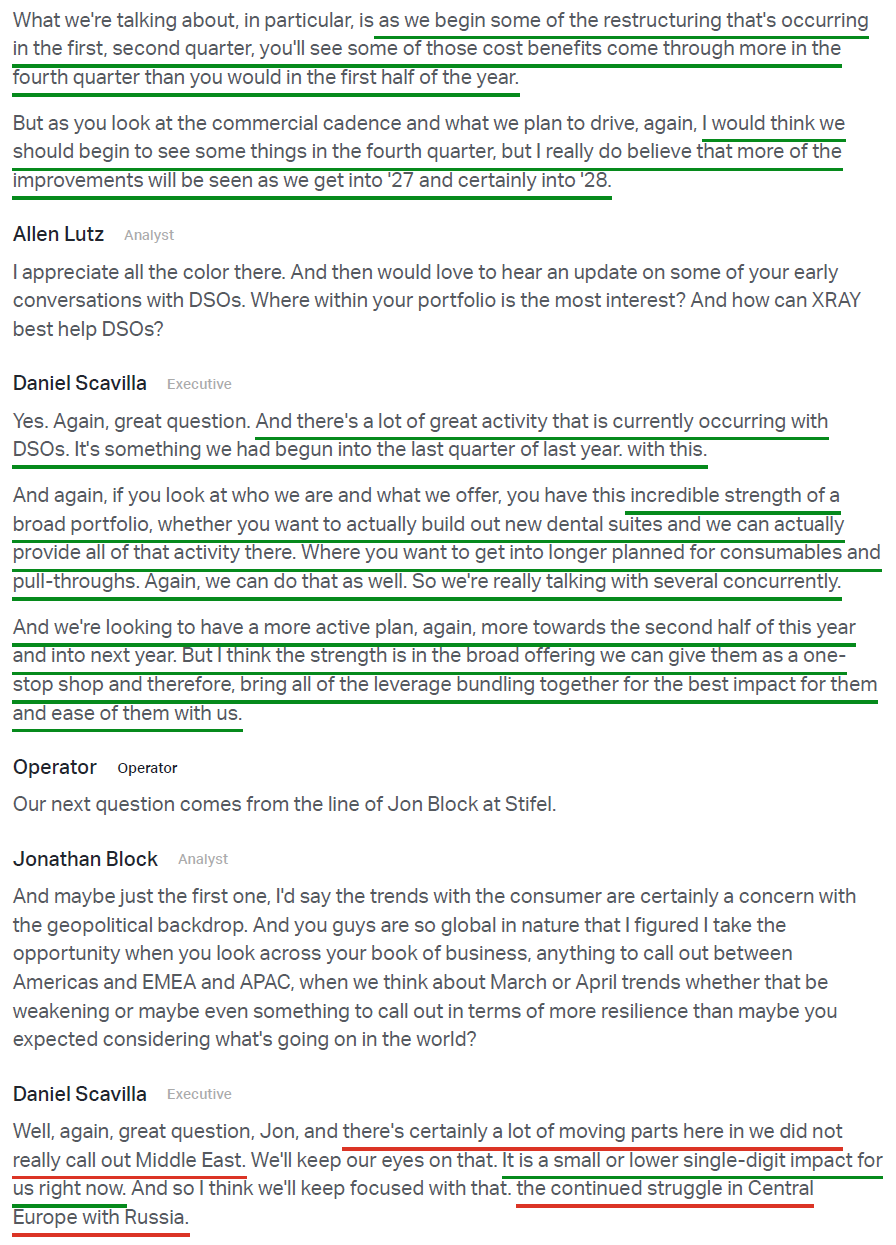
6) The restructuring program remains on track to deliver ~$120M in annual savings, with benefits building through 2026 and weighted toward the back half. Key levers include unlocking P&L efficiencies through indirect cost optimization, implementing lean principles across the organization, simplifying the operating model, and rationalizing legal entities and IT systems to reduce complexity. Early results are encouraging, with constant currency OpEx down ~$20M Y/Y in Q1. Savings are being reinvested into growth areas such as R&D, clinical education, and commercial capabilities, keeping the program self-funding as the U.S. turnaround takes shape.
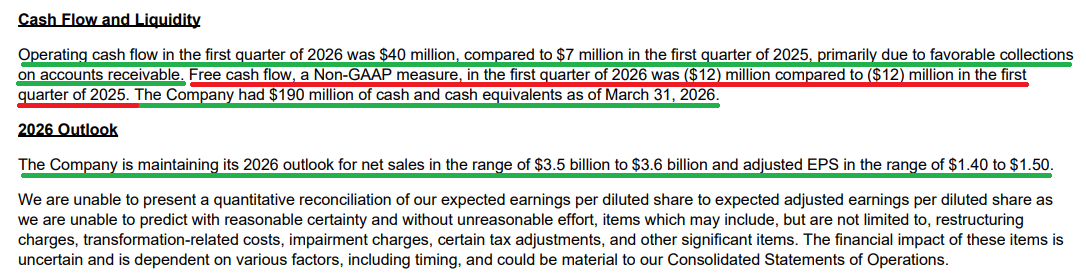
7) Operating cash flow improved meaningfully to $40M in Q1 versus $7M in the prior-year period, driven by favorable accounts receivable collections. Free cash flow was a use of ($12M), flat Y/Y, weighed down by stepped-up capital expenditures of $52M versus $19M last year. Improving FCF remains a top priority for management, with working capital improvement and a ~20% inventory reduction serving as the main levers over the balance of the year.
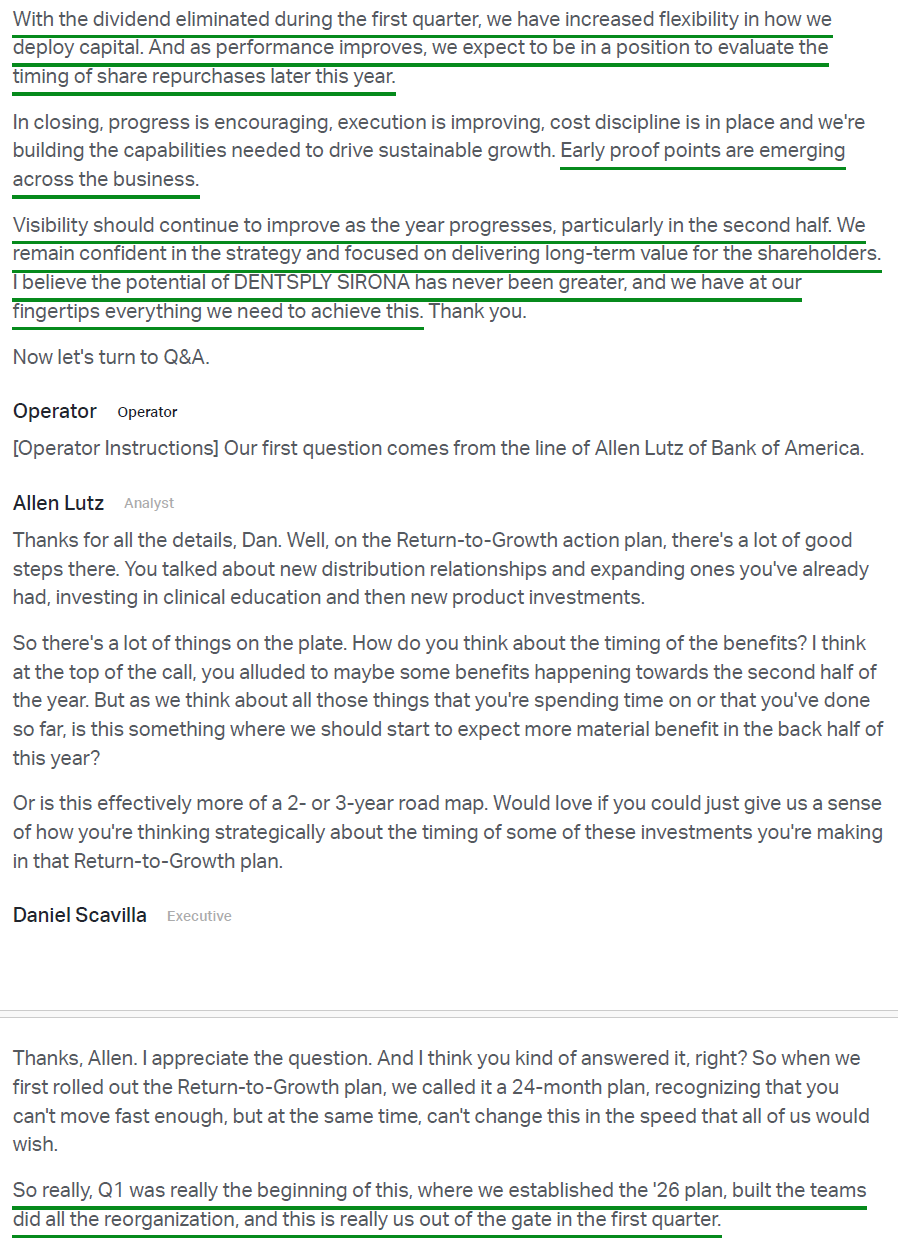
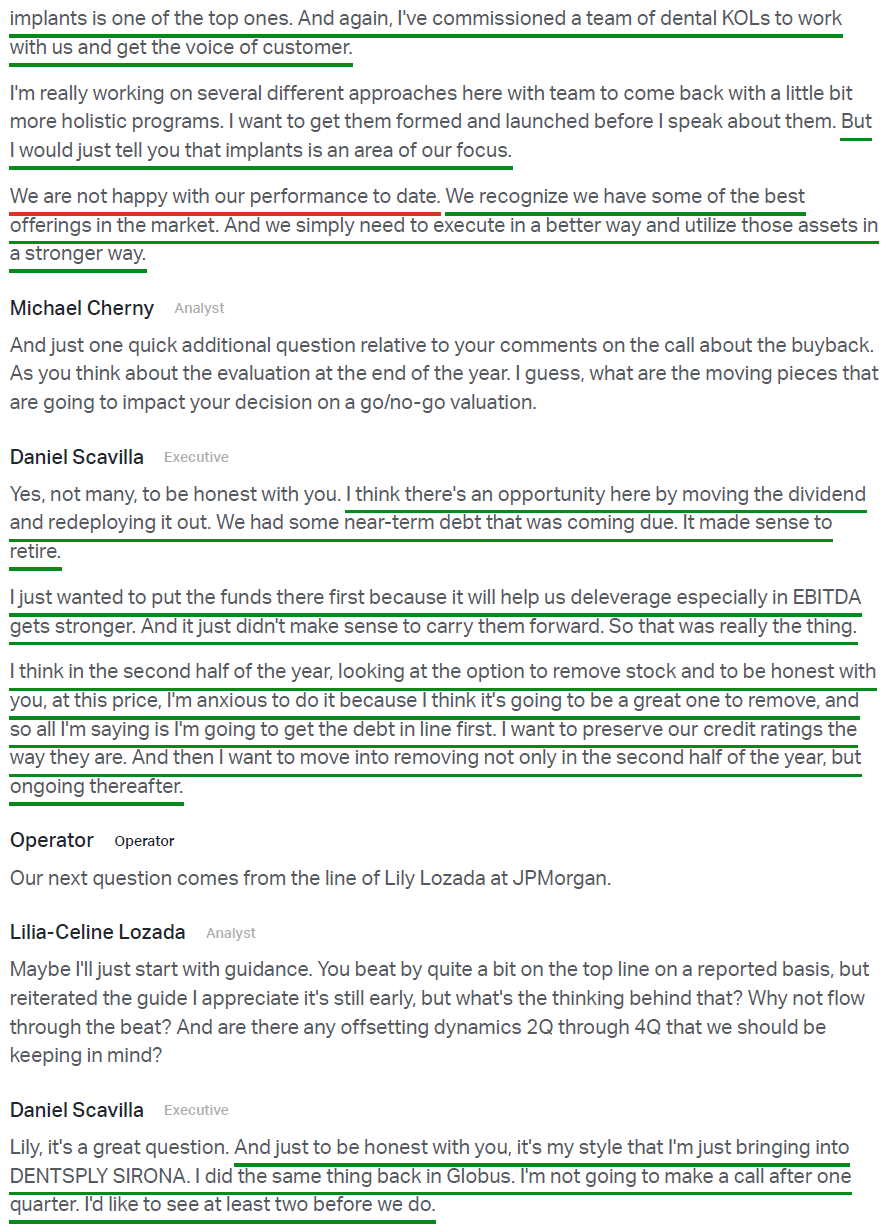
8) XRAY ended the quarter with $190M of cash and equivalents against ~$2.2B of total debt, bringing net debt-to-EBITDA to ~3.3x. The company retired $79M of debt during the quarter, an early proof point of the new capital allocation strategy at work following last quarter’s dividend elimination (~$128M in annual savings freed up). Management remains committed to maintaining investment-grade credit metrics, with debt reduction the top near-term priority before pivoting to opportunistic buybacks later this year.
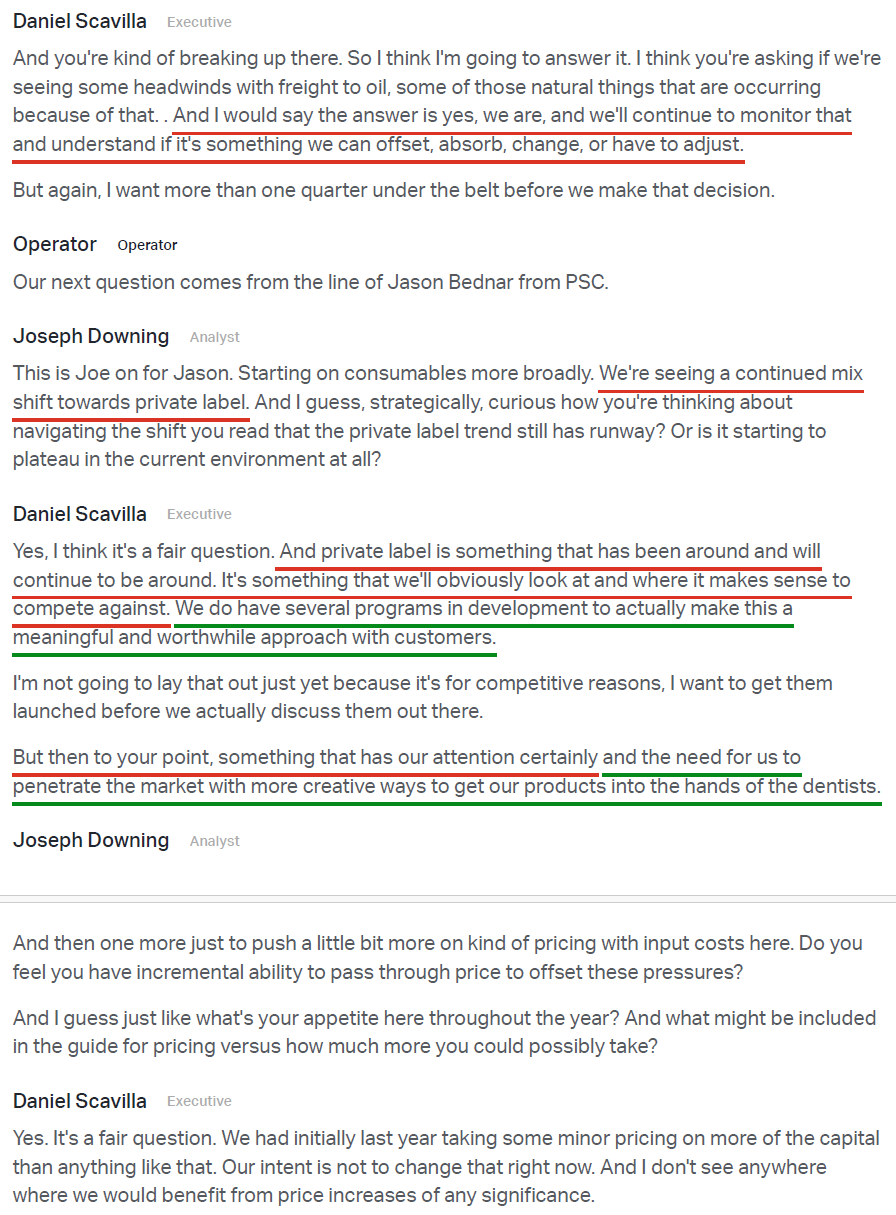
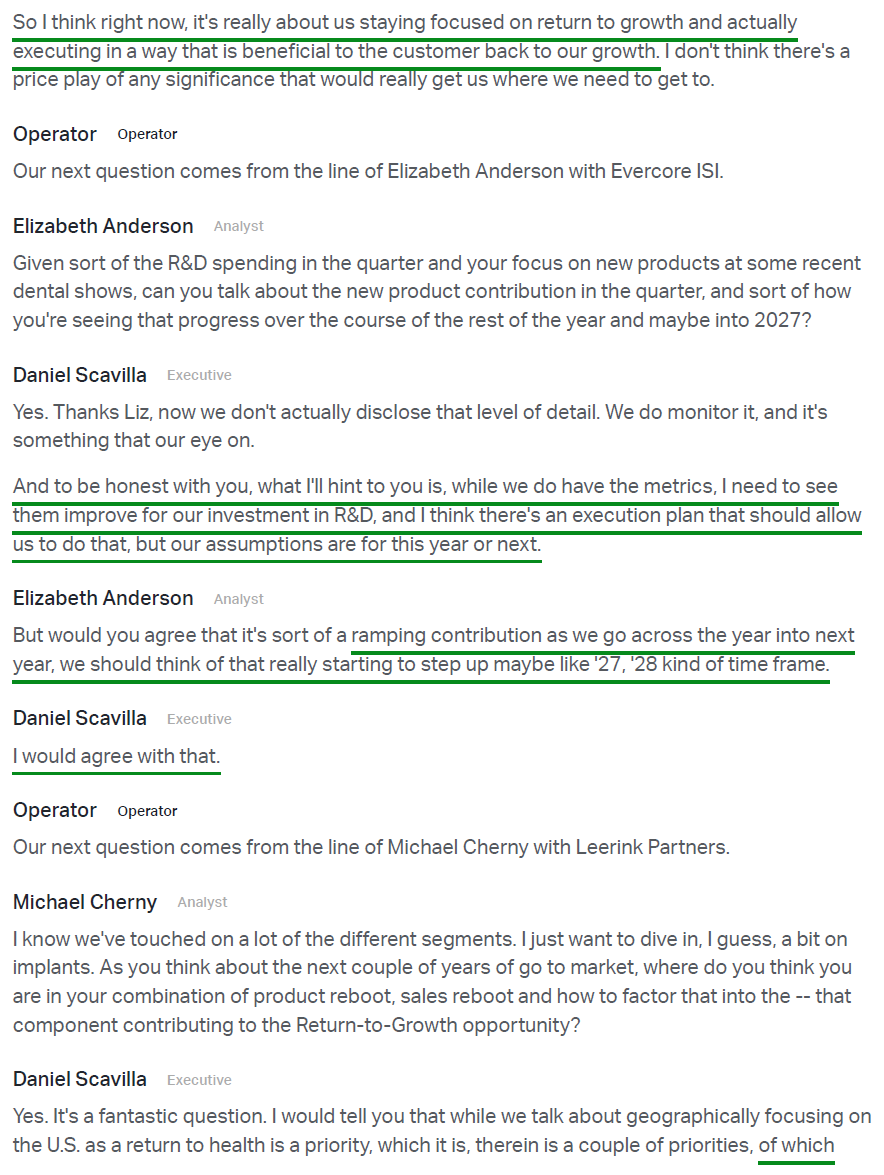
9) On capital allocation, CEO Dan Scavilla reiterated his appetite for opportunistic share repurchases in the second half of the year, noting, “at this price, I’m anxious to do it because I think it’s going to be a great one to remove.” Management is prioritizing debt paydown first to preserve investment-grade credit metrics, with the goal of moving into buybacks in 2H 2026 and continuing thereafter.
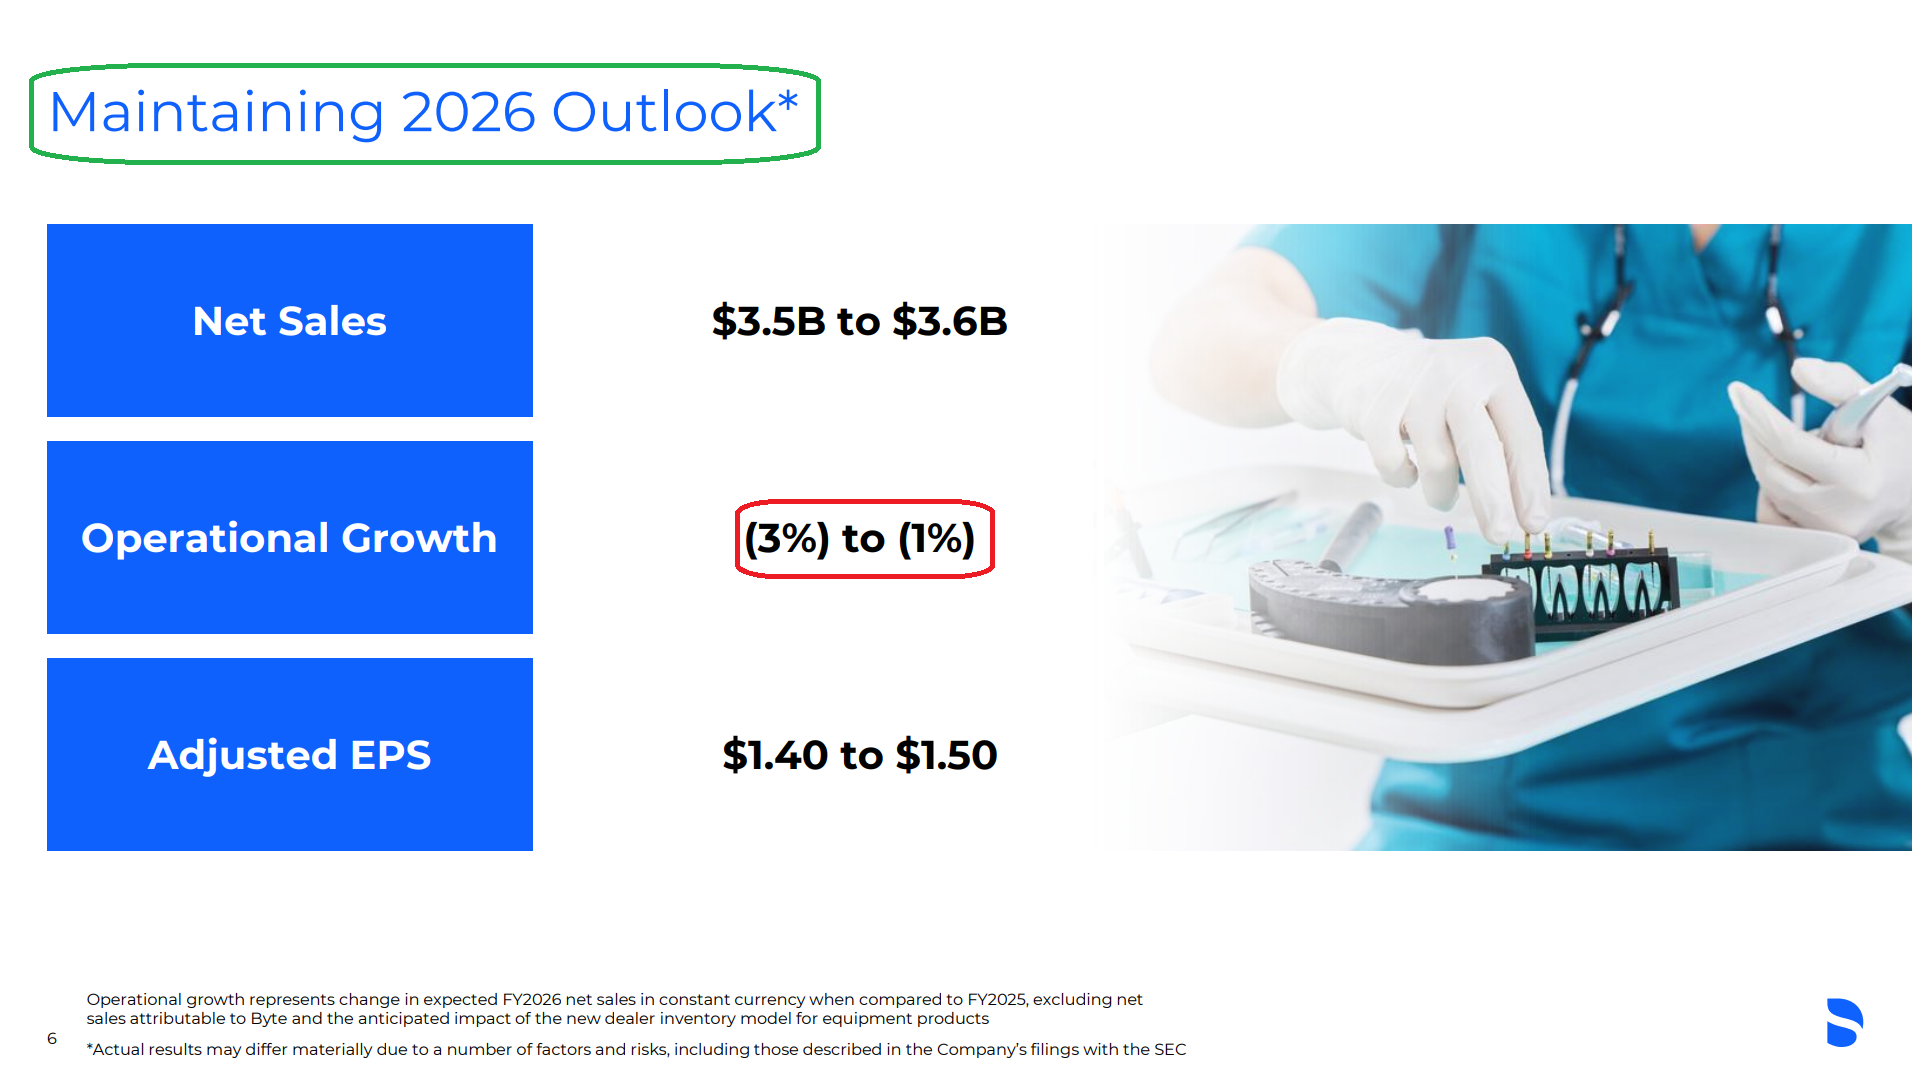
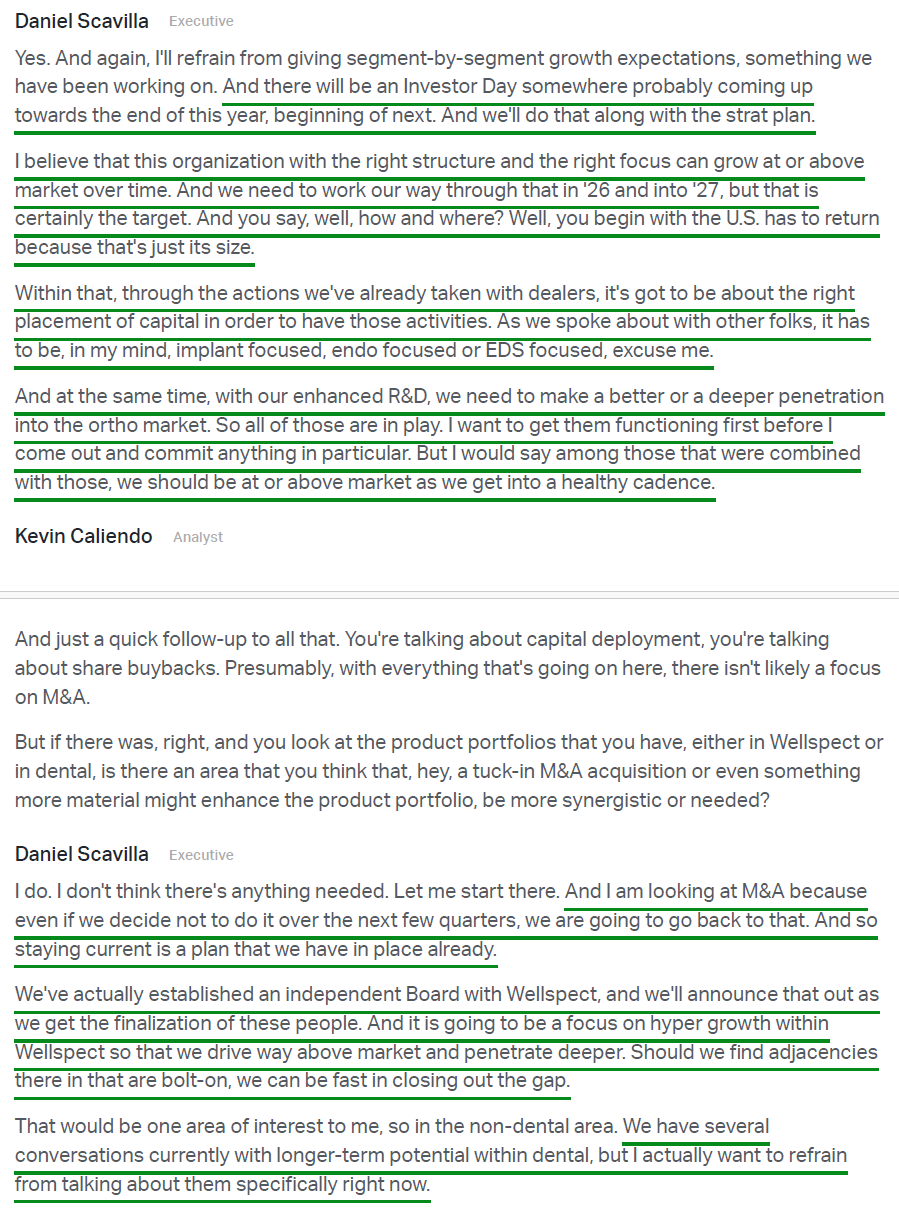
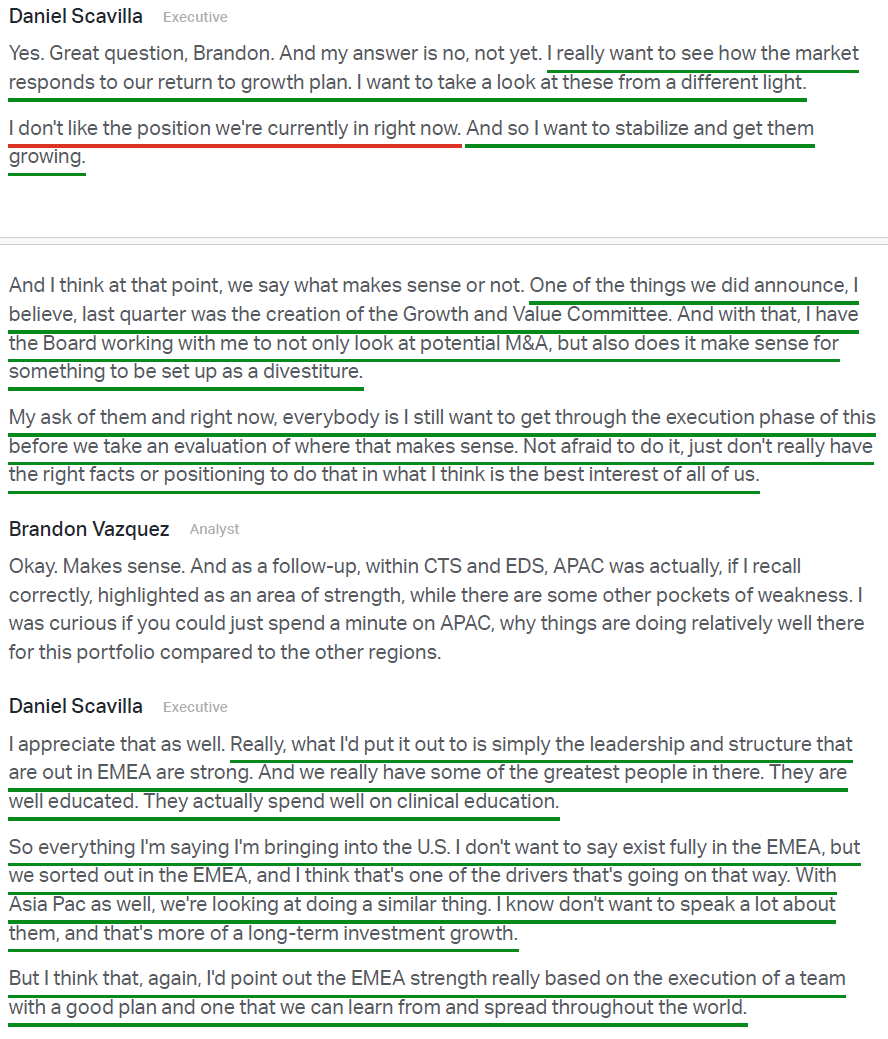
10) Despite the strong Q1 revenue beat, management reiterated FY26 guidance for net sales of $3.5B-$3.6B (vs. consensus $3.58B), operational growth of -3% to -1%, and adjusted EPS of $1.40-$1.50 (vs. consensus $1.43). Management framed the decision as a matter of style, wanting at least two quarters before adjusting the guide, and noting, “I’d rather be appropriately conservative than anything else right now.” With restructuring savings building through the year and U.S. turnaround initiatives gaining traction in 2H 2026 and into 2027, the setup likely leaves a low bar for upside surprises. Management also plans to host an Investor Day toward the end of this year or early 2027 to lay out the strategic plan and the path to returning the business to at or above market growth.
Earnings Call Highlights
Morningstar Analyst Note
General Market
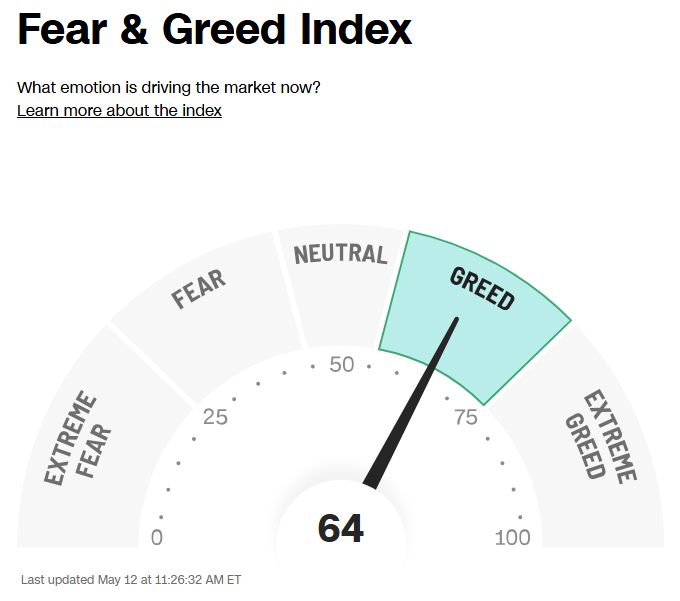
The CNN “Fear and Greed Index” ticked down to 64 this week from 67 last week. You can learn how this indicator is calculated and how it works here: (Video Explanation)
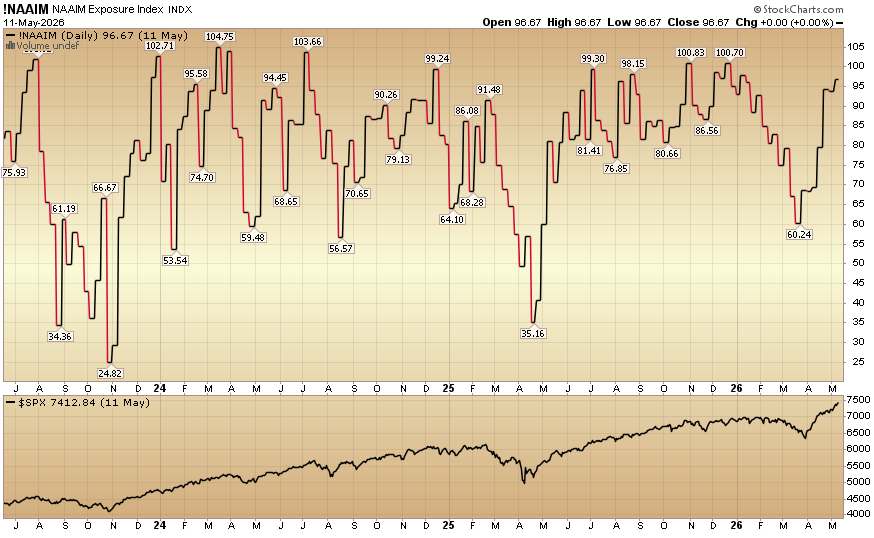
The NAAIM (National Association of Active Investment Managers Index) (Video Explanation) rose to 96.67% equity exposure this week from last week’s 93.79%.
Our podcast|videocast will be out sometime today. We have a lot of great data to cover this week. Each week, we have a segment called “Ask Me Anything (AMA)” where we answer questions sent in by our audience. If you have a question for this week’s episode, please send it in at the contact form here.
Larger accounts $5-10M+ can access bespoke service anytime here.
Not a solicitation.
*Opinion, Not Advice. See Terms


