

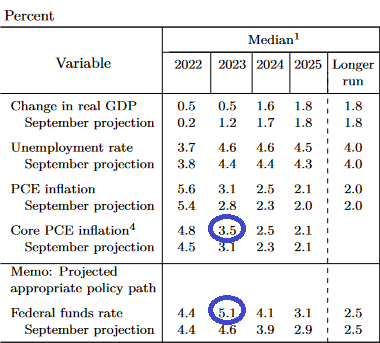
While no one was excited about the terminal rate being pushed to 5.1% (from 4.6%) in the Fed’s dot plot yesterday, the market doesn’t believe it anyway. The 2-year treasury yield closed at 4.23% – now below the effective Fed Funds rate of 4.25-4.50%. The first move in equities (following an FOMC decision) is often the wrong move, so we’ll see how things play out in coming sessions – after the dust settles…
On Friday, I joined Cheryl Casone on Fox Business – The Claman Countdown – to discuss our outlook into year-end and one key idea that we think makes sense at these levels. Thanks to Milanee Kapadia, Kat Meyers, Stu Oppenheim, Liz Claman and Cheryl for having me on:
Watch FULL interview in HD directly on Fox Business
Later that night I joined Phil Yin on CGTN America for 3 key picks – looking out to 2023 and beyond. Thanks to Delal Pektas and Phil for having me on:
Watch FULL interview in HD directly on CGTN America
Inflation
Headline CPI was up .1% month on month on Tuesday. If that pace persists, we’ll be below 3% by May (currently 7.1%). And the Fed’s preferred metric of Core PCE would be MUCH LOWER THAN THE FED IS PROJECTING – 3.5% for 2023 (currently 5%).

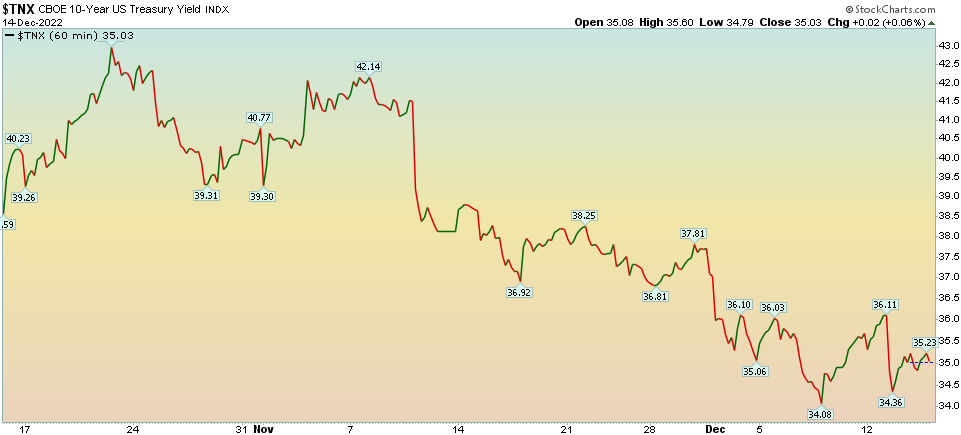
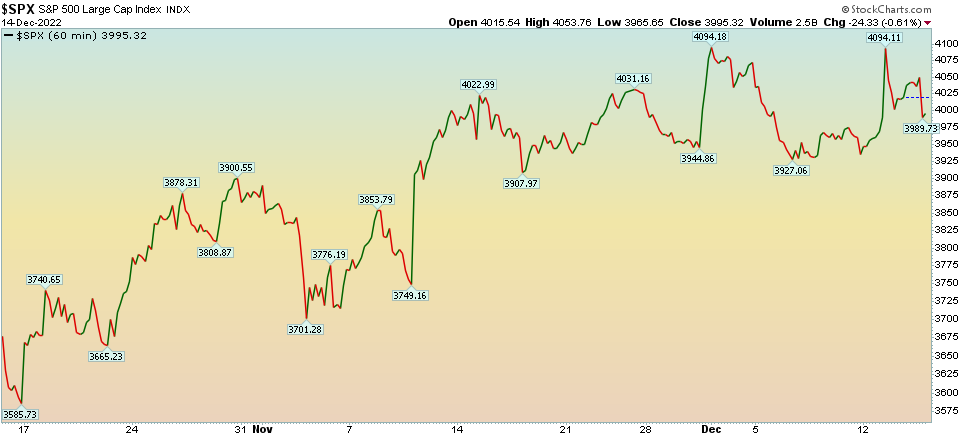
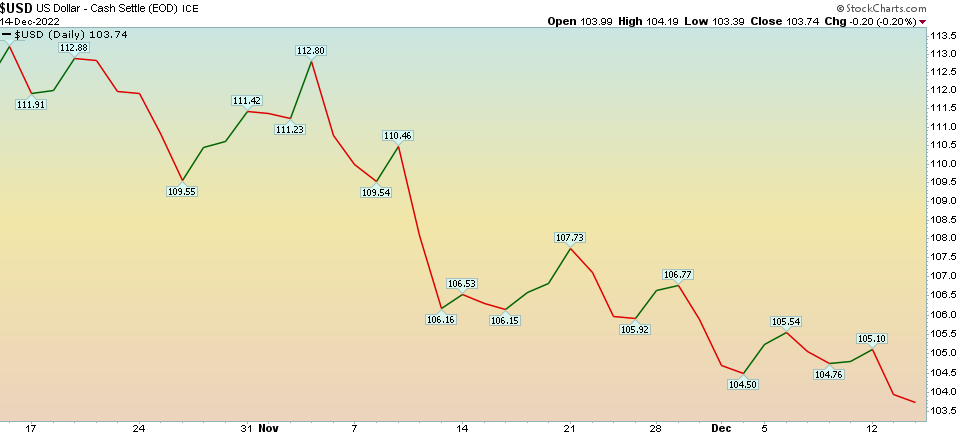
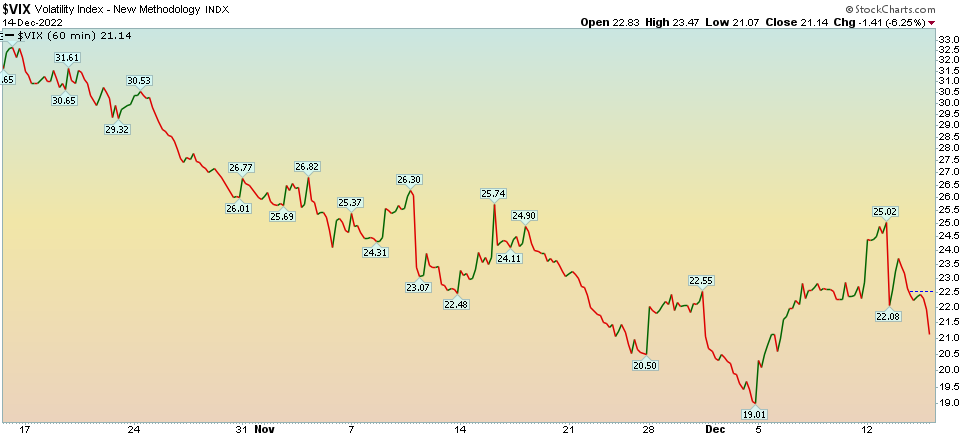
As active as the last two days felt, the reality is, bond yields came DOWN, stocks were around flat, dollar weakened, VIX weakened:
 Our base case is that the data between now and February will continue to show a decline in headline inflation – as we saw on Tuesday – yielding a maximum of one more hike (25bps) and then a long pause to see the lagged effects of this aggressive tightening cycle.
Brea(d)th & More…
But when you step back and take a brea(d)th, you will see that things are improving. The percentage of stocks trading above a specific moving average is a breadth indicator that measures internal strength or weakness in the underlying index. These indicators measure the degree of participation.
In the first example we have charted S&P 500 stocks above the 200 day moving average. 6 out of 6 times over the past 20 years, when this indicator dropped below 20 and then subsequently exceeded 60 it was the beginning of a multi-year rally. We have recently closed above 60 after dropping below 20 earlier this year.
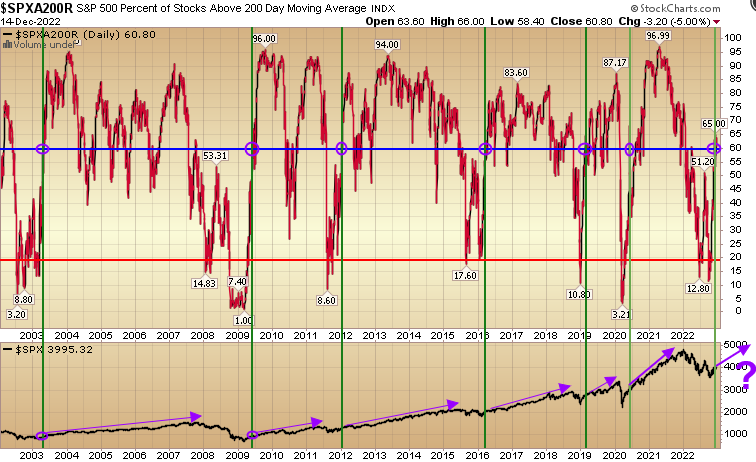
Will it prove to be correct 7 out of 7 times? We don’t know, but as we always say, “amateurs deal in absolutes and professionals deal in probabilities.” The odds favor some meaningful follow through over the next 6-12 months.
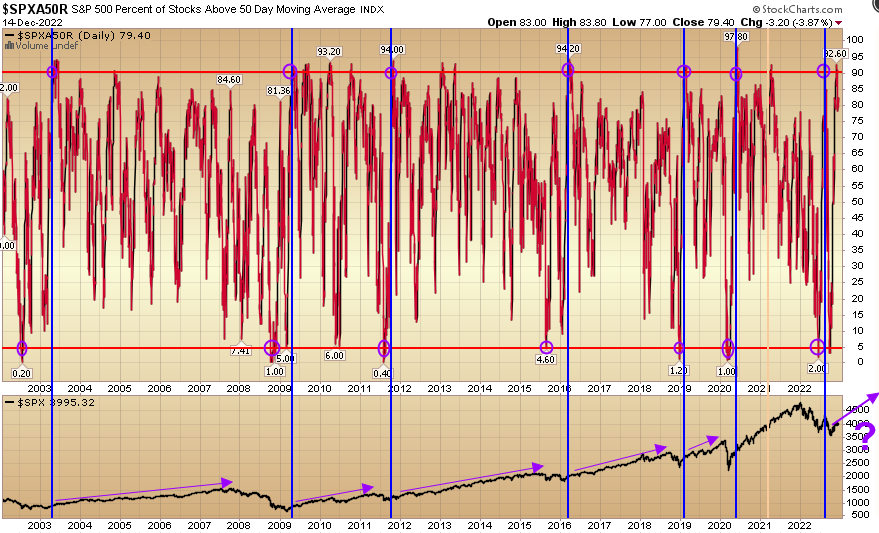
Next we have S&P 500 stocks above their 50 day moving average. Each time this indicator dropped below 5% and subsequently closed above 90% it led to a multi year rally in the S&P 500. Note in late 2011 after the indicator triggered, you has a small consolidation/pullback before commencing the three year rally in stocks.
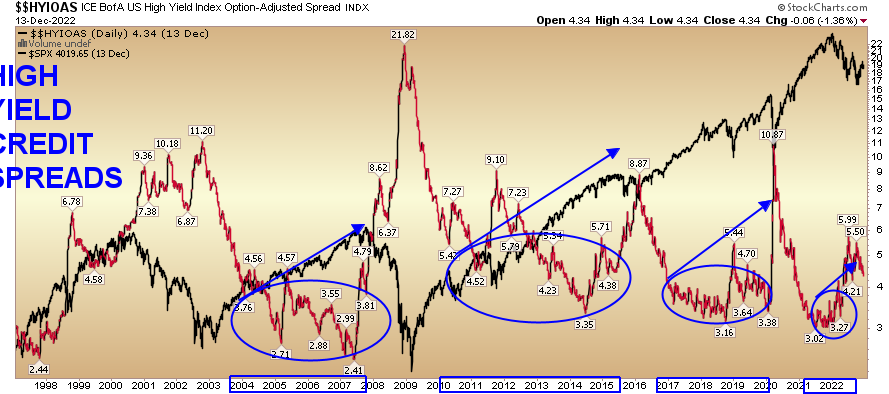
High Yield credit spreads are coming down (from 5.99% to 4.34):
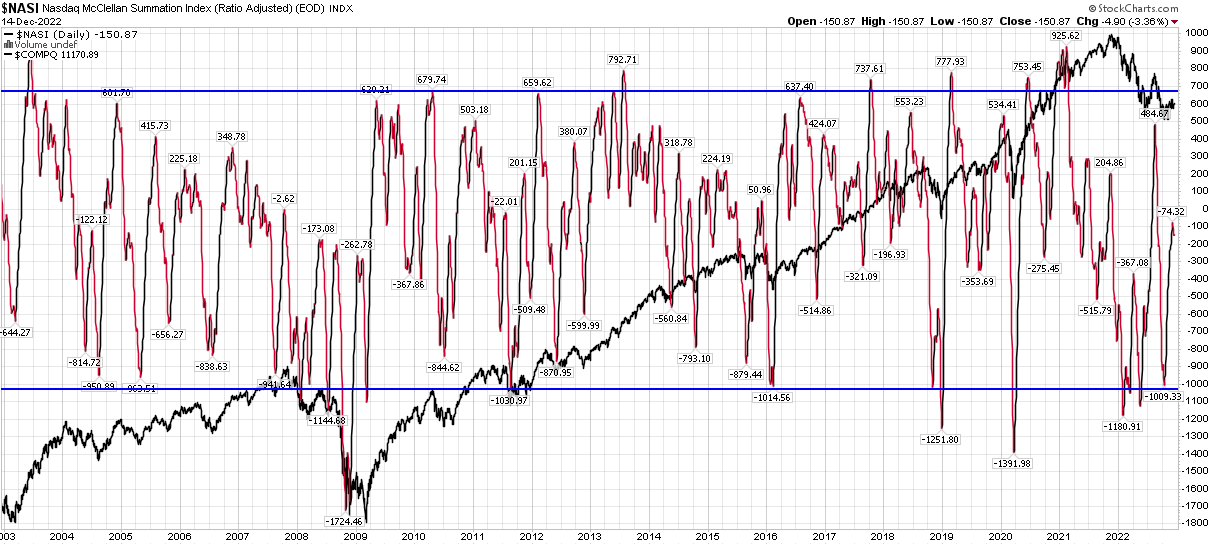
The Nasdaq McClellan Summation index is working its way back higher after reaching a capitulatory -1000 level earlier this year:
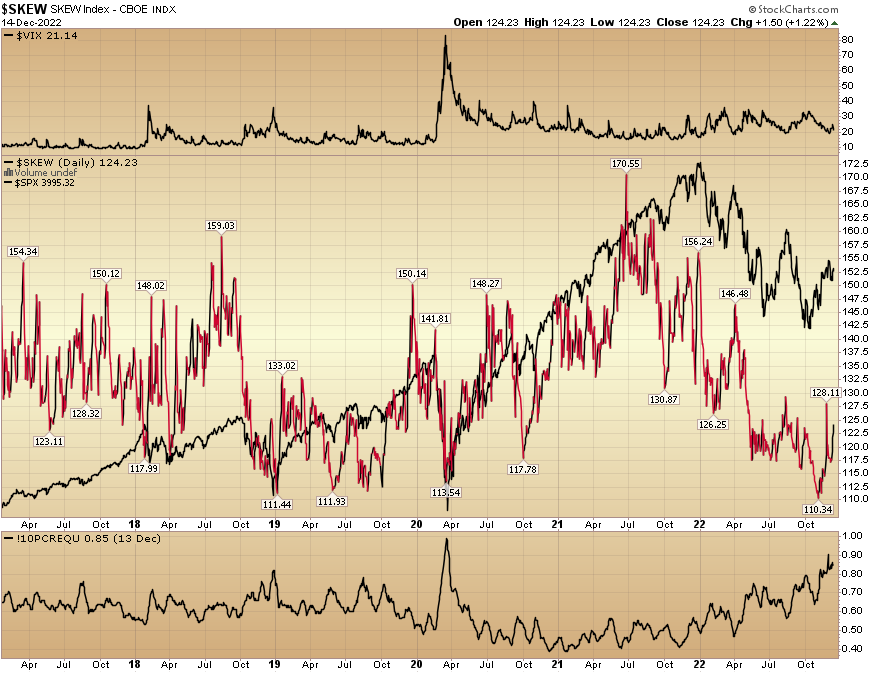
VIX is trending down. Option Skew (price/demand to insure 1-2SD moves) is washed out (low demand from smart money to insure AFTER house burned down) and the 10-day put/call ratio has reached capitulatory levels (dumb money paying up for short term “at the money” insurance = similar to pandemic and Dec 2018 lows).
More On the Fed
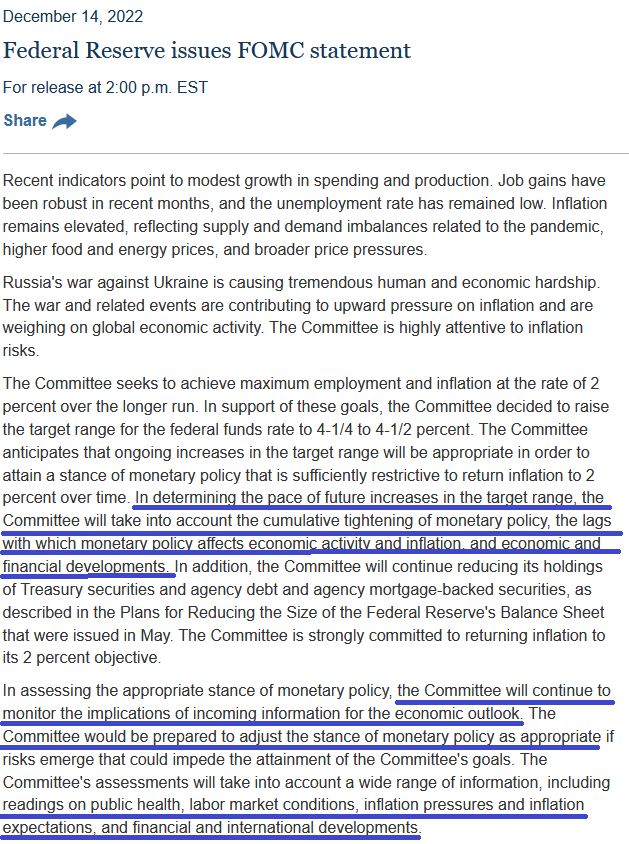
Note the hawkish talk in the statement tempered by a recognition of the lagged effect and staying data dependent moving forward. In short, more double-talk. Why do they keep talking out of both sides of their mouths? Because they have no clue what’s going to happen. Just as they projected a 1% fed funds rate for 2022 (now 4.25-4.50%), it is equally unlikely their 5.1% projection (above) will be correct for 2023.
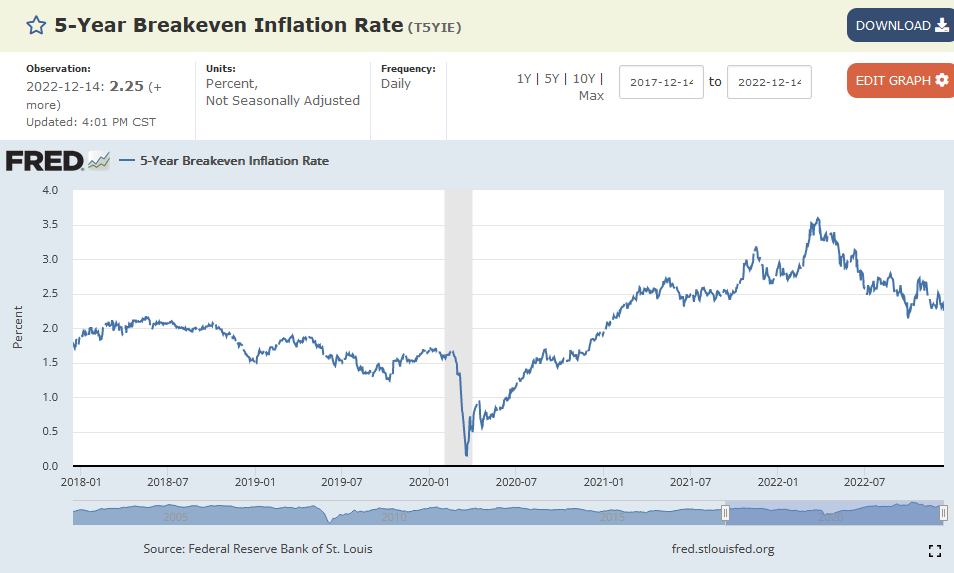
What they do know is that they want to ANCHOR long-term inflation expectations down to 2% so that behavior does not change. To that end, they succeeded with renewed “tough-talk” in their dot plot today. 5 year inflation break-evens collapsed to 2.25% (now approaching 2018 levels of 2.12%).
The most important takeaway from their projections above is that they are projecting anemic growth of .5% real GDP, declining inflation to 3.5% (Core PCE) while simultaneously needing another 75bps in hikes? As my friends in Texas like to say, “that dog don’t hunt.” And the bond market is calling B.S. – with the 2yr yield down to 4.23% and 10yr yield down to 3.49%.
Who will be right – the bond market (which tends to be correct) – or the FOMC (who have a history of erroneous projections)? Time will tell, but keep in mind when their projections CHANGE, they change quickly and without notice or apology…
Sentiment and Positioning
On Tuesday, I posted a summary of Bank of America’s Global Fund Manager Survey. Each month they survey ~300 managers with ~$750B AUM. You can find it here:
December 2022 Bank of America Global Fund Manager Survey Results (Summary)
The five most important points were:
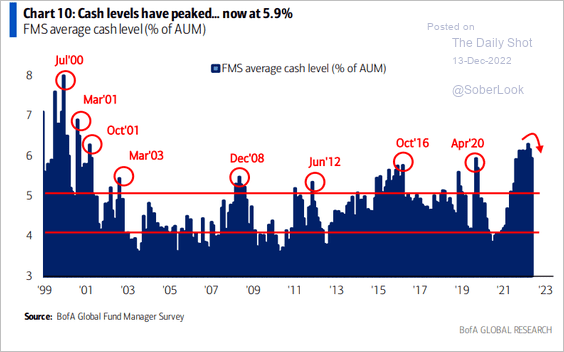
- Cash levels are still higher than Pandemic and GFC lows (but now starting to come down):
 2. 75% of managers in the December survey forecast a stronger China economy in 2023, up significantly from a net 13% in November and the most optimistic survey result since May 2021.
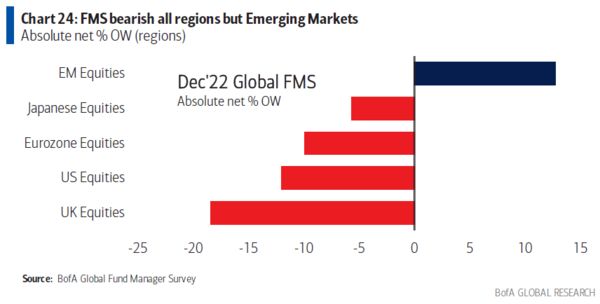
3. Managers are finally starting to add emerging markets equities as the dollar falls:
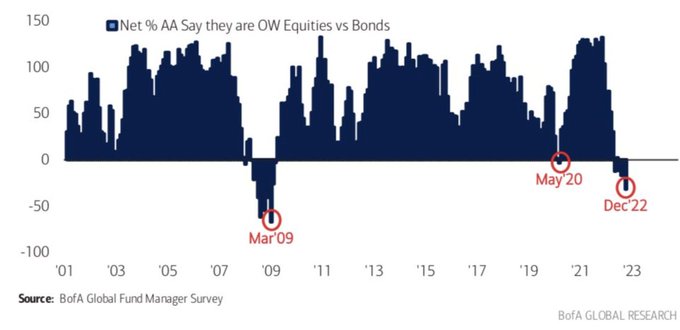
4. Managers buying short term bonds over equities at the bottom – just like 2020 and 2009:
5. Most crowded trades: long US dollar, short China equities, long oil, long ESG assets, short EU equities and long T-bills.
Now onto the shorter term view for the General Market:
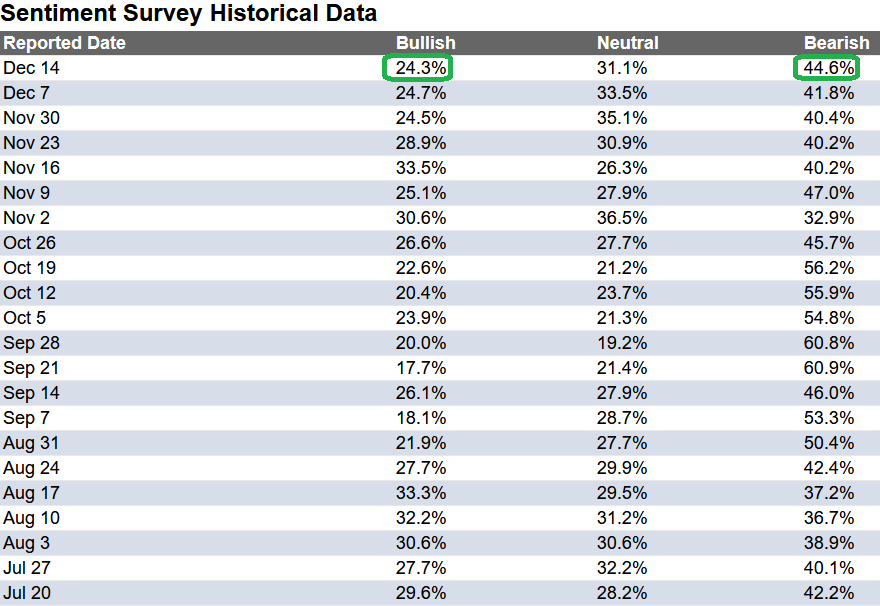
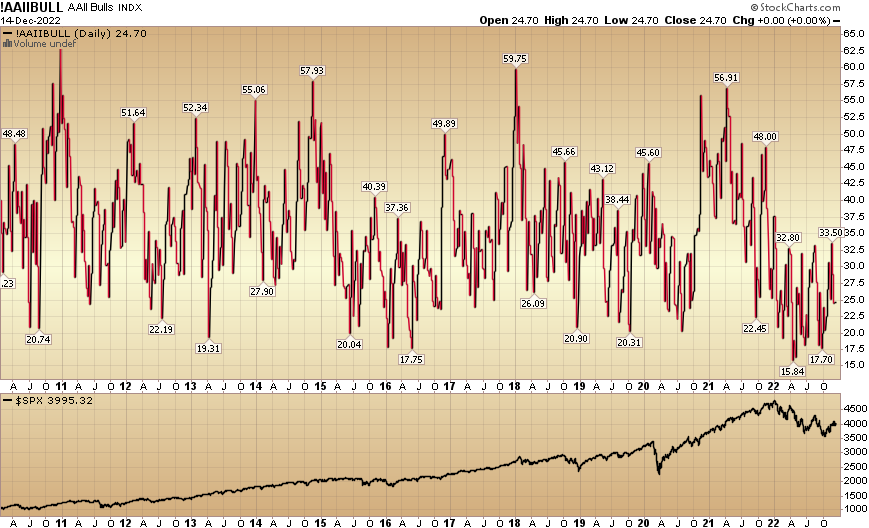
In this week’s AAII Sentiment Survey result, Bullish Percent (Video Explanation) flat-lined to 24.3% from 24.7% the previous week. Bearish Percent moved up to 44.6% from 41.8%. Sentiment is still despondent for retail traders/investors.
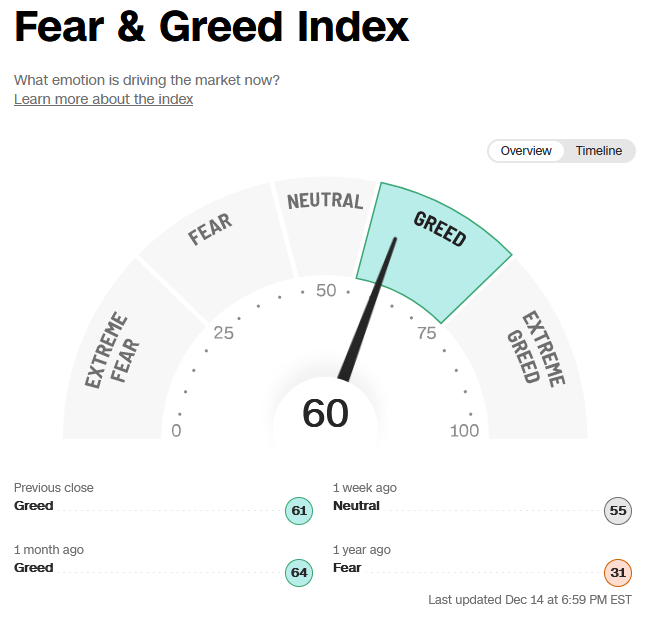
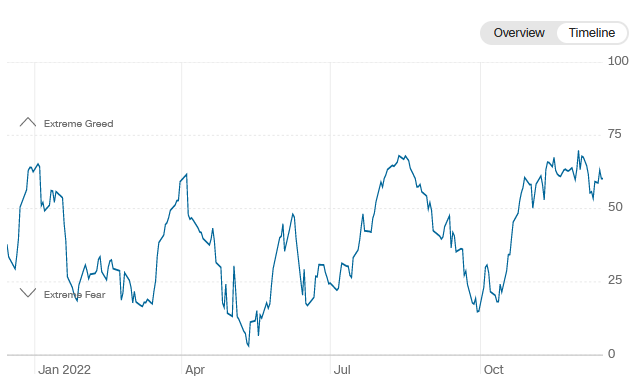
 The CNN “Fear and Greed” ticked up from 58 last week to 60 this week. Sentiment is slowly ticking up. You can learn how this indicator is calculated and how it works here: (Video Explanation)
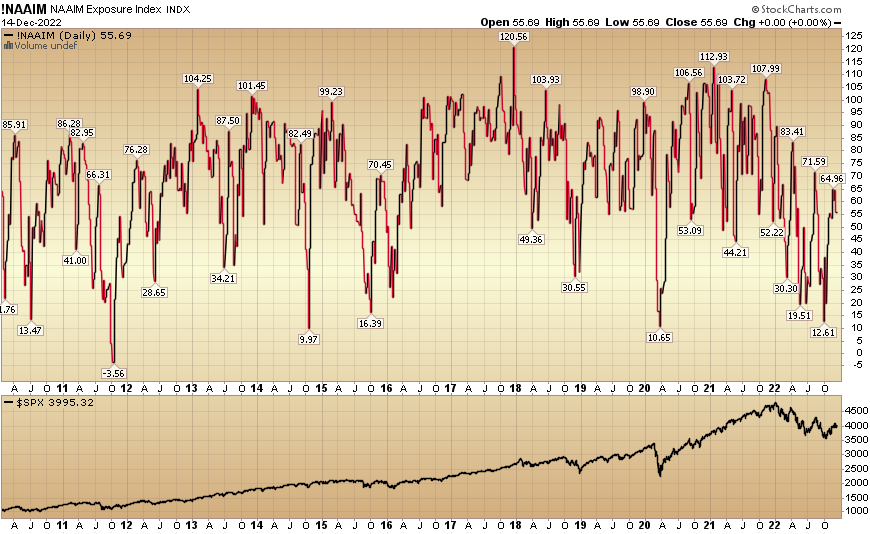
 And finally, the NAAIM (National Association of Active Investment Managers Index) (Video Explanation) moved down to 55.69% this week from 64.36% equity exposure last week.
Our podcast|videocast will be out today or tomorrow. Each week, we have a segment called “Ask Me Anything (AMA)” where we answer questions sent in by our audience. If you have a question for this week’s episode, please send it in at the contact form here.
*Opinion, not advice. See “terms” above.


