
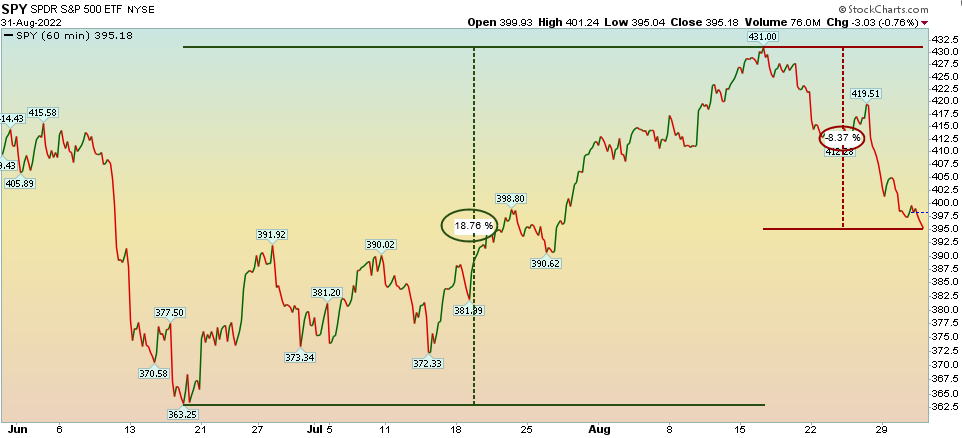
After an 18.7% rally off the June lows – that no one believed and were forced to chase UP in the beginning of August – (just like the perfect playbook) they opened the trap door with an 8.37% correction/consolidation to punish the “Johnny Come Latelies.” Like I said on CNBC on Sunday evening (Monday morning), “the market needed a reason to consolidate and Jay Powell gave it to them on Friday:”
CNBC Street Signs
Thanks to Celestine Francis, Ginny Goh, Tanvir Gill and Will Koulouris for having me on CNBC Street Signs (Asia) to discuss: Jackson Hole, Fed policy, META, China, Alibaba and more… Watch it here:
Here were my show notes ahead of the segment:
FED: Friday was a continuation of “jawboning.” TALK hawkish, ACT dovish. Bring down inflation expectations but don’t tighten more than you have to.
2 points to keep in mind regarding Jackson Hole:
1) The Fed could crush inflation at any time by raising rates to 6% overnight. They haven’t.
2) Debt Servicing: Every 1% hike increases the U.S. deficit by $285B/yr. TALK hawkish, ACT dovish has been the playbook.
Jawboning has worked (to anchor inflation expectations) and will continue. 5yr breakevens at 2.71%.
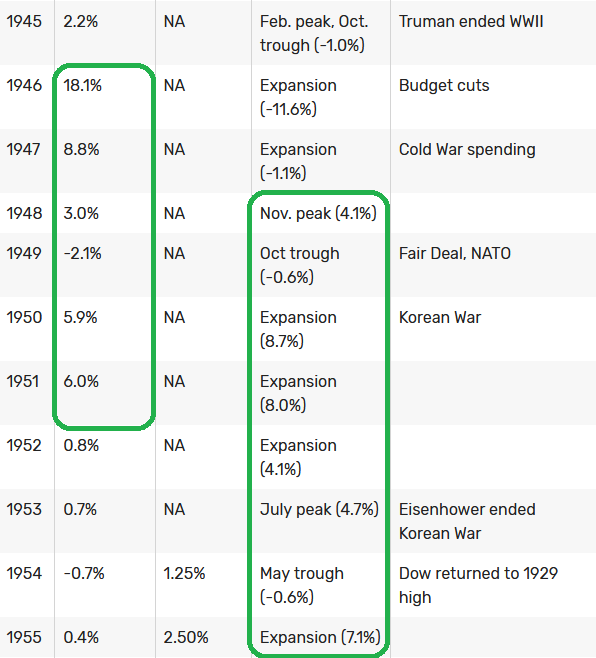
-With >125% Debt to GDP we expect Fed to let inflation run above 2% for some time (3-5%). This was the post WWII playbook when they brought Debt to GDP down from ~120% to 63% in five years. Here is the data and playbook (look at the hot inflation numbers and hot GDP in the years following the end of WWII). For WWII we borrowed aggressively to fight a visible enemy. During COVID, we borrowed aggressively to fight an invisible enemy:

Source: TheBalance
Note the fact that inflation ran up to 18.1% (1946) before collapsing to –2.1% just 3 years later (1949). They had to get the factories converted (and up and running) after the soldiers came home – but demand boomed in the meantime (there was more demand for goods than they could supply – causing short-term structural inflation). Sound familiar?
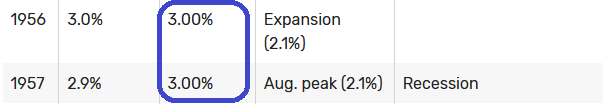
GDP started to run hot in 1948 at +4.1% and remained high for another 5 years after that: 1951 +8%, 1952 +4.1%, 1953 +4.7% and 1955 +7.1%. Inflation ran above trend for the first few years and then GDP exploded higher as inflation moderated. OF IMPORTANT NOTE is the fact that DESPITE INFLATION RUNNING HOT FOR A FEW YEARS, THE PEAK FED FUNDS RATE WAS 3.0% DURING THIS PERIOD. It is my expectation that this time will be no different (which implies max 50-75bps more in hikes THEN DONE).
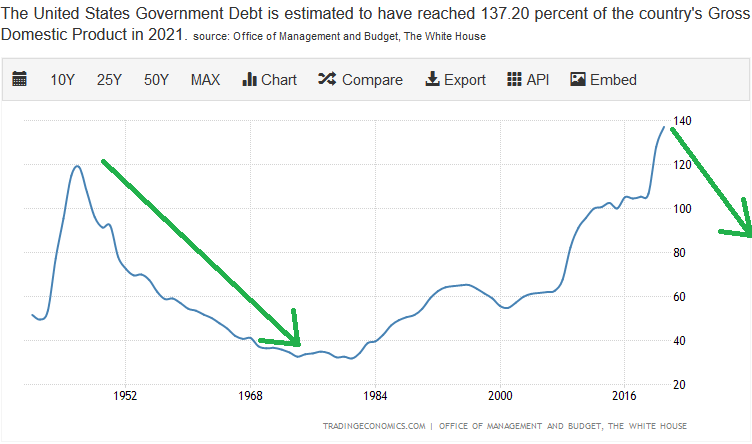
By 1953, Debt/GDP collapsed from ~120% to ~70% before bottoming in the mid 30%s. For those looking at the 1970’s as an inflation analog, you are looking at the wrong decade. The post WWII playbook will work, and that is the game plan in motion (whether by design or by accident).
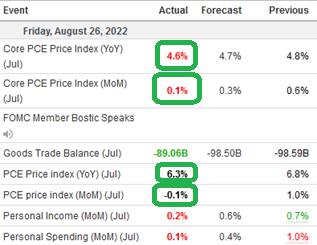
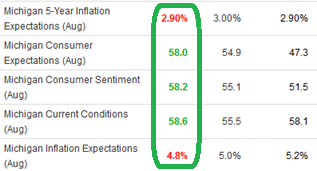
Important Data from Friday. Fed’s favorite measure of inflation is coming DOWN. Consumer Sentiment Recovering:
*Fed was among the first to aggressively tighten. They will be the first to slow the pace and pivot.
As we saw in Salesforce (and other earnings guidance) guidance, the strong USD (from tight policy) has started to weigh on earnings. The dollar will weaken when the Fed changes pace (which could be as early as this month).
*Fed Pres (KC) Esther George said, “lags (from policy) are long and variable”
*Fed Pres (Phili) Harker said, “86 hikes since 1983. 75 were under 50bps. 75bps is unusual. 50bps is STILL SUBSTANTIAL”
-Implication is they want to see the lagged effect of recent 75bps hikes before going too aggressively on 75bps or QT schedule.
–Jobs Report and CPI/PPI numbers in September more important than Jackson Hole. Sell-off was light volume. We should see downside follow through for few days or so until buyers step in.
-Natural to have consolidation after huge move off June lows that caught managers offsides.
–Fed has completed 1/3 of QT that was scheduled to this point. 2/3 incomplete. QE is the “Hotel California – you can check in but never leave.” ECB already back with QE facility after Hedge Funds shorting Italian bonds at highest level since 2008.
– Recession expectations higher than Apr 2020, March 2009. These were bottoms, not tops.
–No one believed the bounce and institutions are still holding cash at April 2020 and March 2009 levels (BofA survey last week).
-The “pain trade” is still UP – even if we consolidate the Summer gains for a few weeks.
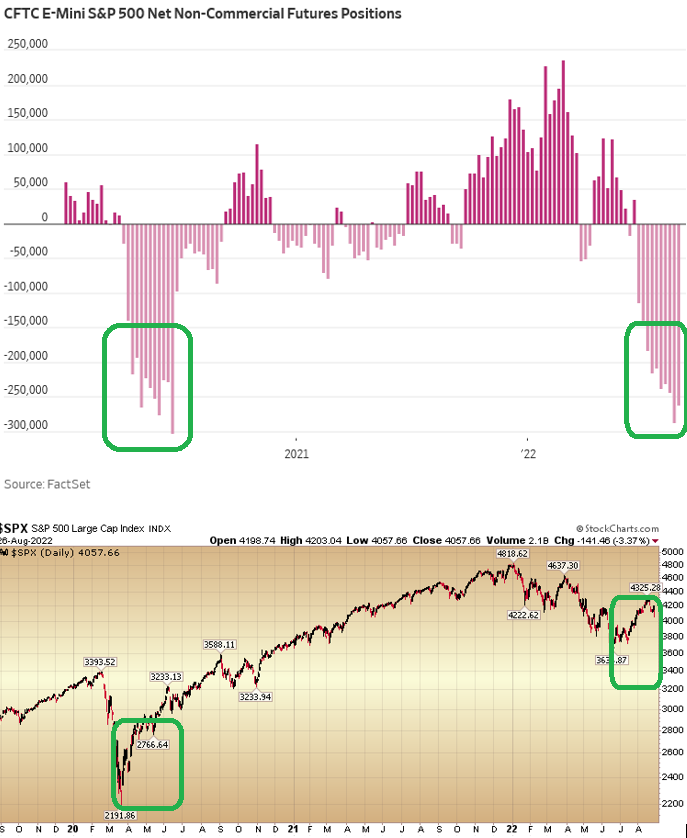
Non-Commercials Net Short positions are the highest since April 2020. The stock market low was in the rear view mirror:
CHINA
-The best performers Thursday/Friday were Chinese Stocks on the PCAOB/CSRC Audit Deal completed to keep (non-SOE) Chinese businesses listed in US. It now looks like Alibaba will be one of the first companies that US regulators will inspect the Audit Papers in Hong Kong in mid-September. In case you are wondering how that will go, Sumeet Kapoor (a long time listener of our podcast) posted this from their latest annual report. It is Price Waterhouse Cooper’s own signed words regarding their audits of Alibaba since 1999: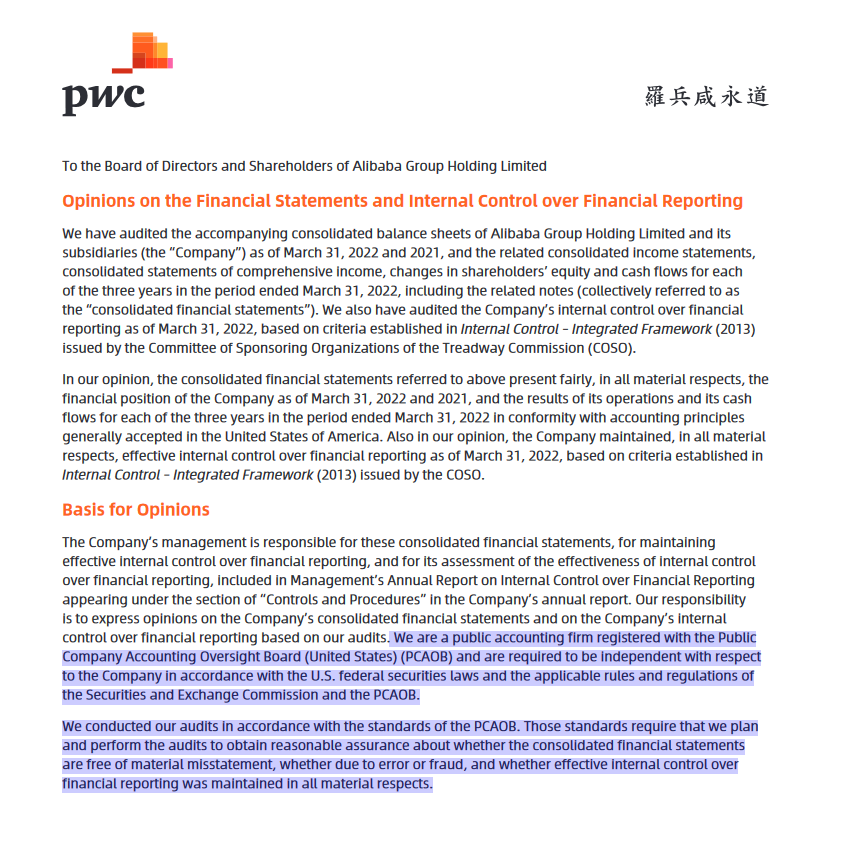 Page 295 (2022 Annual Report):
In our opinion, the consolidated financial statements referred to above present fairly, in all material respects, the financial position of the Company as of March 31, 2022 and 2021, and the results of its operations and its cash
flows for each of the three years in the period ended March 31, 2022 in conformity with accounting principles generally accepted in the United States of America. Also in our opinion, the Company maintained, in all material respects, effective internal control over financial reporting as of March 31, 2022, based on criteria established in Internal Control – Integrated Framework (2013) issued by the COSO.We conducted our audits in accordance with the standards of the PCAOB. Those standards require that we plan and perform the audits to obtain reasonable assurance about whether the consolidated financial statements are free of material misstatement, whether due to error or fraud, and whether effective internal control over financial reporting was maintained in all material respects.
We conducted our audits in accordance with the standards of the PCAOB.
–De-Listing was a big overhang on high quality businesses like Alibaba.
–The dual listing in Hong Kong could bring as much as $30B of demand (mainland China buyers) through the Stock Connect (this is the size of Mainland ownership in Tencent). Institutions will figure this out and start to front-run this demand before the end of the year (as pessimism for the region abates).
-Aggregate earnings have delivered an upward surprise of 9.4% for over half of the 715 MSCI China Index members that have reported Q2 results. Market not giving credit for turnaround yet.
-Even a policy rate cut and fiscal stimulus measures have failed to lift sentiment so far, but it will change. As I always say, “Opinion follows tend…”
-We believe it will be a huge performance contributor for us over the next 6-18 months.
-McKinsey report just out: China’s public cloud market to triple by 2025 as industrial sector drives new wave of expansion. Will grow from $32 billion in 2021 to $90 billion by 2025, as industrial and manufacturing companies shift their information technology (IT) workloads to the cloud.
-In the 2H of 2021 Alibaba had 36.7 per cent of China’s public cloud IaaS (Infrastructure as a service) and PaaS (Platform as a service) market, with Tencent and Huawei accounting for 11.1 and 10.8 per cent respectively, according to market research firm IDC.
-Can still buy at 2014 IPO levels despite the fact that revenues are up ~800% and Earnings are up ~500%.
-Buying quality businesses when they are on sale is KEY to long-term outperformance, but most can’t do it when sentiment is despondent and the crowd is selling “in the hole.” Most people prefer to follow the crowd.

The key catalyst for the chart ABOVE (Emerging Markets/China) to go UP is that the chart BELOW (US Dollar) stops going up and begins to come DOWN. That was the catalyst in 2000, and that will be the catalyst in 2022:
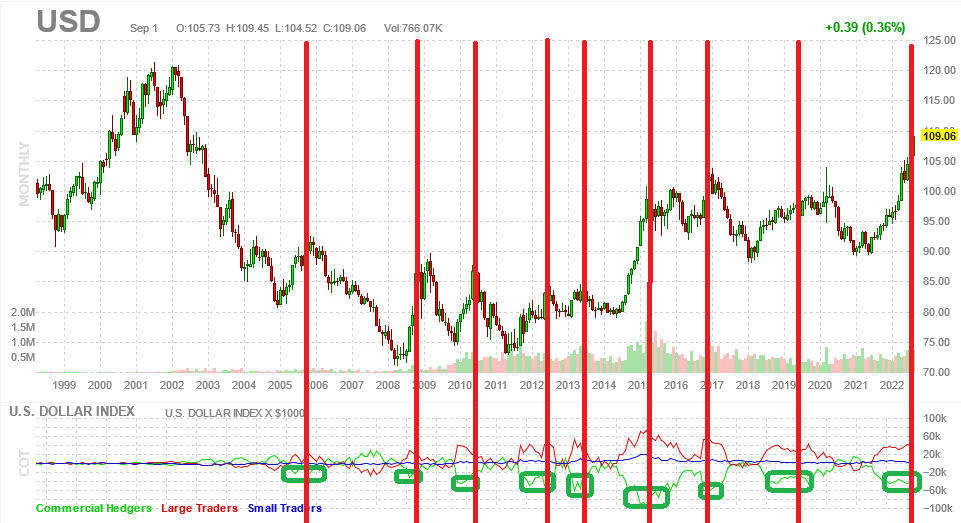
If you think the Commercials (green line at bottom of chart) are going to be wrong about shorting the dollar – ahead of the drop – for the first time in history, take the other side of the trade (stay out of Emerging Markets/China). If you think their 100% correct track record will persist, then you may want to add some China/Emerging Markets in the near future (with a 3-5yr outlook).
Hint: if the dollar weakens will our Debt/GDP ratio go UP or DOWN? What do you think the government is aiming for?
Public.com
I reiterated a similar message on Public.com (Monday morning) as I delivered Sunday night on CNBC – albeit with a bit more animation and flair (you will enjoy!). Thanks to Kori Hale and Mike Teich for having me on:
Fox Business
On Tuesday, I joined Lauren Simonetti on Fox Business – The Claman Countdown. Thanks to Ellie Terrett, Lauren and Liz Claman for having me on. My fellow panelist had a different outlook than I did, so you will find value in listening to both sides of the market on this one:
Watch in HD directly on Fox Businiess
Some notes ahead of Tuesday’s segment:
Market Sold off ~10am on: 1) JOLTS data 11.24M Job Openings vs, 10.47M Est. 2) CB Consumer confidence highest since May 103.2 v. 97.0 est.
Worry is look-through that jobs report Friday will be hot forcing the Fed to act aggressively (75bps) this month. CPI/PPI MORE IMPORTANT.
*Fed’s Bostic Today: Slower Inflation Data Could Moderate Rate Increase Size. Doesn’t Expect a Replay of 1960s-1970s Inflation
FED: Friday was a continuation of “jawboning.” TALK hawkish, ACT dovish. Bring down inflation expectations but don’t tighten more than you have to.
Jawboning has worked (to anchor inflation expectations) and will continue. 5yr breakevens at 2.71%.
-Natural to have consolidation after huge move off June lows that caught managers offsides. Put:Call ratio hit 1.22 (level implies we are nearing max fear). Fear of September seasonality (Feb & Sept worst months of year).
– Recession expectations highest since Apr 2020, March 2009 (were bottoms, not tops).
2 points to keep in mind regarding Jackson Hole:
1) The Fed could crush inflation at any time by raising rates to 6% overnight. They haven’t.
2) Debt Servicing: Every 1% hike increases the U.S. deficit by $285B/yr. TALK hawkish, ACT dovish has been the winning playbook.
-With >125% Debt to GDP we expect Fed to let inflation run above 2% for some time (3-5%). This was the post WWII playbook when they brought Debt to GDP down from 125% to 63% in five years.
If you missed the Summer rally, the market serving up another temporary opportunity to buy high quality businesses at a discount:
JNJ: 15.3x 2022 EST. 2.77% dividend while you wait.
META: 14.29x 2022 EST. 7.5% LT growth rate. Metaverse can slow spending at any time and re-open cash flow spigots. Political Ad Season.
Inflation
Why do we have so much confidence that Inflation numbers will be good this month?
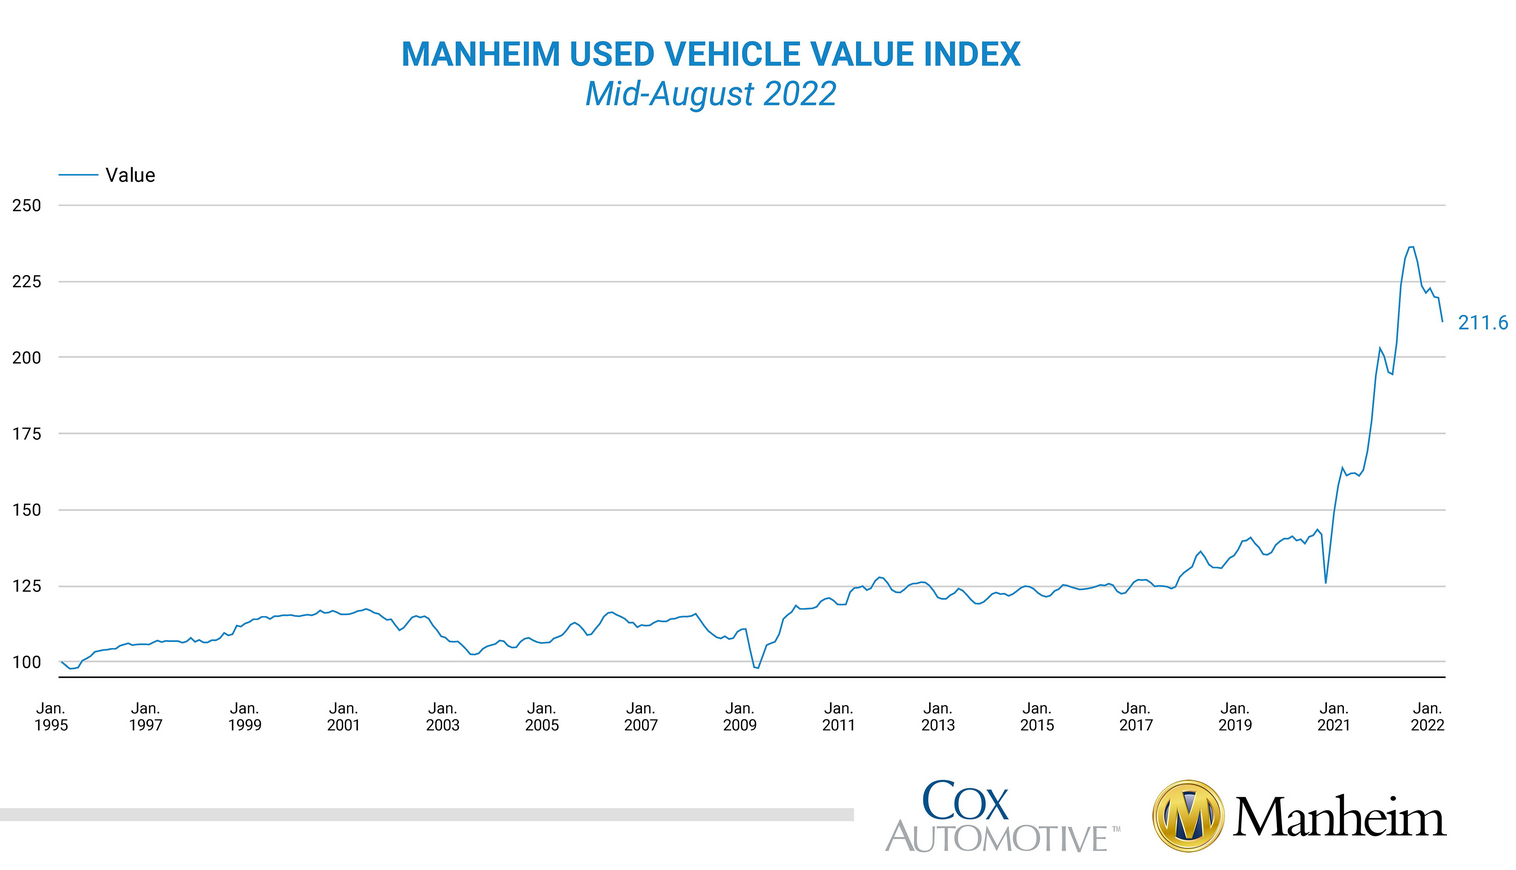
1) Used Car Prices finally rolling over now that chips are coming in and New Car deliveries picking up:
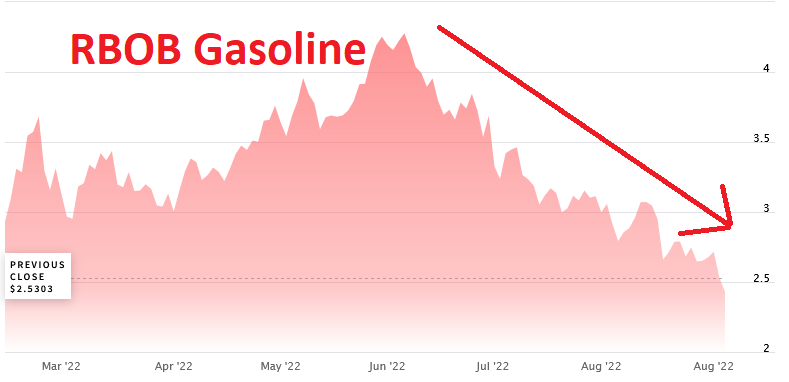
2) Gas Prices coming down daily:
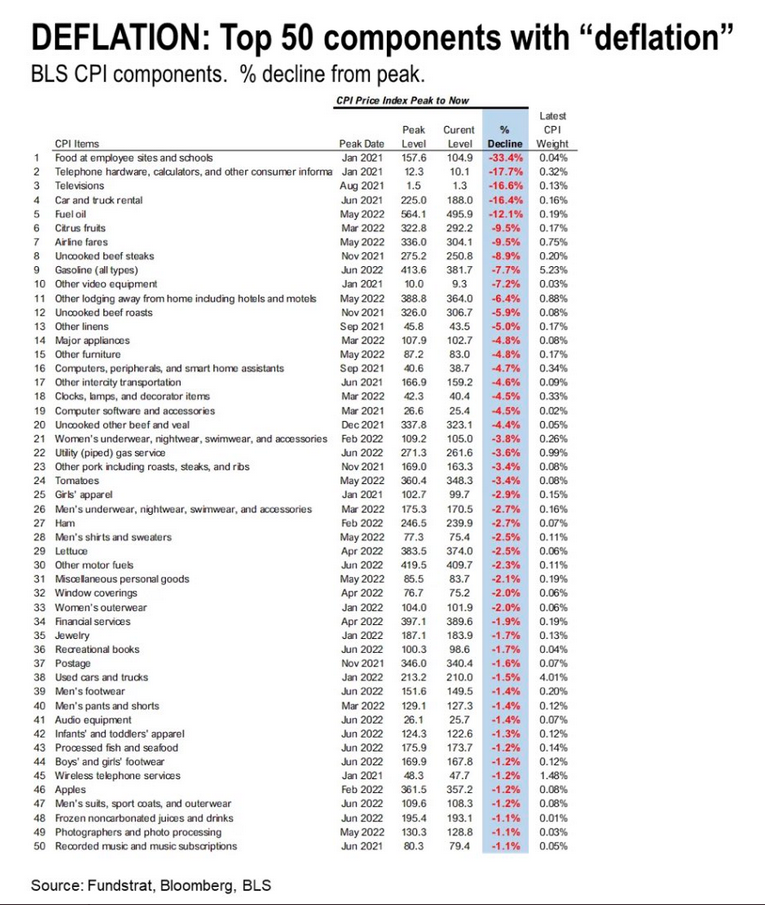
3) Majority of CPI components coming DOWN:
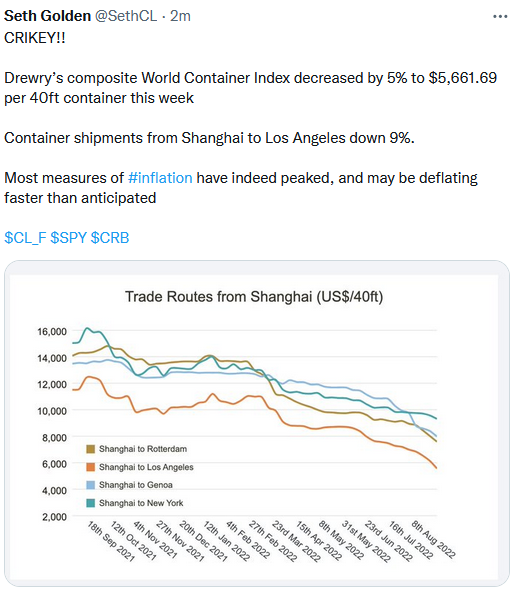
4) Freight/Shipping rates rolling over:
So while we expect Friday’s Jobs report to come in relatively okay/strong (bad for bulls), the most important number of the month comes on September 13 (CPI). This is a week before the Fed Meeting and the next interest rate decision. Based on the data above, we expect it to come in LOWER than expectations – followed by a similar outcome the next day on PPI:
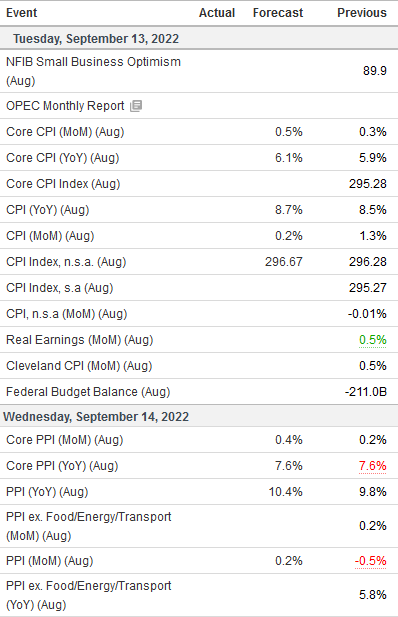
This will give the Fed cover to take 75bps off the table and go 50bps or less depending on the data.
Now onto the shorter term view for the General Market:
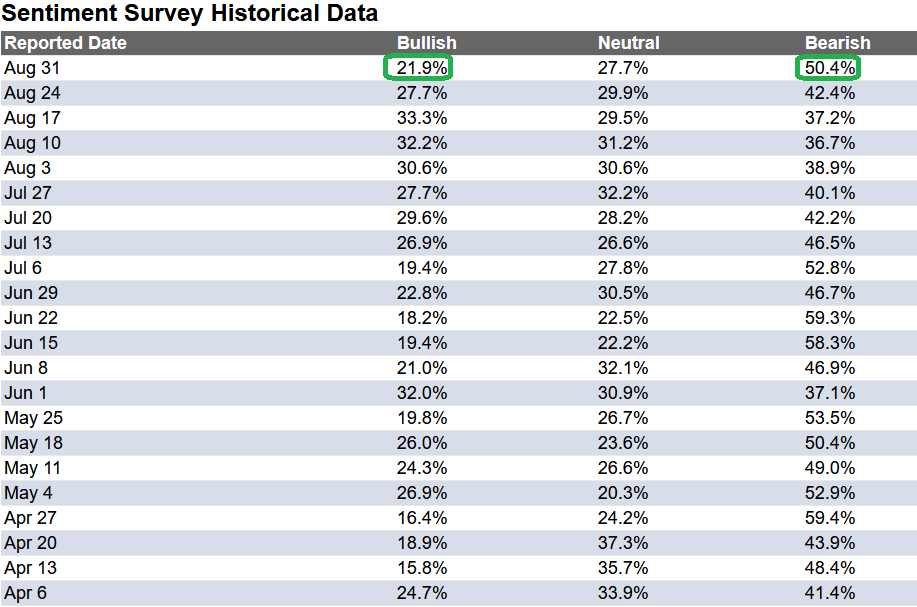
In this last week’s AAII Sentiment Survey result, Bullish Percent (Video Explanation) dropped to 21.9% from 27.7% the previous week. Bearish Percent jumped to 50.4% from 42.4%. Retail investors’ fear is nearing June low levels again.

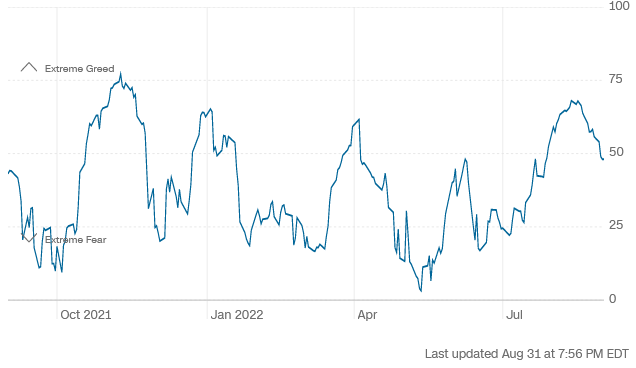
The CNN “Fear and Greed” ticked up from 46 last week to 48 this week. Sentiment is in “no man’s land!” You can learn how this indicator is calculated and how it works here: (Video Explanation)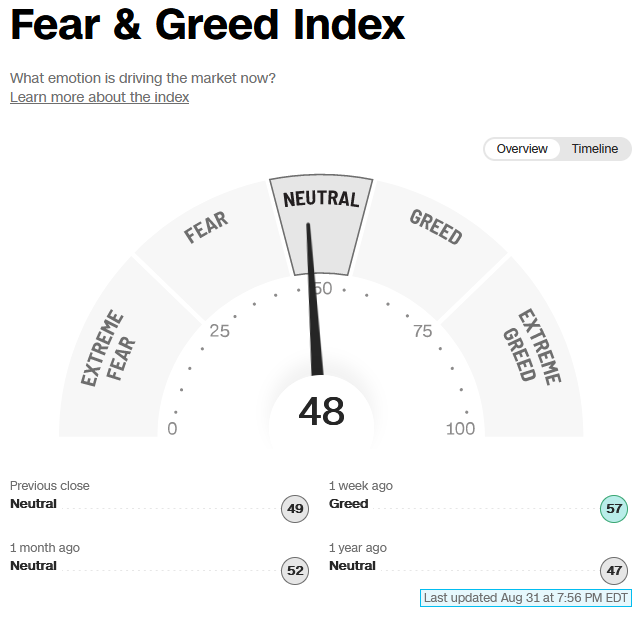
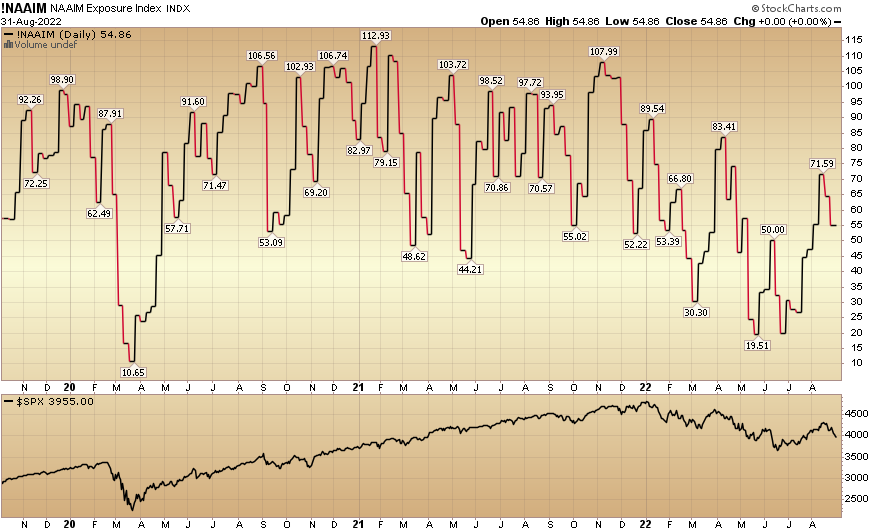
 And finally, the NAAIM (National Association of Active Investment Managers Index) (Video Explanation) dropped to 54.86% this week from 64.44% equity exposure last week. The late chasers from early this month are getting shaken out JUST LIKE MAY OF 2020:
Our podcast|videocast will be out today or tomorrow. Each week, we have a segment called “Ask Me Anything (AMA)” where we answer questions sent in by our audience. If you have a question for this week’s episode, please send it in at the contact form here.


