This week we chose AC/DC’s “Back in Black” as our theme song for the Stock Market. Of the major indices, so far the Nasdaq is the first one to make it out of the Red and Back in Black:
Dec 31, 2019 closing prices:
S&P 500 3,230.78. % needed to Positive ytd: 1.91%
DOW 28,538.44. % needed to Positive ytd: 9.47%
Nasdaq 8,972.60. % already Positive ytd: up +16.93% ytd
Russell 2000 1,668.47. % needed to Positive ytd: 17.24%
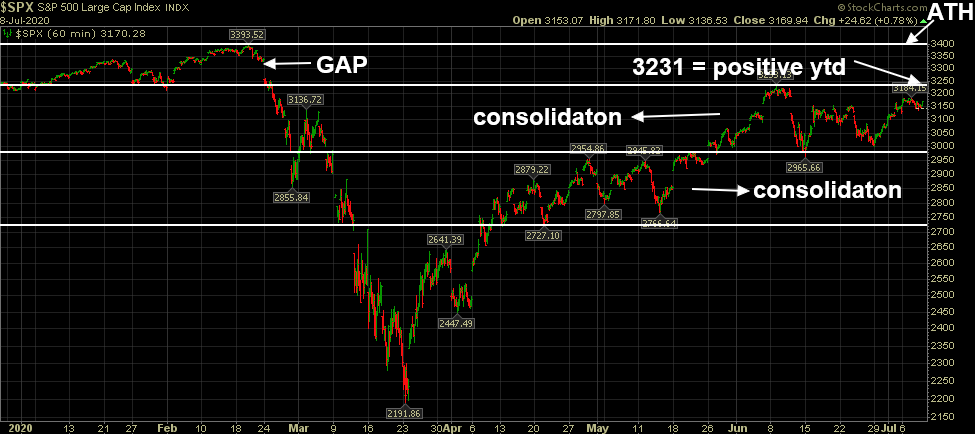
As we saw last month, the S&P rejected at ytd (year to date) highs and instead created a new consolidation box. It is unclear how long we stay in the box before turning positive on the year and/or approaching all time highs, but new case/death count and earnings guidance are going to have a lot to do with it in the next few weeks.
As for the lyrics to describe this year’s recovery to date:
Forget the hearse ’cause I never die
I got nine lives
Cat’s eyes
Abusin’ every one of them and running wild
‘Cause I’m back
Yes, I’m back
Well, I’m back
Yes, I’m back
Well, I’m back, back
Well, I’m back in black
Yes, I’m back in black
This week I was on Fox Business’ “The Claman Countdown” discussing the key reason for the stock market’s continued recovery. Thanks to Ellie Terrett, Cheryl Casone and Liz Claman for having me on:
Since this segment on Monday, the Citi “Economic Surprise Index” I referenced has hit yet another all-time record:
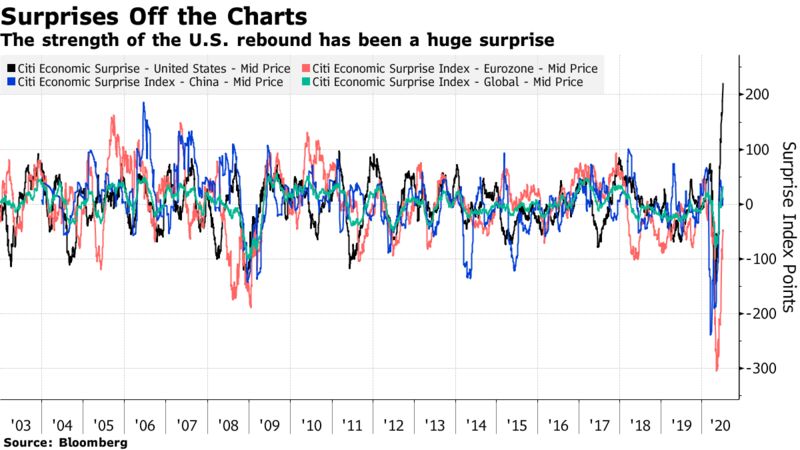
The economic surprise index measures how well economic data come in relative to consensus expectations. As you can see above, the data has been beating expectations by a record amount.
More “Better Than Expected” Data From This Week
China’s service-sector activity is expanding at the fastest pace in a decade.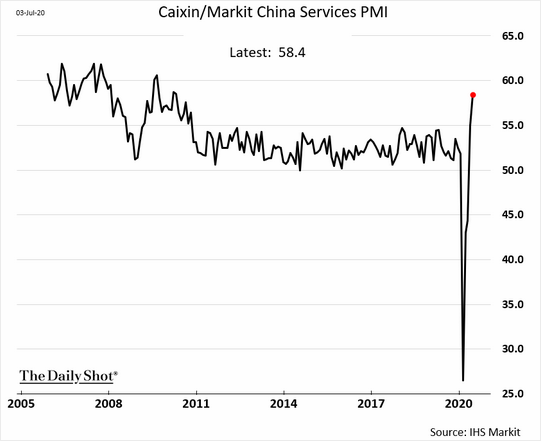 US ISM non-manufacturing report showed business activity returning to growth last month (PMI > 50).
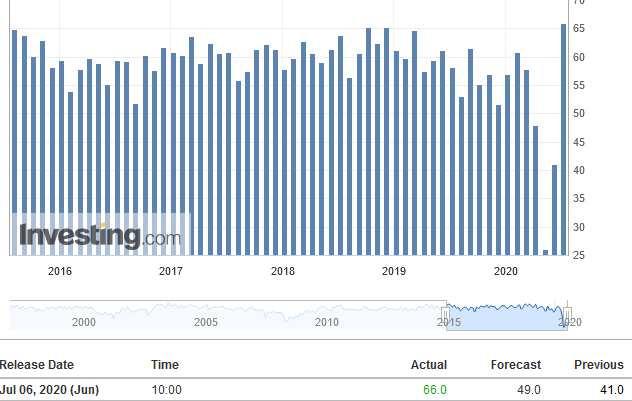
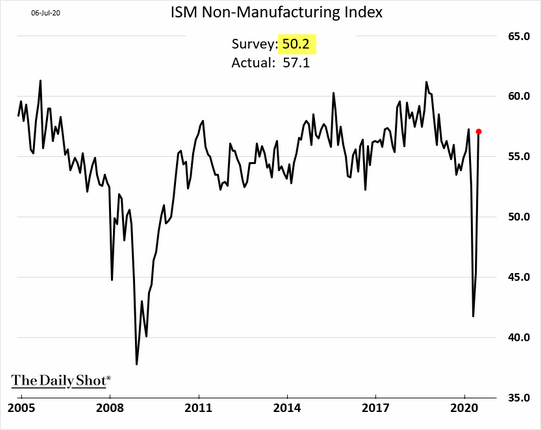 U.S. ISM Non-Manufacturing Business Activity
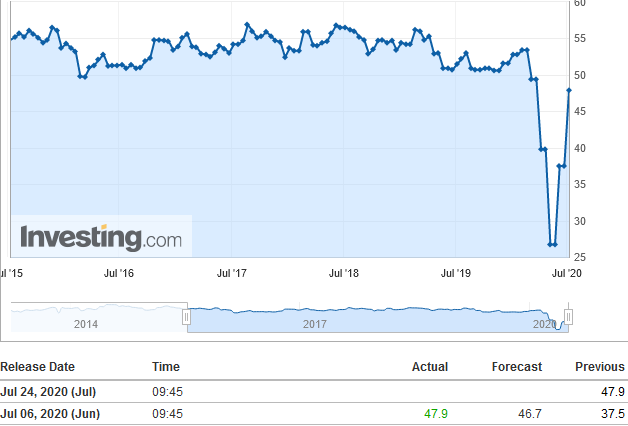
U.S. Services Purchasing Managers Index (PMI)
U.S. JOLTs Job Openings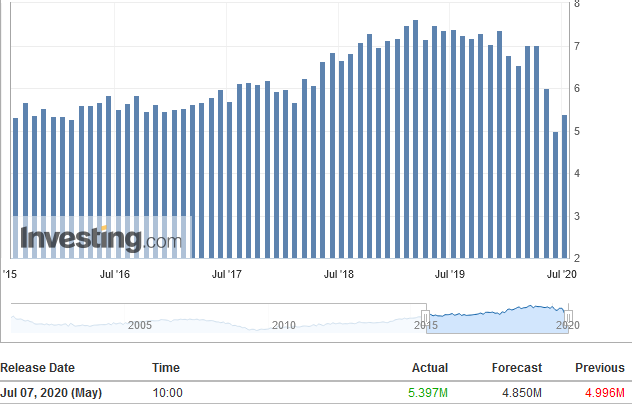
As I said in the segment above, analysts are now starting to anticipate that the “better than expected” economic data will flow through to Q2 earnings and even more importantly – forward guidance. We’ll know more, starting with Banks, next week.
Did Someone Say, “Banks?”
Speaking of banks, last week we put out some thoughts on Wells Fargo’s imminent dividend cut which will be announced on July 14. The case we made was that the last time they cut the dividend (March 6, 2009), the stock rallied over 250% in the next 2 months (trading back up to book value). It was a clear case of “sell the rumor, buy the news.” You can review that note here:
This week we came across an interview that Warren Buffett did regarding Wells Fargo in 2009 (right around time of the dividend cut). Wells Fargo is still one of Buffett’s top 5 holdings and you could effectively copy and paste his sentiment from the 2009 crisis to today:
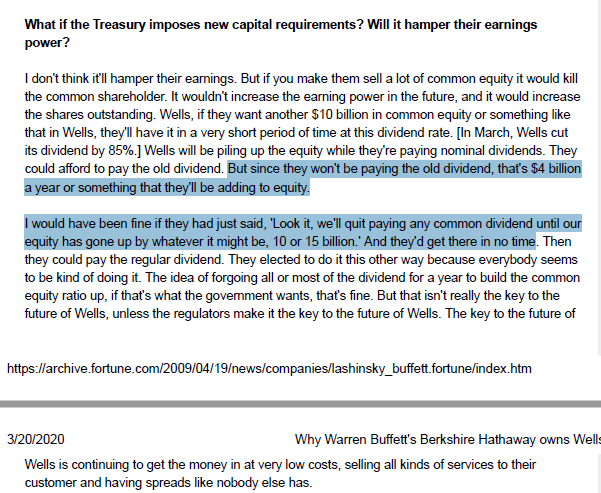
As I said on the podcast/VideoCast last week, the Fed capped what they could distribute/pay out in dividends in the short term. The Fed did not cap what Wells Fargo could EARN! In effect, it makes no difference whether they pay out now or later, as what they retain will build up shareholder value/intrinsic value. You can find it here:
As Buffett says above, “if you make them sell a lot of common equity it would kill the common shareholder.” Since that is not even on the table, this cut will benefit shareholder equity in the short term as earnings are retained. After the “bad news” is out, we will see how long it takes to trade back up to book value (currently ~$40).
I mentioned in my notes on the cut (above) that there was an expectation the dividend would cut to $.20 from $.51. That would save almost $5.1B per year that would retain in the company (as increased equity value) for current shareholders – until payout at a later date.
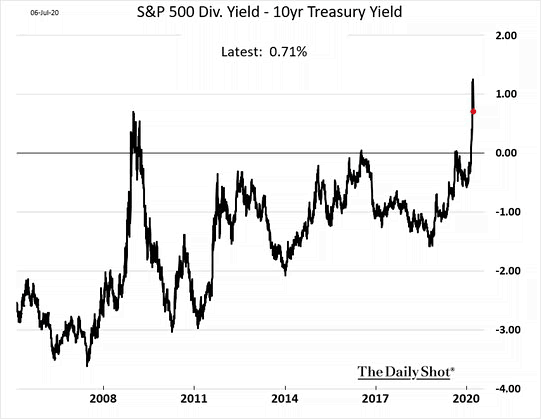
Even if they do cut to this level, a 3.2% yield at current levels dwarfs the 10yr Treasury yield of ~.65% (almost 5x). Did I mention it’s trading at ~38% discount to book (and would have to appreciate ~63%) just to trade back at book value?
Just as they overshoot on the downside, banks tend to trade at a multiple to book when they overshoot to the upside as well. As recently as two years ago, Wells Fargo traded at a 75% PREMIUM to book value. That will happen again, we just don’t know when. Trading back to book is a higher probability in a reasonable time-frame in our view (once the “bad news” is out).
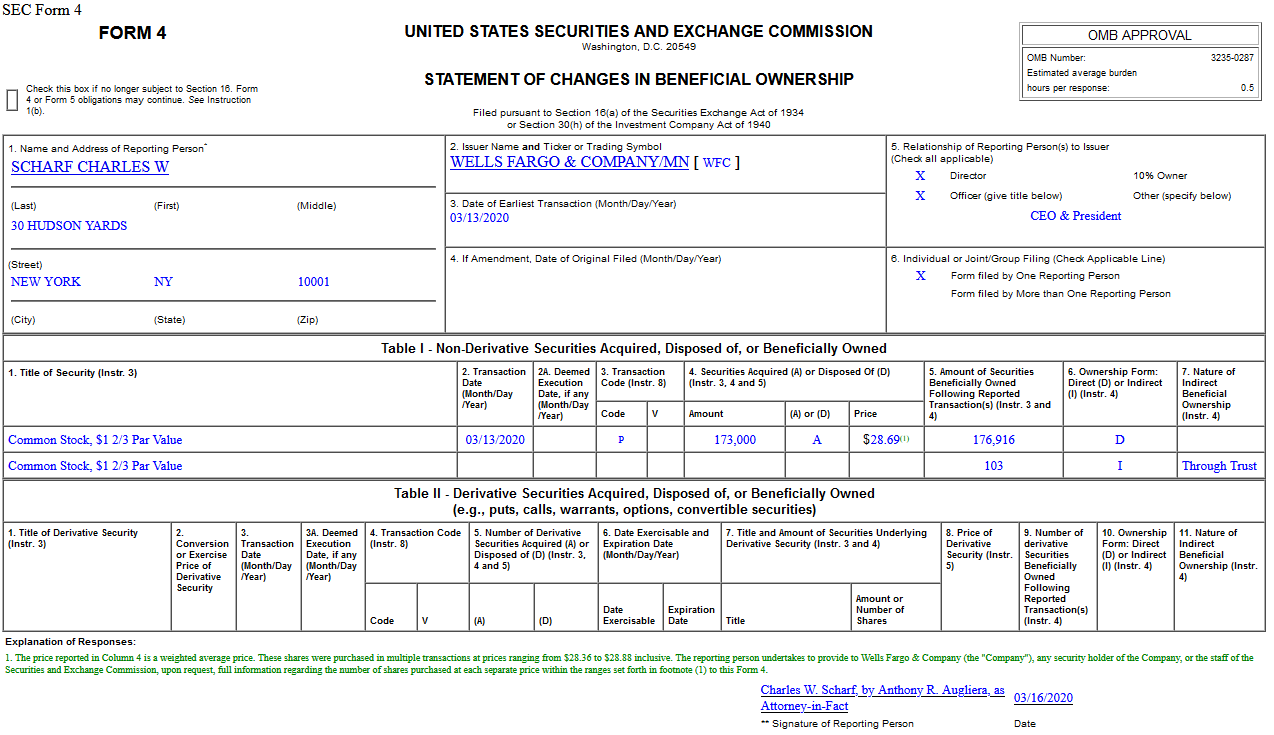
I also like the fact that we own and will continue to add the stock (WFC) below the price that the new CEO – Charlie Scharf backed up the truck and bought ~$5,000,000 worth at $28.69 during the crash in March. Our interests are well aligned with the captain of the ship.
Slower Recovery = Tech/Growth. Faster Recovery = Cyclicals/Value
Tech valuations are supported at the moment because the market is discounting slow growth/bumpy recovery. The minute something changes with a solid COVID treatment or vaccine, the market will favor cyclicals – as it always does coming out of recessions.
Cylcicals/Value will move ahead as the relative out-performer – putting Tech/Growth in the back seat on a relative basis. That shift will be a function of the virus containment/treatment/vaccine (similar to last month before the Sunbelt case spike). The amount of global stimulus/liquidity/aid is unprecedented and will lead to growth like we have not seen in decades ONCE the virus is contained and DEMAND returns.
The last time the S&P 500 dividend yield exceeded the 10yr yield by this magnitude was 2009 – when banks/cyclicals outperformed in the initial stages of recovery – coming out of the 2008 recession:
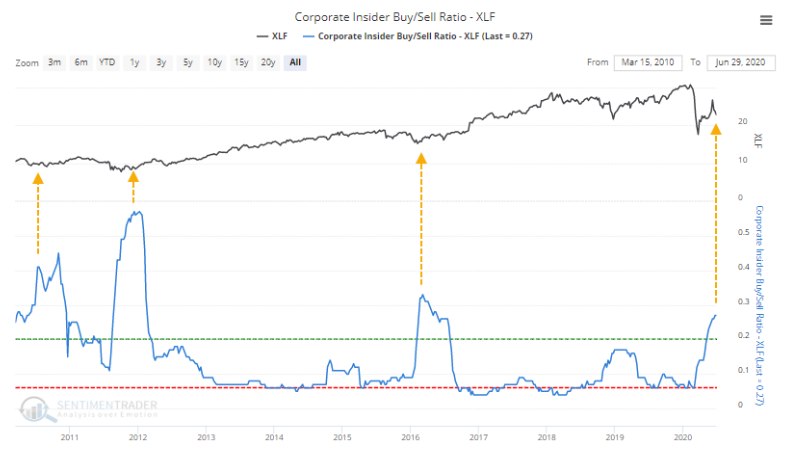
We are also seeing predictive indicators as insiders begin to get ahead of the curve on this rotation. The chart below from Sentiment Trader shows insider buying in Financials and its historical implications moving forward:
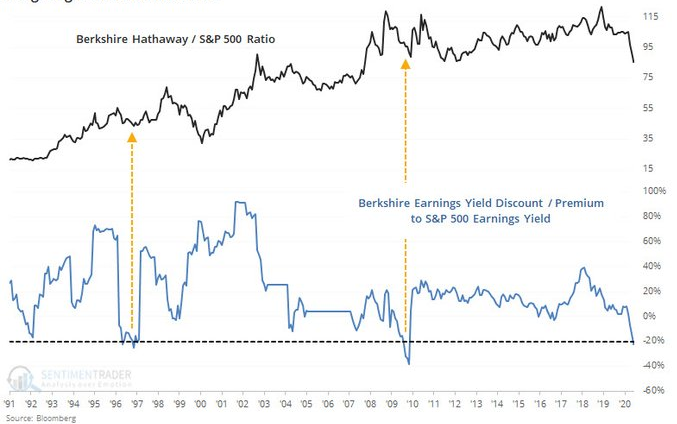
Here’s another chart from sentiment trader that shows Berkshire Hathaway inflection points. It has an historic tendency to revert to the mean (start to outperform S&P 500) after getting to this level of disequilibrium:
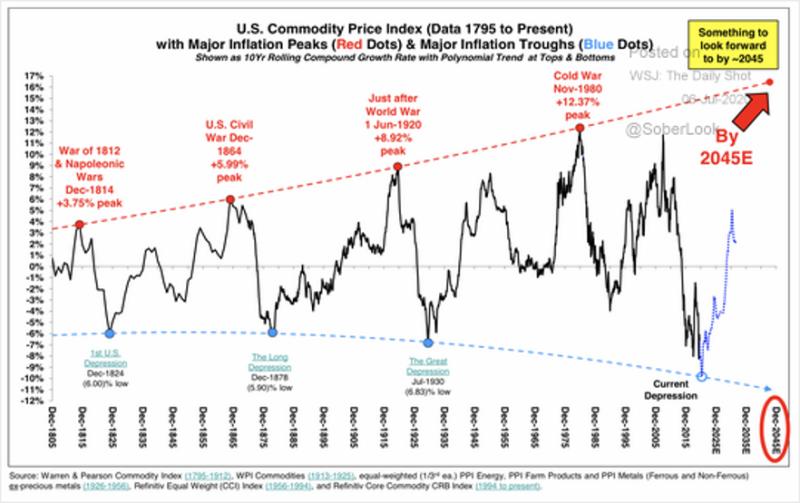
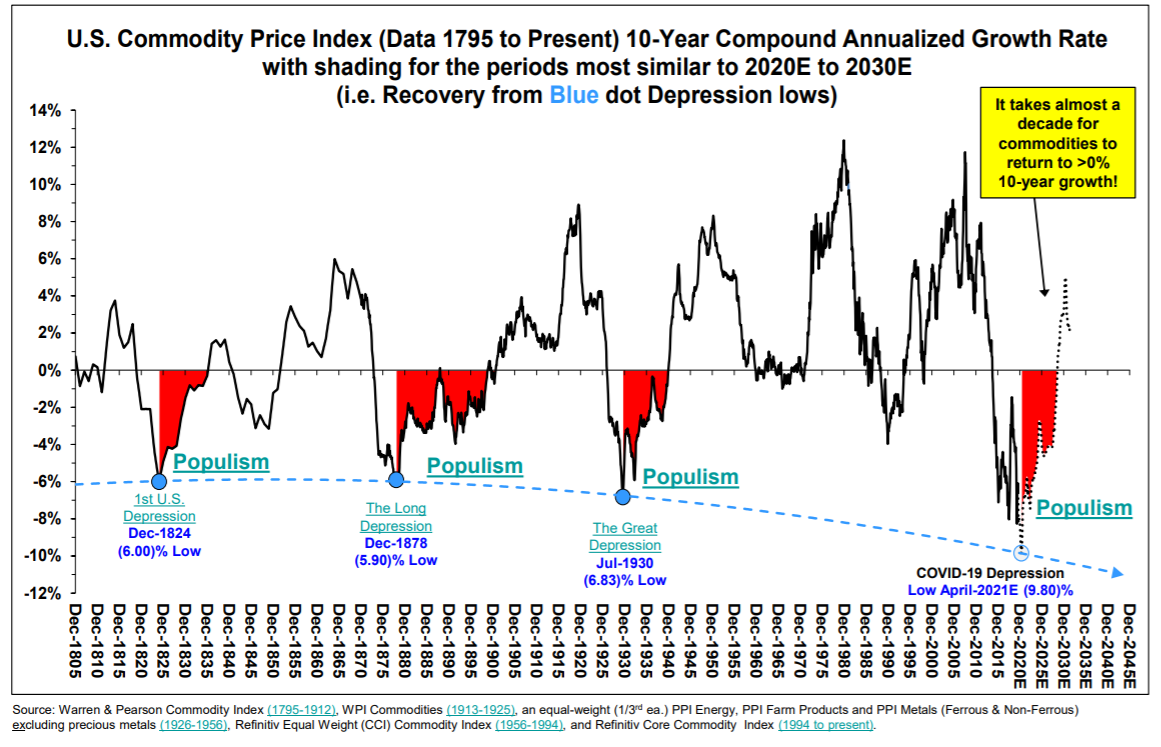
And finally, the best indicator of the cyclical trade post-recession recovery is demand for commodities. These two charts show where we are in the commodity cycle and its potential implications (Source: Barry Bannister, head of institutional equity strategy at Stifel):
The 2 Risks To “Breaking Through”
Risk 1:
The key risk that lies in breaking through this range and turning positive ytd on the S&P 500 lies in a second wave of coronavirus.
While we have seen major spikes in the Sunbelt in the past couple of weeks, we are seeing cases in the Northeast (U.S. epicenter) plummet. It is more likely that the “first wave” has migrated than the beginning of a “second wave.” Here are the latest stats – which currently imply that the “hot spots” are beginning to come off the boil (as I mentioned on Fox Business this week). All data from USAFacts.org:
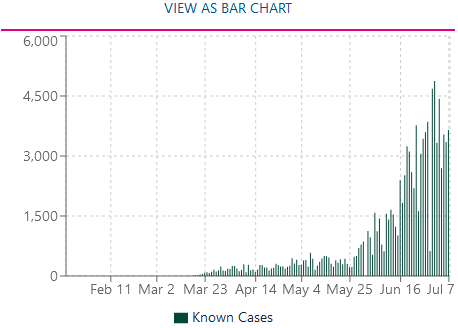
Alabama Cases:
July 3: 1,754
July 7: 907
Arizona Cases:
July 1: 4,877
July 7: 3,653
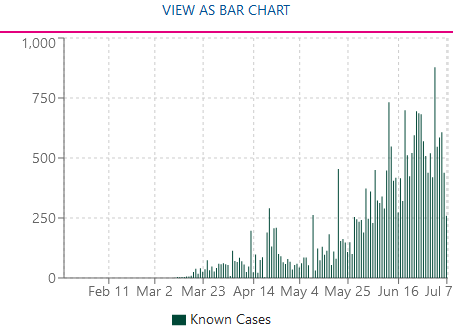
Arkansas Cases:
July 2: 878
July 7: 259
California Cases:
July 6: 17,125
July 7: 10,428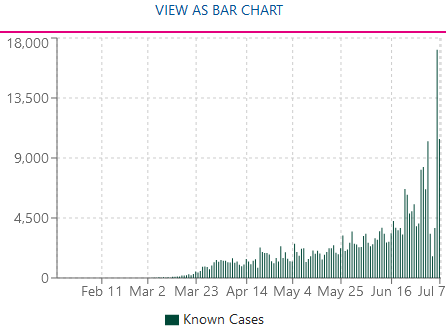
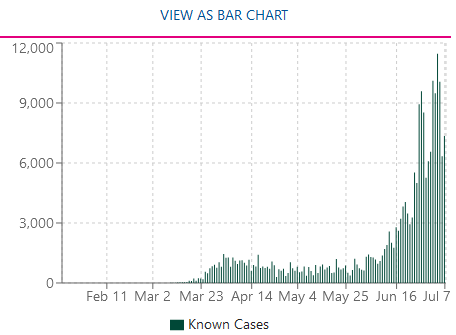
Florida Cases:
July 4: 11,458
July 7: 7,347
Georgia Cases:
July 2: 3,514
July 7: 3,392
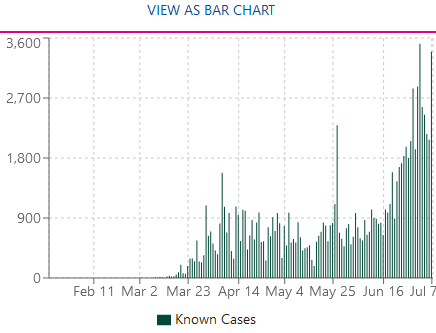
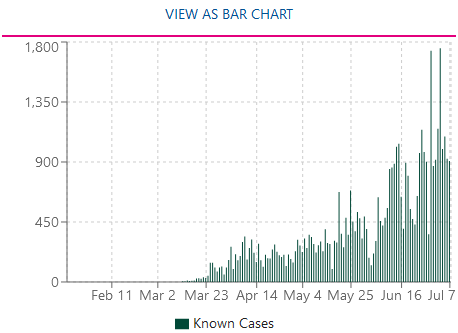
Texas Cases (still a problem – but mask law went into effect this week – so numbers should improve):
July 4: 8,253
July 7: 10,028
HERE IS WHAT IS HAPPENING IN THE “EPICENTER STATES” THAT WERE HARDEST HIT AND HAVE SINCE FOLLOWED THE “HOLY TRINITY” (Masks, Distancing, Hygiene):
New York Cases:
April 3: 13,262
July 7: 249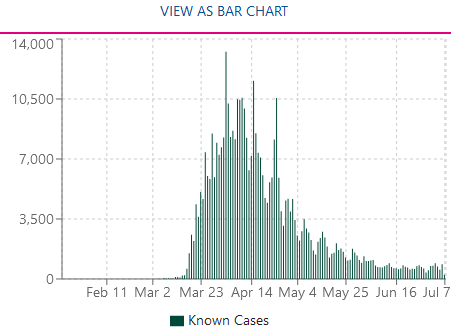
New Jersey Cases:
April 4: 5,102
July 7: 267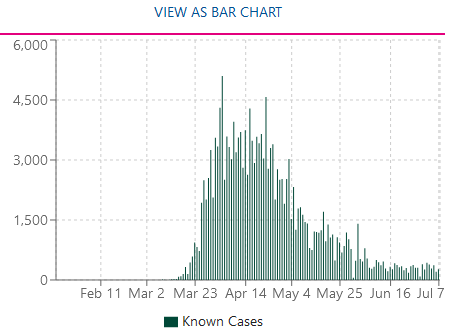
Connecticut Cases:
April 22: 2,109
July 7: 57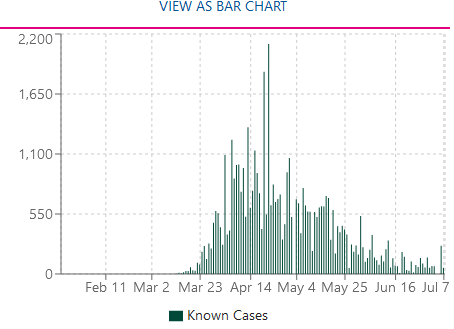
When the Sunbelt implements the same strategies that we have in the epicenter (Tri-State area), they will see the same results. We are slowly seeing local governments step up and take the right actions after their spikes (just as we did several months ago).
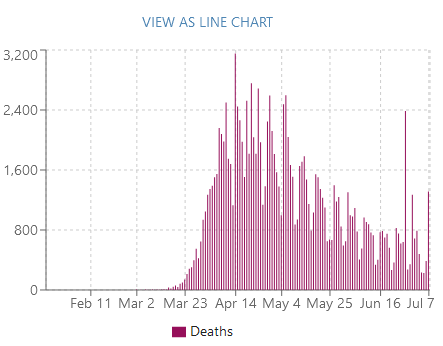
Despite the short term spike of cases in the Sunbelt (which is starting to subside), deaths have dropped due to three factors:
- Average age of patients has dropped considerably.
- Treatments/Experience/Knowledge has improved.
- Testing has skyrocketed since April so many asymptomatic cases may not have been counted in previous months.
 Risk 2:
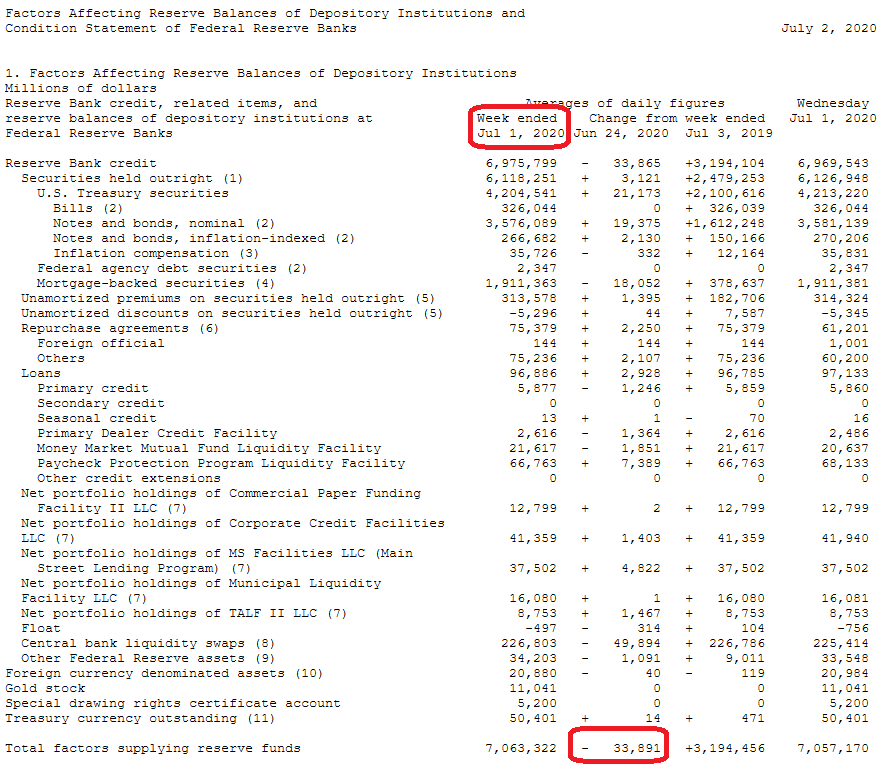
While Chairman Powell has done a masterful job of saving the economy from the abyss (along with Secretary Mnuchin, Larry Kudlow and the Administration), I am concerned that he will tap the brakes too soon. In the last two weeks he has reduced the Fed Balance Sheet by ~$70B. This data has not been updated since July 1, but the simple question is, “why would you even consider lightening up – even a hint – with unemployment at 11.1% and limited inflation?”
This sound bite from a NY Fed member is EXACTLY what could ruin the progress that has been made:
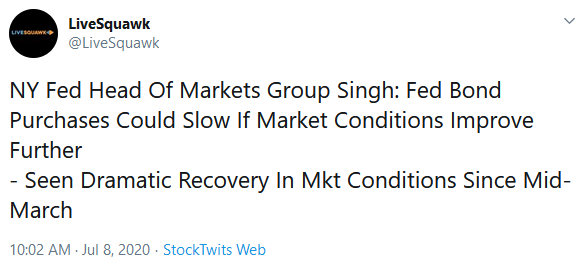
I have warned in recent weeks’ podcasts/VideoCasts that Chairman Powell intellectually knows the risks to the most vulnerable (structurally unemployed) as he frequently mentions it in his pressers. Yet, he continues to potentially repeat the same mistake he made in 2018 for a second time.
This is not the time to let up, it’s the time to DOUBLE DOWN. Take the momentum we have built since March and press it until we see 7% unemployment (or lower) and consistent inflation of 2.5-3% for multiple months before you start to think about tightening. Why are you doing this now?
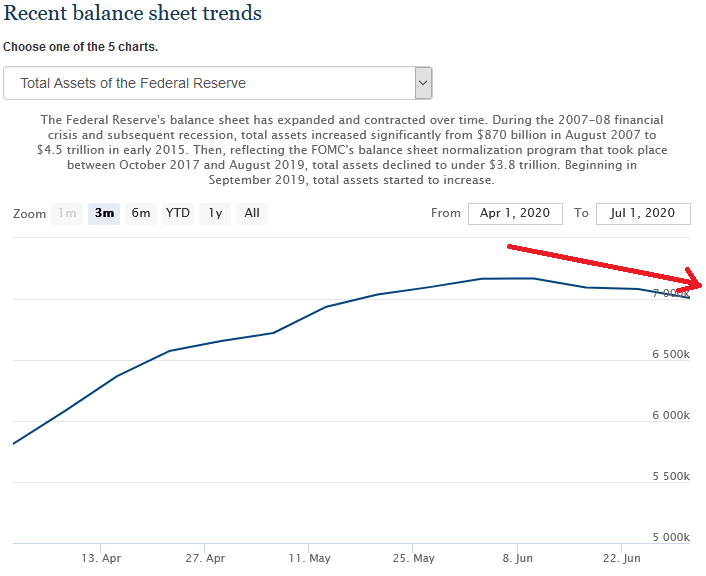
We will see this week’s balance sheet numbers soon (may be a day off due to the Holiday), but hopefully he has reversed this multi-week downtrend:
While we have made new highs in the Nasdaq, it is essential for sentiment (consumer confidence – spending) and (business confidence – hiring) that we make new highs in the S&P 500 and Dow to take the “double dip” narrative off the table.
Sentiment is fragile and one false move by Chairman Powell (failing to capitalize on the amazing momentum he has helped to create since March) could put the markets/economy in a precarious position before we get the vaccine. “Pedal to the metal” needs to be the message of the moment until the (inflation/employment – dual mandate) DATA tells you to slow down.
Chairman Powell has the opportunity to be a hero to the millions of people still unemployed. We’ll see if he takes this opportunity and finishes the last 20% of the job or if he quits/lets up before the finish line. Millions are counting on him…
Now onto the shorter term view for the General Market:
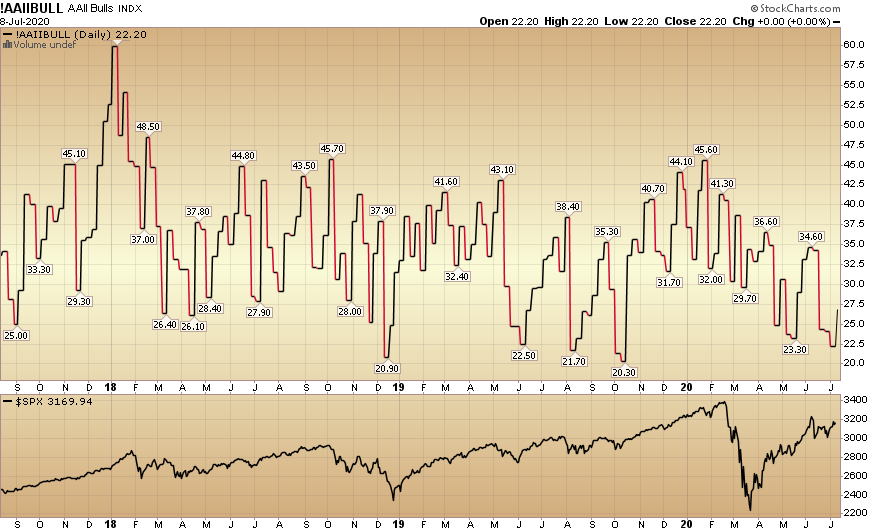
In this week’s AAII Sentiment Survey result, Bullish Percent (Video Explanation) finally rose to 27.15% from 22.15% last week. Bearish Percent slid to 42.67% from 45.89% last week. These are levels that historically still favor being a buyer versus a seller. It is nice to finally see the extreme pessimism/skepticism of recent weeks beginning to thaw, but we have a long way to go until we are anywhere near euphoric levels on this measure. Until then, we can climb the “wall of worry.”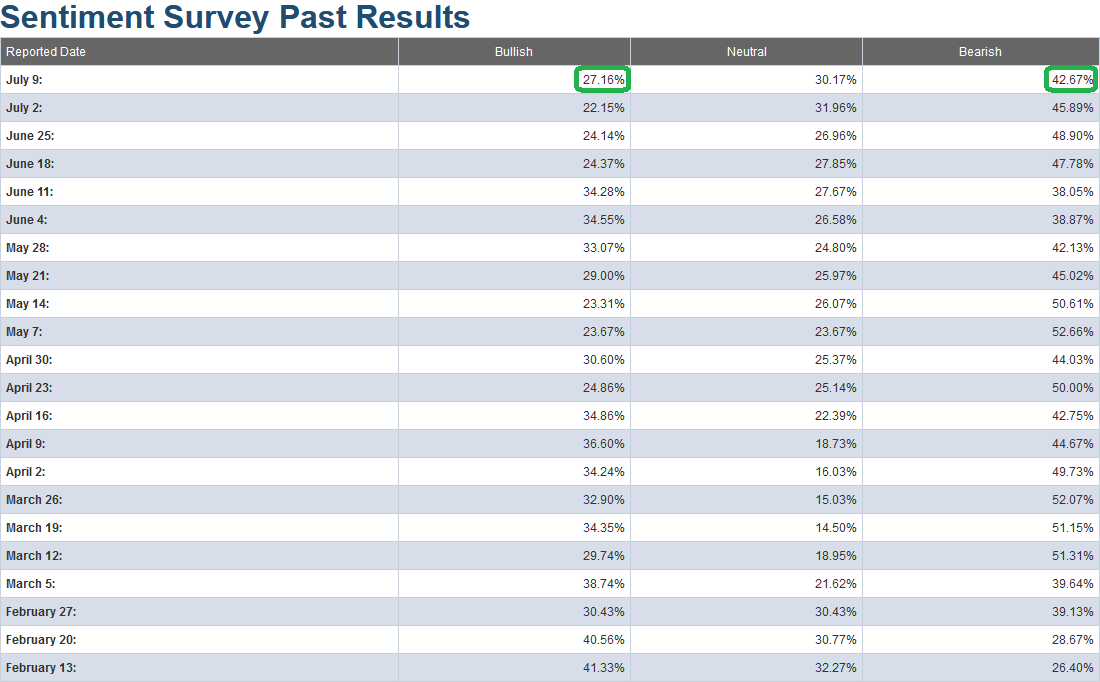
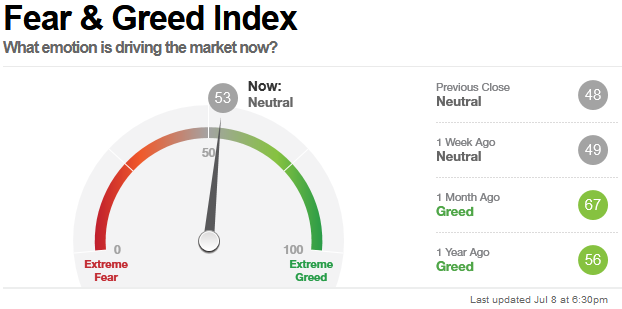
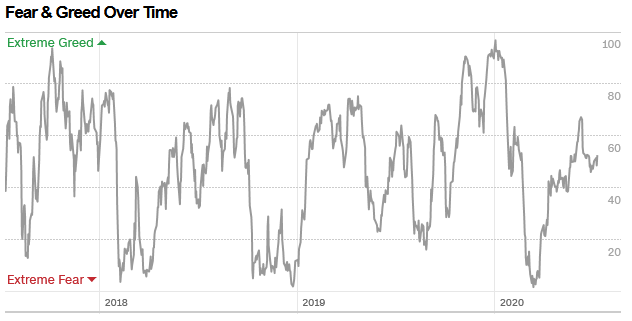
The CNN “Fear and Greed” Index ticked up modestly from 49 last week to 53 this week. Despite the market moving up ~40+% off the lows, we have still not hit anywhere near an extreme/euphoric level (>80/90) yet. You can learn how this indicator is calculated and how it works here: (Video Explanation)
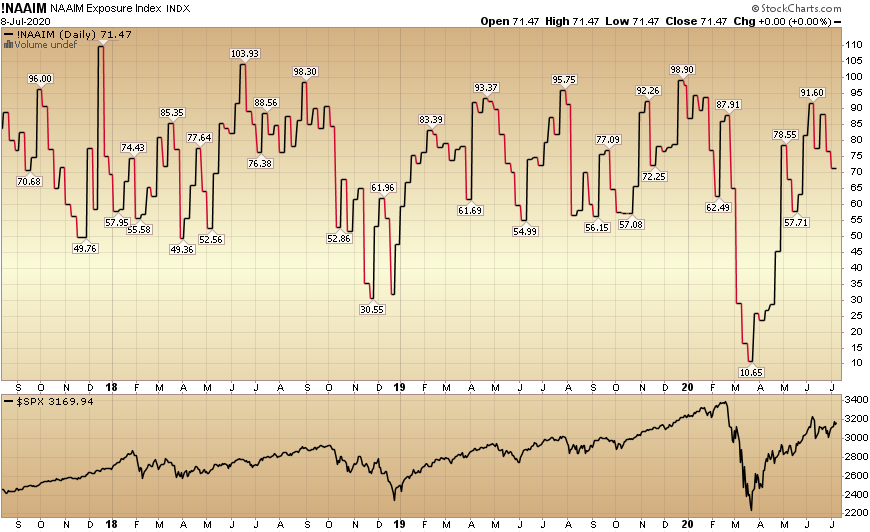
And finally, this week the NAAIM (National Association of Active Investment Managers Index) (Video Explanation) slid from 76.57% equity exposure last week, to 71.47% this week.
Our message for this week:
We remain very constructive in the intermediate term and will take advantage of any additional buying opportunities in laggard/cyclical names – should they arise over the Summer/Fall.
The three most important things we are watching in coming days/weeks to determine if the S&P 500 can push into the green for the year (or pull back in the Short-Term) are:
- New Cases
- Fed Balance Sheet
- Q2 Earnings Season – Forward Guidance (less bad than expected/low bar to step over)
In the interim we will hold what we have and shave only in the event we DO hit levels of euphoria that we have not seen since February.
Until then, it’s only a question of whether it takes weeks (or months) – based on the three factors above – when we’ll be able to sing along with AC/DC for the S&P 500:
Yes, I’m back in black…