

Our Stock Market theme song for this week is, “I Hope You’re Happy Now” by Country Star – Carly Pearce. The applicable lyrics we’ll dissect this week are as follows:
I said “I don’t love you” a little too late
But I guess there ain’t ever a right time
And I don’t know why it’s called a goodbye…
With the S&P 500 up ~48% trough (March 23) to peak (June 8), we’ve come very far, very fast (not the time to fall in love with the market – across the board). Considering we were aggressive buyers in late March and early April, it may be surprising to hear me throw out a whiff of short term caution, but hang tight. It’s nuanced and we’ll break it down.
While we can possibly push a bit higher in the short term just because so many managers are being forced in against their will (after having missed much of the rebound), there will come a time in the next few months that the “Johnny Come Latelies” will be singing the following song at a karaoke bar in Korea Town – with their Jr. Analysts at 2AM in the morning – wondering how they got there:
It’s all on me, it’s my mistake
I said “I don’t love you” a little too late…
In other words there will be a propensity to be last in, and first out (LIFO for the accountants following along!). Not only will it be the Robinhood retail traders who bought stocks of bankrupt companies in recent weeks:
But also the seasoned fund managers that missed most of the rally and are now subject to the “Swing You Bum” pressures of being in cash:
Warren Buffett puts it this way – “I call investing the greatest business in the world,” he says, “because you never have to swing. You stand at the plate, the pitcher throws you General Motors at 47! U.S. Steel at 39! and nobody calls a strike on you. There’s no penalty except opportunity lost. All day you wait for the pitch you like, then when the fielders are asleep, you step up and hit it.”
But pity the pros at the investment institutions. They’re the victims of impossible “performance” measurements. Says Buffett, continuing his baseball imagery, “It’s like Babe Ruth at bat with 50,000 fans and the club owner yelling, ‘Swing you bum!’ and some guy is trying to pitch him an intentional walk. They know if they don’t take a swing at the next pitch, the guy will say, “Turn in your uniform.”
Even those managers who don’t WANT to be in, now have been FORCED in. Because they are “late money,” the second the market pulls back a bit to consolidate the huge gains they will be sellers – or in industry parlance – “shake out the weak sisters before the next leg higher.”
However, those who bought quality – both retail and institutional investors – (when it was selling at 40-60% off in March/April), will not be phased by any mini pullbacks/consolidations (~3-9%) in coming months because they have a lower basis and have likely purchased at the beginning of the next cycle. Here’s what we said about WFC, JPM, RTX, etc. on Yahoo! Finance on April 1 – when the DOW was trading at ~20,900. It traded up to ~27,600 this week:
Now, if you missed it, there’s nothing to worry about. There will be tremendous opportunity to get your exposure and take advantage of what should be solid secular growth for years to come.
On Friday of last week and Tuesday of this week I was on Fox Business for the Claman Countdown. Thanks to Liz Claman and Ellie Terrett for having me on. In these segments I discussed which stocks/sectors historically outperform coming out of recessions.
2 Stocks we are in for the intermediate/long term (Friday):
5 Sectors/Sub-Sectors we are in for the intermediate/long term (Tuesday):
Wells Fargo fell yesterday on news from the CFO, that:
Reserves to protect against heightened risk of default will “be bigger than the first quarter,” John Shrewsberry told investors at a conference, citing historic unemployment and dire gross-domestic-product forecasts for the defensive move. The firm’s provisions spiked to $3.8 billion in the first quarter from $835 million in the year-ago period, leading earnings to slide 90%.
“The severity of the economic forecast is a big part of it, but we will be providing more in the second quarter to make sure that … we’ve got full coverage for the losses that we can imagine,” Shrewsberry said, according to a transcript provided by Sentieo. Source: Business Insider
Many of the bank stocks were down in concert with this guidance but also on the compression of rates in the face of Chair Powell’s commitment to to keep rates (short end of the curve) low until 2022.
Neither of these announcements were “news” but rather just an excuse to take a breather after a 54% move off the lows. As you can see below, the yield curve is still the steepest it has been since the last two bull markets in banks began in 2003 and 2009. The Green and Purple lines respectively are Wells Fargo and US Bancorp (2 stocks we bought in March/April).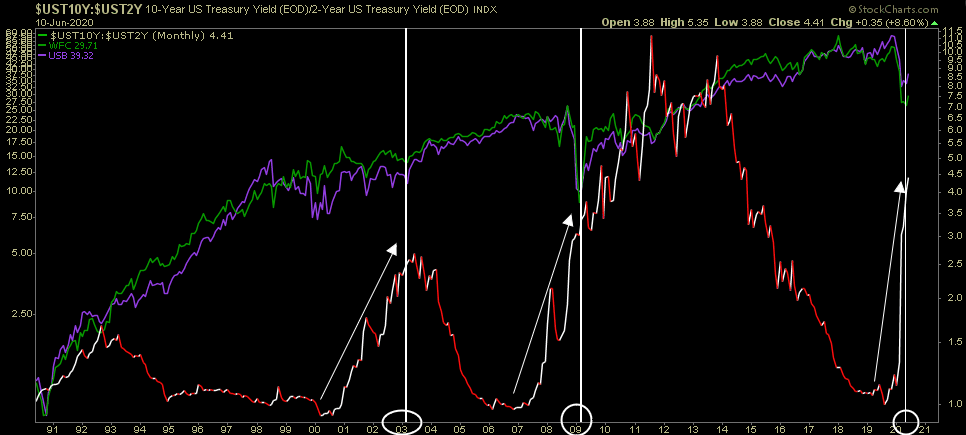
Although it’s hard to tell from the scale of this chart, here’s what happened the last two times the yield curve steepened this quickly:
In the 2003-2008 bull run for financials after the yield curve steepened (10yr yield:2yr yield):
Wells Fargo appreciated ~177%. US Bancorp appreciated ~216%.
In the 2009-2020 bull run for financials after the yield curve steepened (10yr yield:2yr yield):
Wells Fargo appreciated ~936%. US Bancorp appreciated ~853%.
Since few people buy the perfect bottom or sell the perfect top, cut the numbers in half and you’re still looking at a phenomenal secular opportunity in our view. If history is any teacher, you’re still getting in at/near the bottom. This is not advice just opinion (see “terms” above).
We are hopeful that we can get more pockets of weakness in the coming weeks to add to our bank positions for the long term. We don’t like buying up so we’ll be patient. If the opportunity does not arise, we’ll be happy with what we have.
Are We Just Getting Started?
On May 28, we posed this question as it relates to S&P 500 stocks trading above their 200 DMA (Day Moving Average).
The Dua Lipa “Did a full 180” Stock Market (and Sentiment Results)…
The chart we posted was:
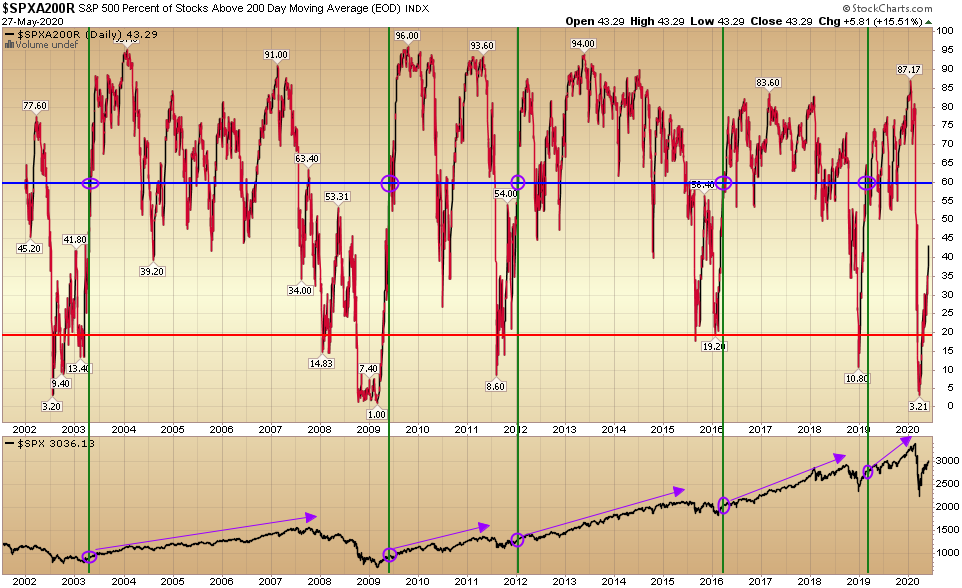
The text explaining the chart was:
“I decided to take a look at the long term data set and here’s what I found:
- There have been 6 “collapse periods” in the last 20 years – where less than 20% of S&P 500 components were trading above their 200 day moving averages (see red horizontal line above).
- While some periods bounced around in collapse territory for a while, once there was a “recovery” (which I am defining as more than 60% of S&P 500 components trading above their 200 DMA – see blue horizontal line above), it marked the beginning of a meaningful rally, not the end.
- The purple circles at the top and bottom of the chart mark those points when a recovery occurred (after 60% of S&P 500 components were above their 200 DMA – following a print below 20%).
- You can follow the purple arrows at the bottom to see what happened to the S&P 500 after that condition was met.
- In all cases the S&P 500 had already rebounded significantly after hitting the 60% mark – and yet – the rally in all cases WAS JUST BEGINNING.
- The condition that is not present yet is having met the 60% point – which means we could bounce around like in several previous instances – OR, it’s possible we blast straight up to the 60% mark as was the case in early 2019. Time will tell…”
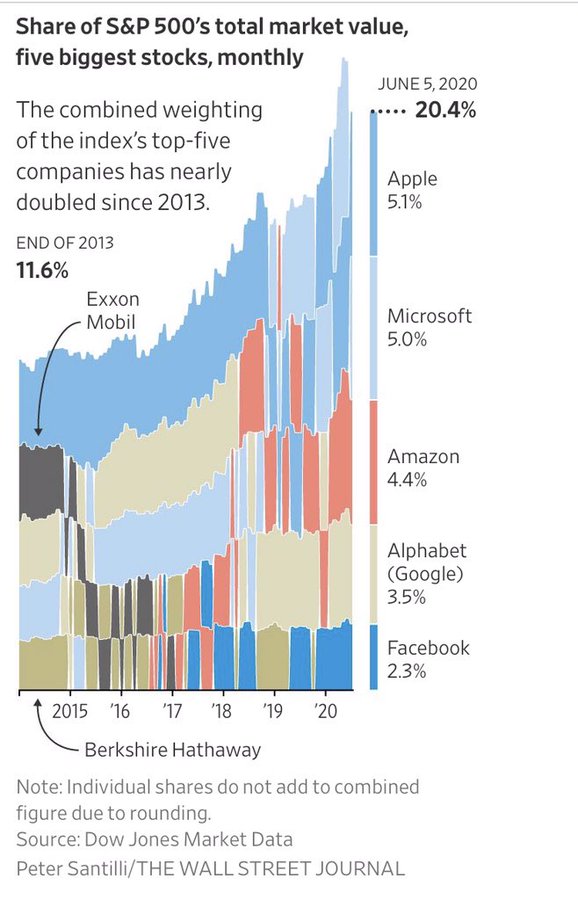
The last bullet is the most important because this week we met the condition we were looking for: Greater than 60% of S&P 500 stocks are now ABOVE their 200DMA AFTER having collapsed below 20% ABOVE their 200 DMA. The most important thing this is telling us is that the bounce is HEALTHY. Participation in this rally has broadened beyond the 5 top weighted stocks in the S&P 500 and spread to laggard cyclical/value sectors. Not only has the participation increased, but the concentration among the top 5 weights has fallen to healthier levels at the same time (off of the early 2020 concentration levels):
As you can see above we broke through the 60 level – hitting as high as 68.34% in the last week. In the last 5 instances – although we were up significantly off the lows at this level (and there was some near term consolidation), it was the BEGINNING of a new cycle/multi-year rally, not the end.
This is the key reason why you should not be worried if you missed the short term move. There will be opportunities in specific sectors/stocks in coming months – just as there were in early 2019, 2016, 2012, 2009 and 2003.
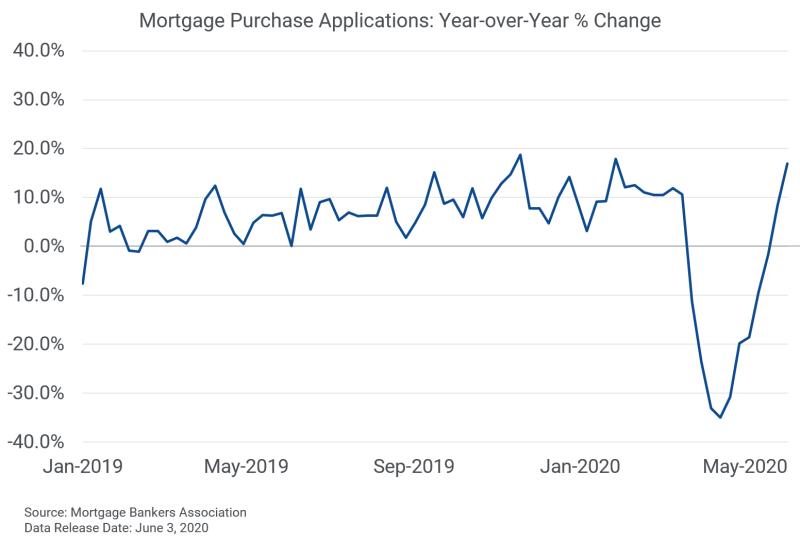
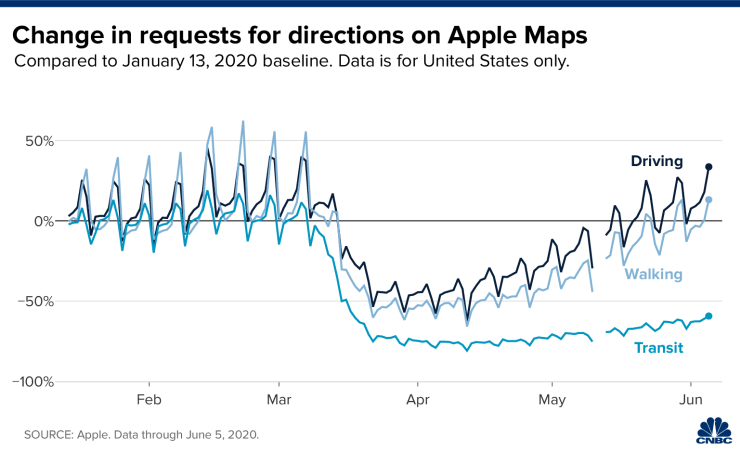
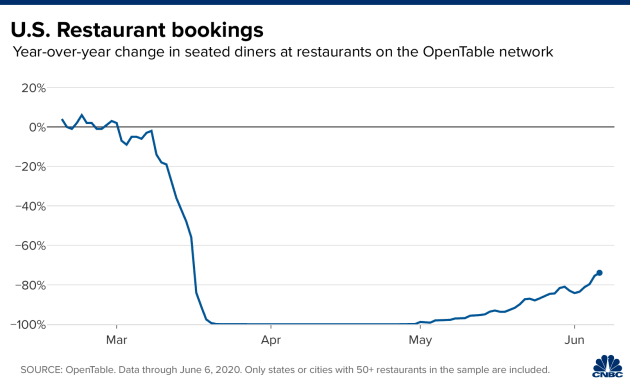
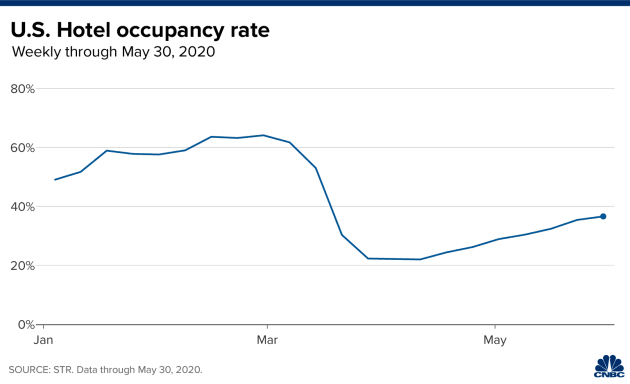
Continued Signs of Improvement
Sources listed directly on charts unless otherwise noted:
Fortunately, in MN where the protests began 15 days ago, we have not seen the spike in cases that was expected due to large crowds. If this positive data continues, it could potentially bode well for sports, travel and concerts in coming months:
Department of Health Minnesota
Now onto the shorter term view for the General Market:
In this week’s AAII Sentiment Survey result, Bullish Percent (Video Explanation) flatlined to 34.28% from 34.55% last week. Bearish Percent also flatlined to 38.08% from 38.87% last week. Fear is thawing for individual investors, but there are no signs of euphoria in these numbers at present.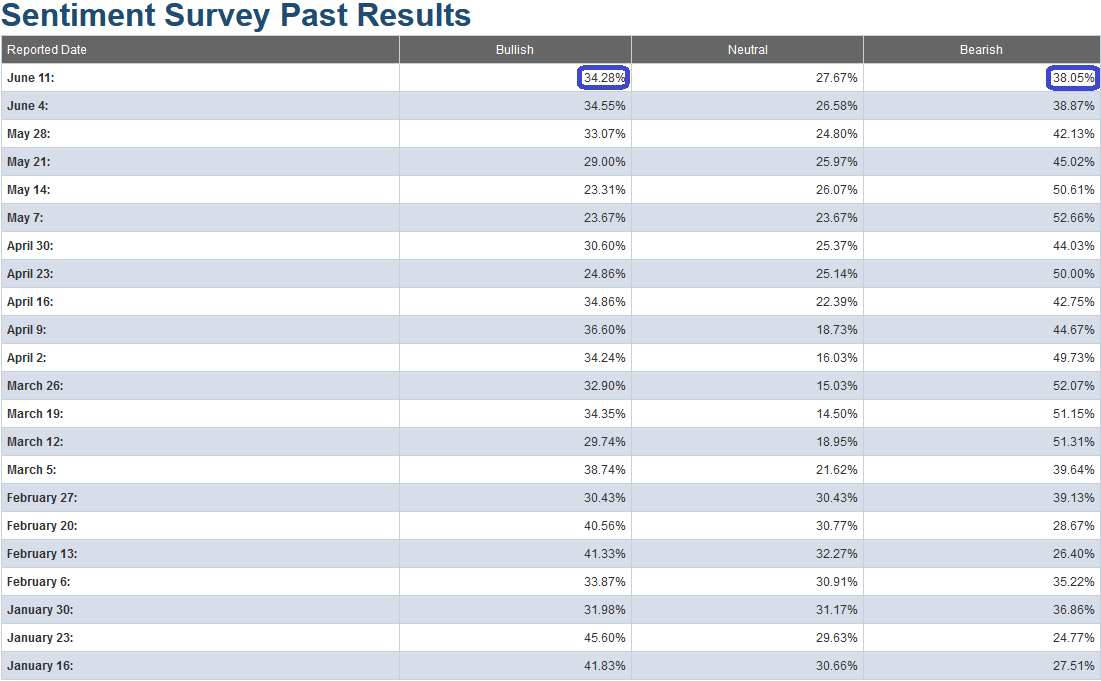
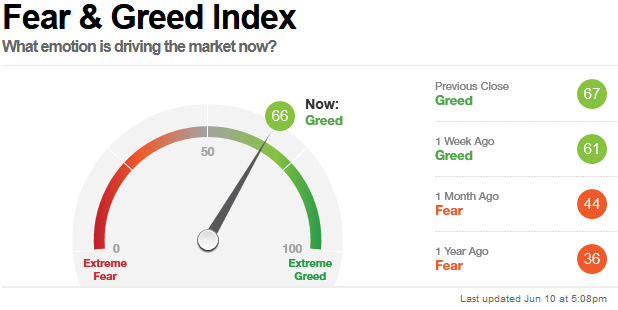
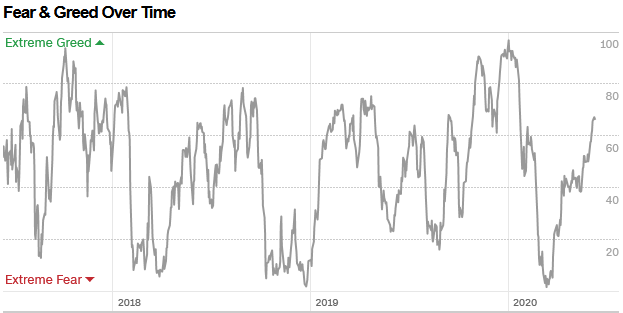
The CNN “Fear and Greed” Index ticked up from 61 last week to 66 this week. This is not at an extreme level yet. You can learn how this indicator is calculated and how it works here: (Video Explanation)
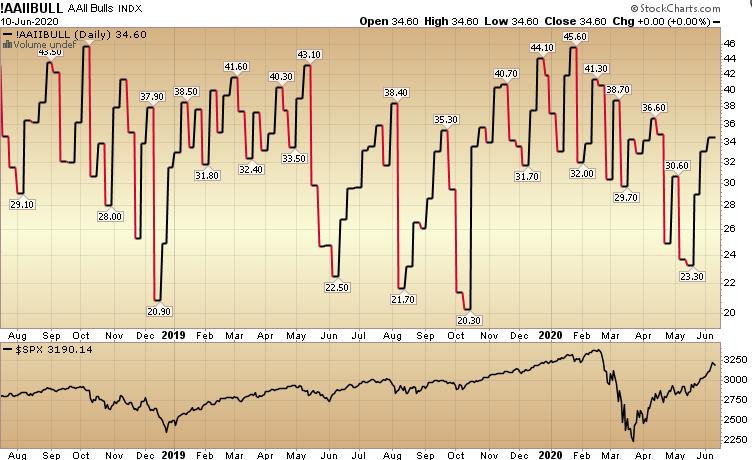
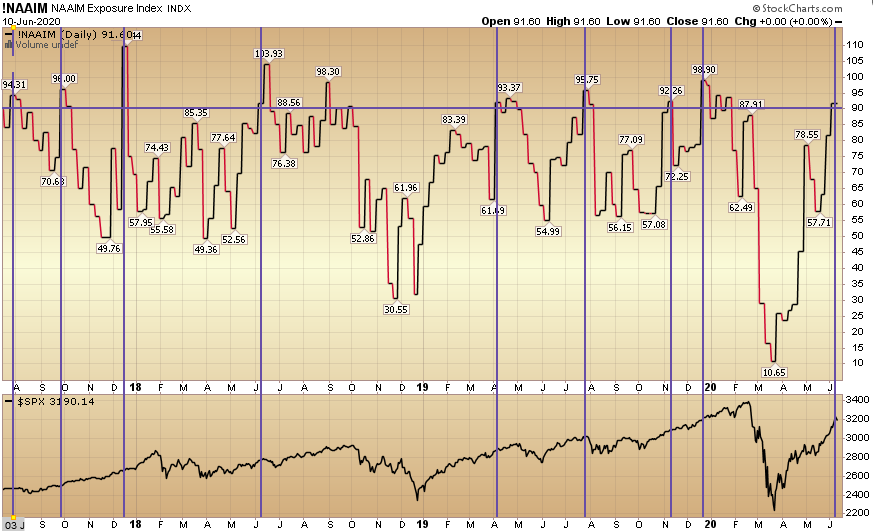
And finally, this week the NAAIM (National Association of Active Investment Managers Index) (Video Explanation) rose from 81.65% equity exposure last week, to 91.60% this week. Managers are chasing at these levels in a late effort to catch their benchmarks. While we are at an extreme level here, it does not necessarily mean we will correct right away. Looking at the chart below you can see that extreme can stay extreme for some time:
Our message for this week:
The most important thing I ever learned in this business is that when everyone is looking for a correction, you might not get one. Everyone looks at the same indicators – and they are overbought – for the most part. As I have made the case, we will likely get some mini pullbacks (3-9%) and sideways consolidation in coming months, but that does not mean we can’t push a bit higher first (despite being “overbought”).
We have had a monster run in the last ~11 weeks. For this rally to continue (already up ~48% off the lows) we will need to see this trend of broadening participation and partial rotation (from leaders to laggards that we discussed in previous weeks’ notes) PERSIST…
In the last couple of sessions we added a couple more shorts – in frothy pockets of the market – to hedge part of our equity exposure from mid-March to early April purchases (which we are holding for the long term). This is in addition to those we added last week (See my “Message For the Week” in last week’s note here). These names should perform even in the event of continued strength in the general indices.
In case we forgot to mention it REPEATEDLY for the last eight to eleven weeks: We still like Banks and are looking to add MORE if the opportunity presents itself.
We also like and own pockets of Defense Stocks, Home Builders, Energy, and Small Caps. It will not be a straight line up, but over the next 6-18 months we believe we will see relative strength in these groups. This will happen as demand kicks in (more people continue to return to work) and the (what will be) >$10T of stimulus/aid/liquidity starts to circulate in the economy (velocity picks up).
We may see growth levels by 1H 2021 that would not be possible if not for COVID-19 – as we would never have this level of global FISCAL (and monetary) policy at play.
Retail investors are still cautious – not yet at euphoric levels, but active managers tripped over each other to “panic buy” the rally in the past two weeks – which is why we added the small short term hedge in a handful names. We remain very constructive in the intermediate term and will take advantage of any additional buying opportunities in laggard/cyclical names – should they arise in coming weeks.


