
This week I had the pleasure of my 5 and 7 year old daughters treating me to view their “dance party.” As I listened to one of the songs on their playlist, I couldn’t help but make the connection to the Stock Market’s behavior since the March 23rd lows. Here’s how Dua Lipa put it in her song “Don’t Start Now”:
Did a full 180, crazy
Thinking ’bout the way I was
Did the heartbreak change me? Maybe
But look at where I ended up
I’m all good already
So moved on, it’s scary
I’m not where you left me at all, so…
The Kanye West, “Drive Slow” Stock Market (and Sentiment Results)…
In last week’s note, we re-emphasized the thesis with explicit focus on Banks, Defense Stocks, Home Builders, Small Caps and Energy. You can review it here:
The Grace Potter “Falling or Flying” Stock Market (and Sentiment Results)…
Now let’s take a look at what is happening:
As you can see above, the “most crowded trade” (tech/growth) according to the Bank of America Global Fund Managers Survey (May 2020), has had the worst performance off the lows (March 23):
S&P 500: ~36.41%
Tech/Growth (Nasdaq/QQQ): ~37.57%
Banks (KBE): ~45.77%
Small Caps (IWM): ~46.72%
Defense & Aerospace (ITA): ~46.82%
Energy (XLE): ~70.29%
Home Builders (XHB): ~75.95%
To review the BofA Survey Summary, go here:
May Bank of America Global Fund Manager Survey Results (Summary)
Factors Aiding the Recovery Trade:
- New Cases and Deaths declining:
 (source) worldometers.info
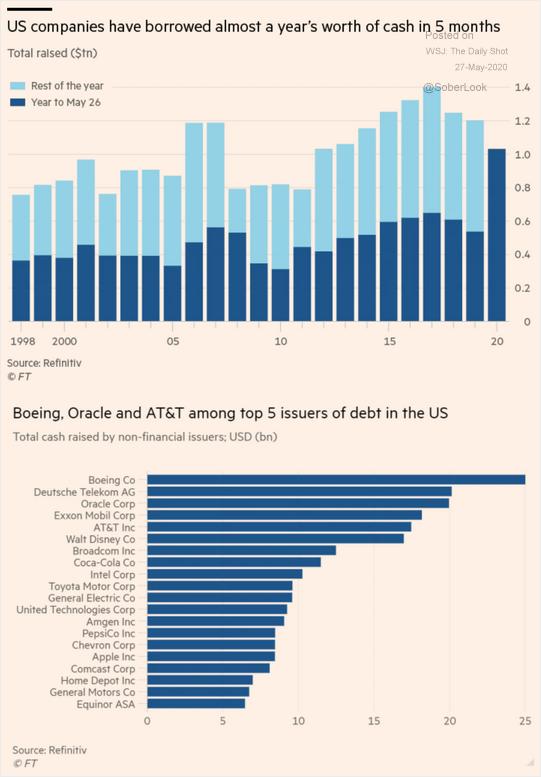
 - Corporate Balance Sheets Recapitalized:
3. Global Fiscal Stimulus (>12% of global GDP):
The total was about $9 trillion as of May 20 (this figure excludes the 750B Euro package just authorized yesterday for Europe as well as another $1.1T in Japan that the cabinet approved yesterday and parliament is expected to pass it before June 17). This takes the running total to ~$11T and likely another $1T+ coming soon in the next US package. The breakdown looks like this: direct budget support is currently estimated at $4.4 trillion globally, and additional public sector loans and equity injections, guarantees, and other quasi-fiscal operations (such as non-commercial activity of public corporations) amount to another $4.6 trillion.
4. Global Monetary Expansion (Fed, BoJ, ECB) Source – AEI.org:
“Before the 2008 financial crisis, the Fed held $890 billion in assets. With its COVID-19 stimulus programs, the Fed’s assets could grow to $10 trillion, approaching 50% of US GDP.
The BOJ and Japanese government aggressively responded to the COVID-19 pandemic. The BOJ doubled its purchases of exchange-traded funds to $112 billion. It coordinated dollar swap lines with the Federal Reserve to lower the dollar borrowing costs of Japanese companies, established a special no-interest lending facility, and substantially increased its purchases of commercial paper and corporate bonds. In conjunction with BOJ efforts, the government announced an economic stimulus package equal to 20 percent of GDP — including low interest loan programs for large businesses and loans as well as guarantees and cash assistance for small and medium size enterprises. With these programs in place, the BOJ’s asset holding will be well in excess of Japan’s GDP.
The ECB has acted less aggressively than the Fed and BOJ, but it has still initiated a large ($820 billion) government bond purchase program to control the borrowing costs of high-deficit member countries hard hit by the pandemic. Internal ECB discussions indicate that the ECB may expand this bond purchase program, but because its charter prohibits direct funding of member governments’ deficits, the ECB’s policy options may be more limited than those available to the Fed and BOJ.”
5. Consumer Balance Sheet is Strong:
Consumers came into the Corona Crisis with a strong and repaired balance sheet. Personal savings as a percent of disposable income is up almost 300% since its low point in 2005: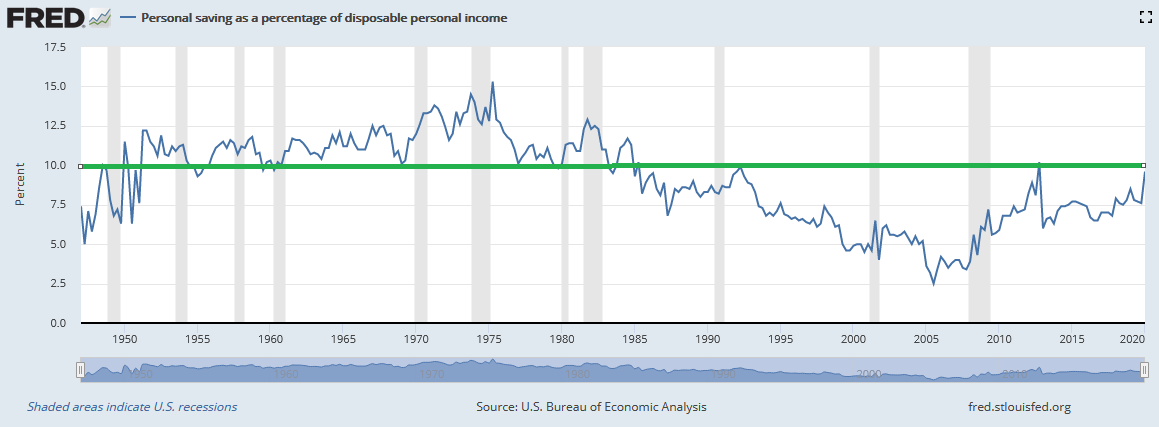
Are We Just Getting Started?
 I was updating some of my free “market indicator” videos this week and I came across the S&P 500 Percent of Stocks above their 200 Day Moving Average (you can view them all here).
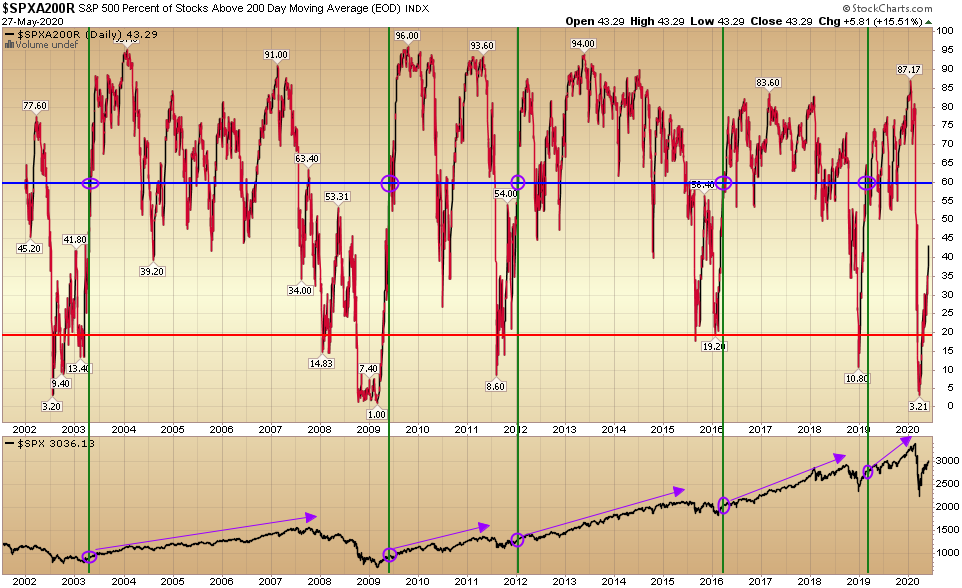
I was surprised to see that after an almost ~37% rally in the S&P 500 off the March 23rd lows, only 43.29% of the S&P 500 components are trading above their 200 Day moving averages.
So I decided to take a look at the long term data set and here’s what I found:
- There have been 6 “collapse periods” in the last 20 years – where less than 20% of S&P 500 components were trading above their 200 day moving averages (see red horizontal line above).
- While some periods bounced around in collapse territory for a while, once there was a “recovery” (which I am defining as more than 60% of S&P 500 components trading above their 200 DMA – see blue horizontal line above), it marked the beginning of a meaningful rally, not the end.
- The purple circles at the top and bottom of the chart mark those points when a recovery occurred (after 60% of S&P 500 components were above their 200 DMA – following a print below 20%).
- You can follow the purple arrows at the bottom to see what happened to the S&P 500 after that condition was met.
- In all cases the S&P 500 had already rebounded significantly after hitting the 60% mark – and yet – the rally in all cases WAS JUST BEGINNING.
- The condition that is not present yet is having met the 60% point – which means we could bounce around like in several previous instances – OR, it’s possible we blast straight up to the 60% mark as was the case in early 2019. Time will tell…
Now onto the shorter term view for the General Market:
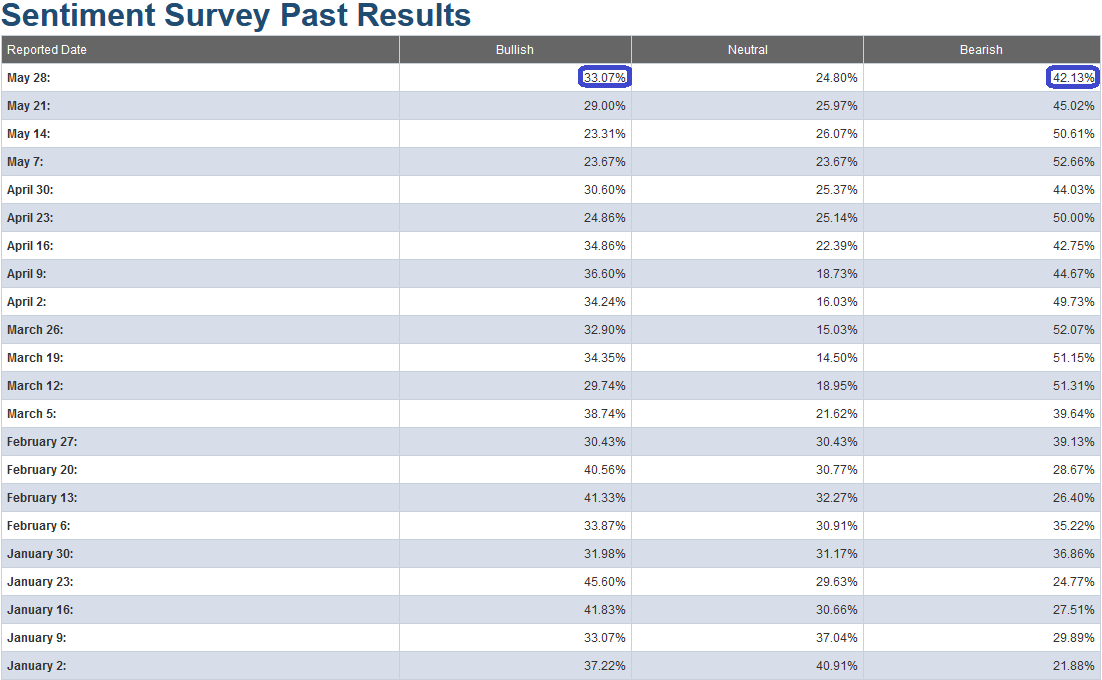
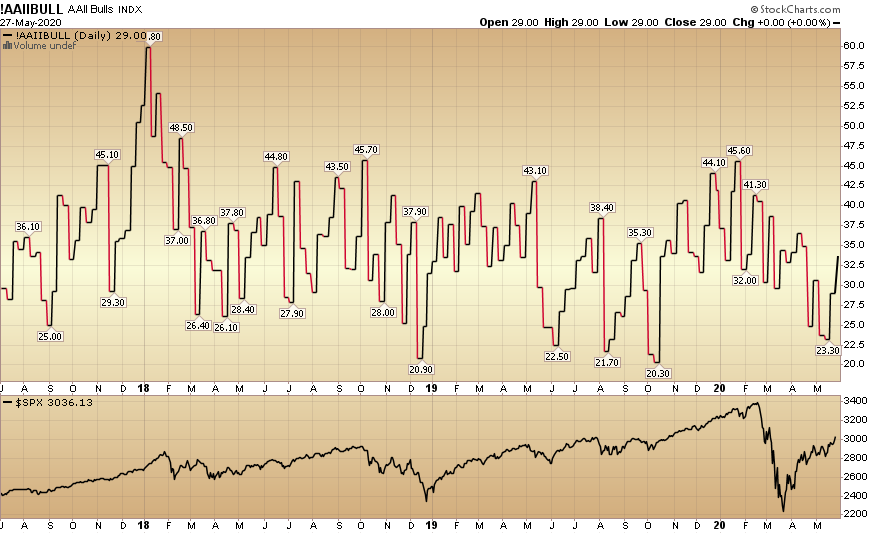
This week’s AAII Sentiment Survey result Bullish Percent (Video Explanation) rose to 33.07% from 29.00% last week. Bearish Percent came down to 42.13% from 45.02% last week. Fear is thawing for individual investors, but there are no signs of euphoria yet.
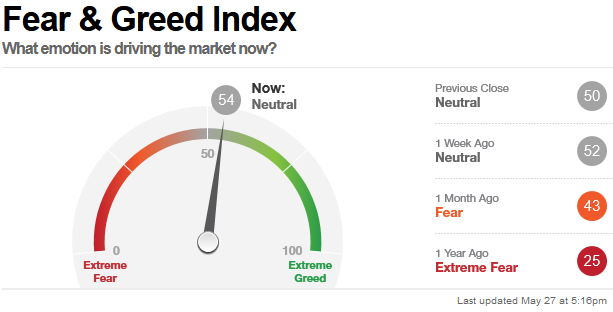
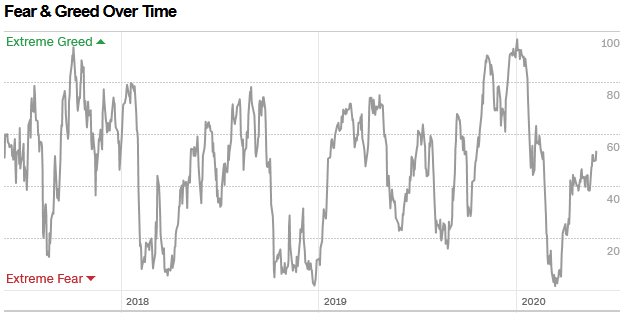
The CNN “Fear and Greed” Index ticked up from 53 last week to 54 this week. The fear continues to thaw and will move in fits and starts in coming weeks. You can learn how this indicator is calculated and how it works here: (Video Explanation)
And finally, this week the NAAIM (National Association of Active Investment Managers Index) (Video Explanation) rose from 57.71% equity exposure last week, to 63.22% this week. Managers are still underweight equities at these levels and will have to add in order to meet their benchmarks.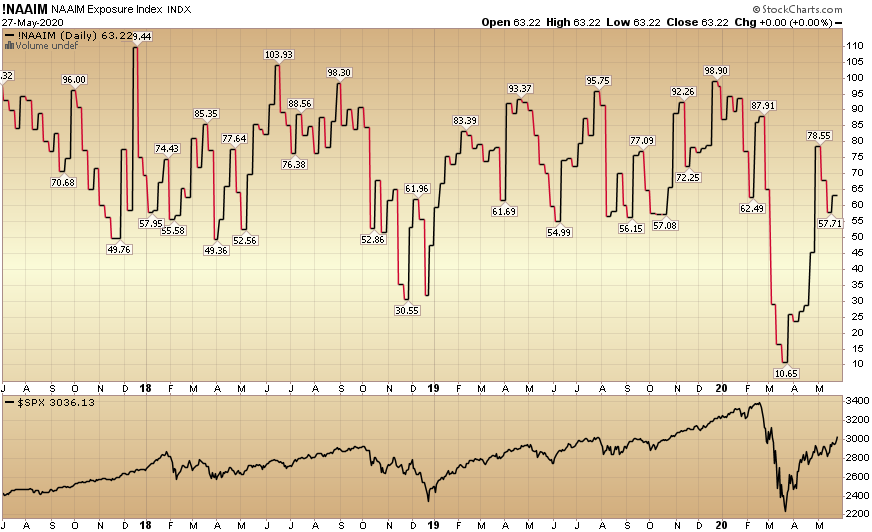
Our message for this week:
For us to hit the “recovery” level of 60% of S&P 500 components above their 200 day moving averages, we will need to see this trend of broadening participation and partial rotation from leaders to laggards that we discussed in previous weeks’ notes.
In case we forgot to mention it for the last six to eight weeks: We like Banks!
We also like and own pockets of Defense Stocks, Home Builders, Energy, and Small Caps. It will not be a straight line up, but over the next 6-18 months we believe we will see relative strength in these groups. This will happen as demand kicks in (people return to work) and the (what will be) >$10T of stimulus/aid/liquidity starts to circulate in the economy.
We may see growth levels by 1H 2021 that would not be possible if not for COVID-19 – as we would never have this level of global FISCAL (and monetary) policy at play.
Looking at the lack of euphoria – in both the retail sentiment and active manager positioning – leads me to believe there’s more gas in the tank. The key will be focusing on those sectors that are just starting to move versus those that have already had the bulk of their runs…


