
For the past three weeks we’ve utilized Country Music songs to represent the theme and sentiment of the stock market at the time.
This week, we are switching gears to Kanye West’s song, “Drive Slow.” After a 30% bounce off the March 23 lows, I will explain how the following lyrics are applicable as they apply to the Stock Market:
Drive slow, homie
If you’re riding around the city with nowhere to go
Drive slow, homie
You can listen here if you don’t mind explicit lyrics (otherwise, take a pass!):
On Tuesday, I was on One America News Network (OAN) TV with Greta Wall. On the show I discussed the Oil Market, S&P 500 earnings, and the impact of the aid, stimulus and liquidity programs moving forward.
If you race cars, you will understand the analogy to nitrous oxide in the tank (and as the featured image for this article) – which I cover at the end of the interview. You can watch it here:
Sell in May?
Ellen Chang, who writes for Kiplinger, U.S. News and World Report and TheStreet asked me a similar set of questions for an article she is writing about the old maxim, “Sell in May and Go Away” and whether or not it should apply this year.
This was my reply:
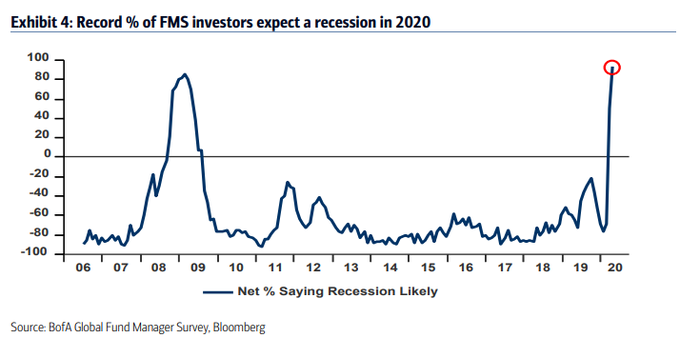
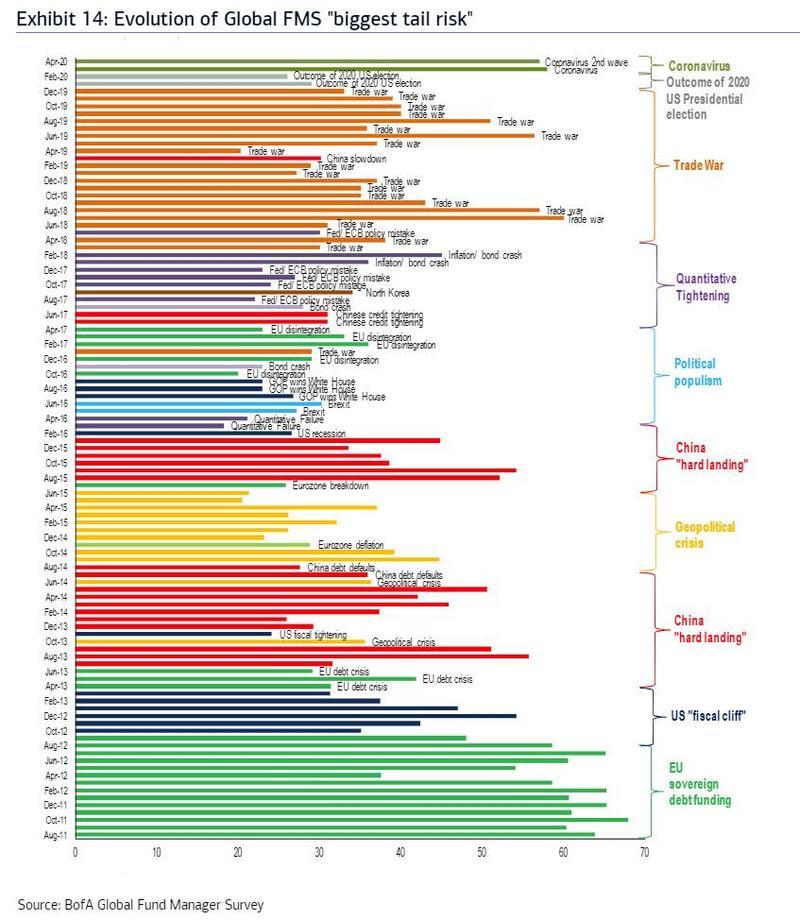
“While on average, this strategy (sell in May) works over time (the data supports it), there are many unique factors at play in 2020. One of the key data points I look at each month is the Bank of America Global Fund Managers Survey. You can see a Summary of the April survey results here:
April Bank of America Global Fund Manager Survey Results (Summary)
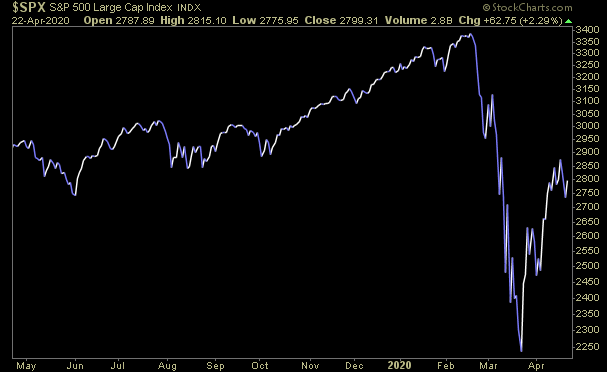
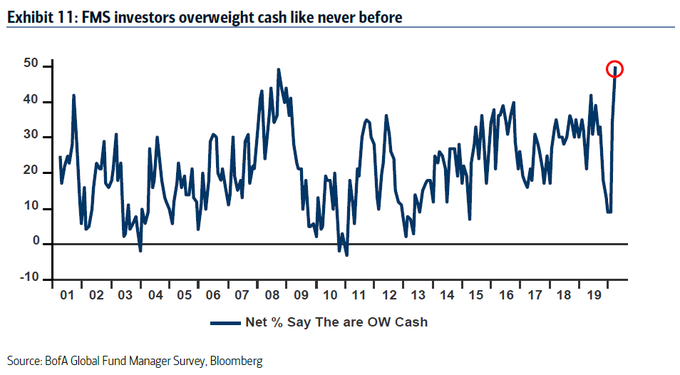
This month’s results found that managers (~200 that control over $500B of AUM) had the highest cash levels since March 2009 (which marked the low in the Great Financial Crisis – marked by 666 on the S&P 500). Historically, this has worked as a contrarian buy indicator – when that level of fear overtakes the market. Defensive positions were the most heavily held: Cash, Treasuries, Utilities and Staples. Cyclicals were the most underweight: Banks, Industrials, Materials.
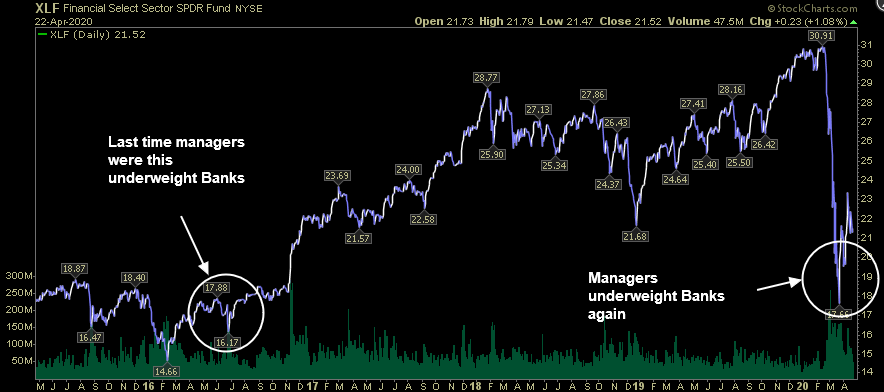
The last time managers were this “underweight” banks was July 2016. The group proceeded to nearly double over the next 18 months. That is not to say this phenomenon will repeat, but it is to say that when one side of the boat is so overcrowded and certain, there can be rewards for taking the other side of the trade. We like and own banks at/below these levels.
The best way to think about how things are different in 2020 is to take a look at the magnitude and speed of the the stimulus and aid. In 2008, policy makers saw the economic “plate” falling off the table, and rather than cushion the fall, they waited for the plate to hit the floor and break into hundreds of pieces. Their actions were too little, too late as Congress did not want to reward bad actors. They spent the next handful of years trying to glue the pieces back together.
In 2020, they learned from the mistakes of 2008 and acted immediately and aggressively by putting a huge trampoline down next to the table so that as the economic “plate” falls off the table, there is enough support for it to bounce back from the bottom and gently be placed back on the table with speed and alacrity.
The trampoline is stimulus, aid and liquidity. Think of a pothole on the highway representing the expected size of GDP contraction due to the coronavirus quarantine. The most pessimistic estimates are between $1.5-2.5T of economic contraction (the pothole). So far, the authorized stimulus, aid and liquidity (asphalt to fill the pothole) is over $8.5T in aid, lending facility and asset purchases (balance sheet expansion). That all sounds great, but what gives? People are still worried about their economic situations.
Here’s how to think about it: You can throw all of the money in the world at the problem, but until the economy slowly and surely re-opens, you’re not going to feel the effect of the stimulus. Cases in the US peaked last week while cases in China peaked on February 5 (we are about 2 months behind their recovery). According to third party data, their employment is now at 90-90% of pre-pandemic levels, their rush hour traffic levels are back to pre-pandemic levels in major cities, “seats in the air” domestic air flight numbers have doubled off their trough levels in February, and coal plants are back to burning at 2019 levels. The same will happen for the US.
Think of the stimulus like nitrous oxide in the tank of a race car. It’ll make the car run down the track faster than before, but you will not see the benefits until you turn on the ignition. We are idling at the starting gate waiting for the green light. Once it flashes and we hit the nitrous button, we can go as fast as ever. Look for signs of that speed in the back half of 2020 and more so in early 2021.”
So long as the persistent fear of a 2nd wave of Corona Virus and a rear view outlook that a recession will come (news flash: it already has), there is room to climb the “wall of worry.”
So we’ve discussed Nitrous Oxide and going fast, what does Kanye’s song, “Drive Slow” have to do with the Stock Market this week? On Friday, Seana Smith asked me a question about Market Breadth during a Yahoo! Finance interview. You can view it here:
This was another subject that was covered in this month’s Bank of America Global Fund Managers survey.
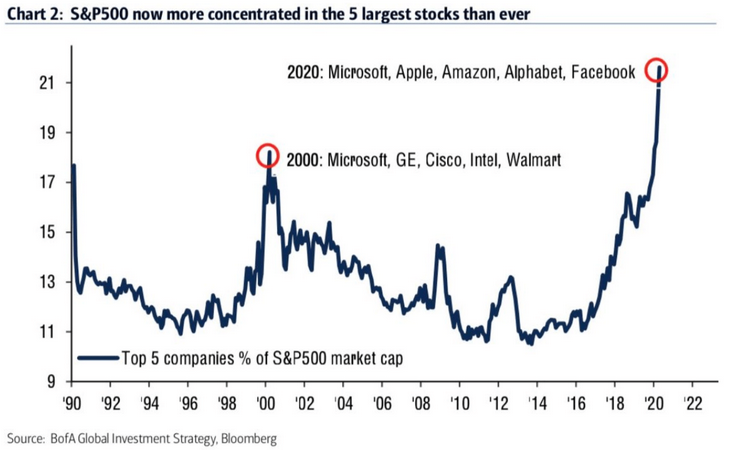
The top five weights in the S&P 500 now represent over 21% of the weighting in the index. This is what we call an extreme. The last time we saw such a concentration in weight among the top five stocks in the index – was the beginning of an historic rotation OUT of TECH/GROWTH and into CYCLICALS/VALUE.
And this my friends, is where we want to “drive slow, homie.”
Everything runs in cycles. Just yesterday, the embodiment of the above-mentioned chart, (and richest person in the world – from technology) Bill Gates, just purchased this oceanfront mansion from T. Boone Pickens’ (deceased Oil Billionaire) widow Madeleine – for $43 Million.
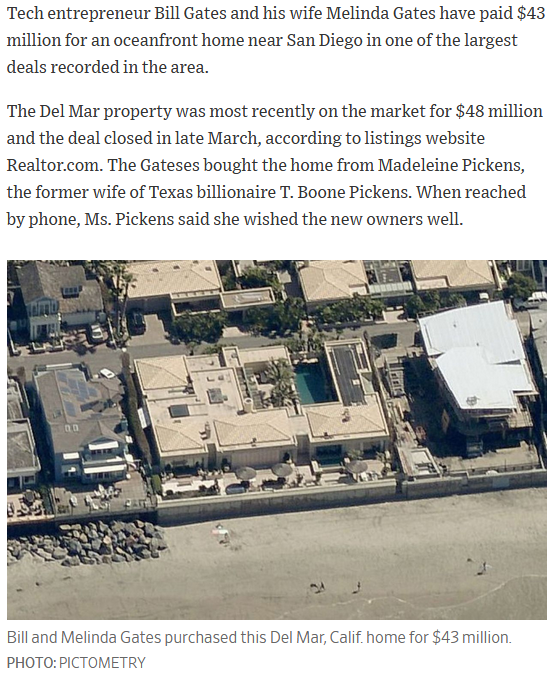
(Source: WSJ)
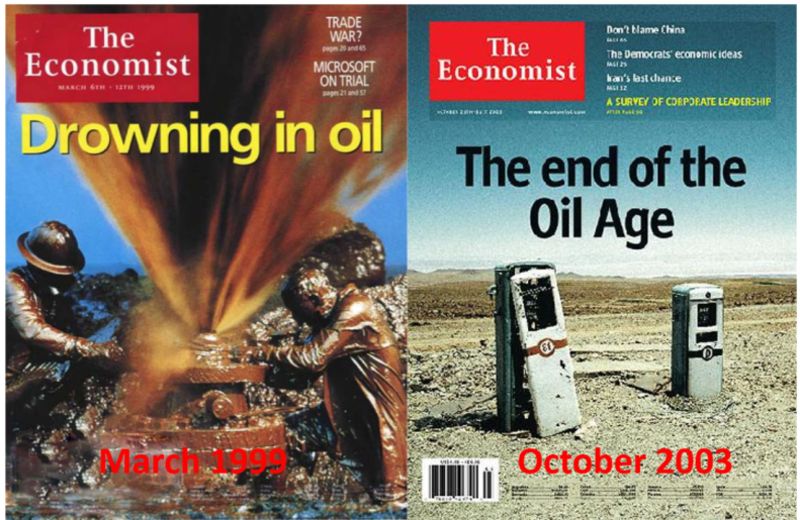
Here’s what the cover of the Economist looked like at the last peak in top 5 “tech” stock index concentration:
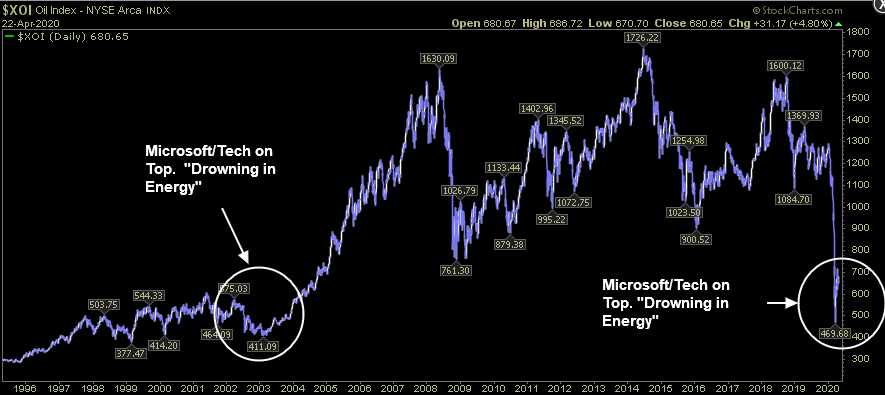
Here’s what happened to the Energy Sector next:
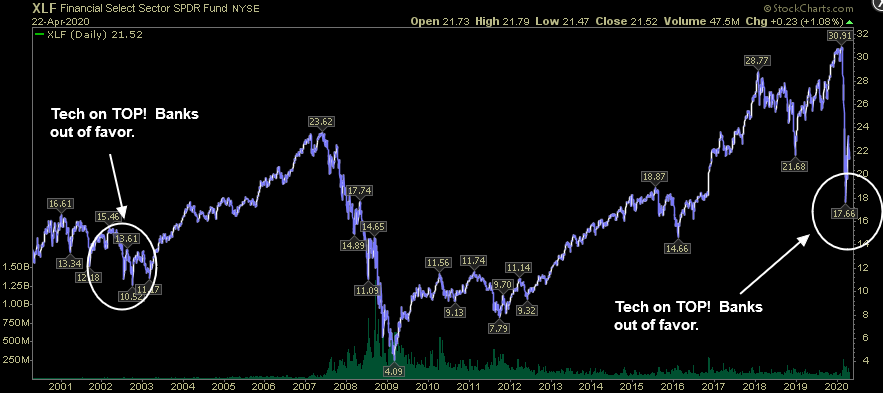
Here’s what happened to another “value sector” (Banks/Financials) that was out of favor the last time tech “ruled the world” and was most heavily weighted in the cap weighted indices:
And here’s what happened to Value Stocks versus Growth Stocks after they hit this level of extreme:
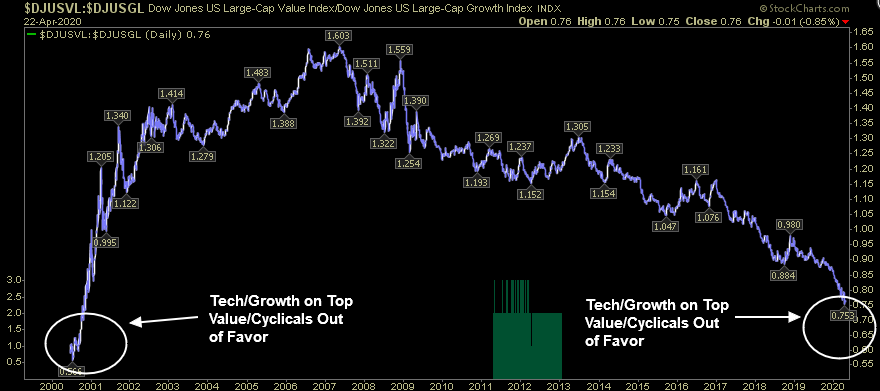
We don’t know WHEN this shift/rotation will occur, but based on the extreme levels we are seeing in BofA’s “Chart 2” above, it may be sooner than expected. It would be the absolute exact opposite of what anyone would predict with Cushing WTI going negative this week, and Banks being the most underweight holding in years…
The next $1T+ of stimulus will be infrastructure. Perhaps that’s the catalyst that begins this cycle’s shift back to cyclicals and value. That’s where the nitrous oxide is. On the other hand, if you’re in the five stocks that currently represent 21%+ of the indices weight, “Drive Slow, Homie, Drive Slow…”
Now onto the shorter term view for the General Market:
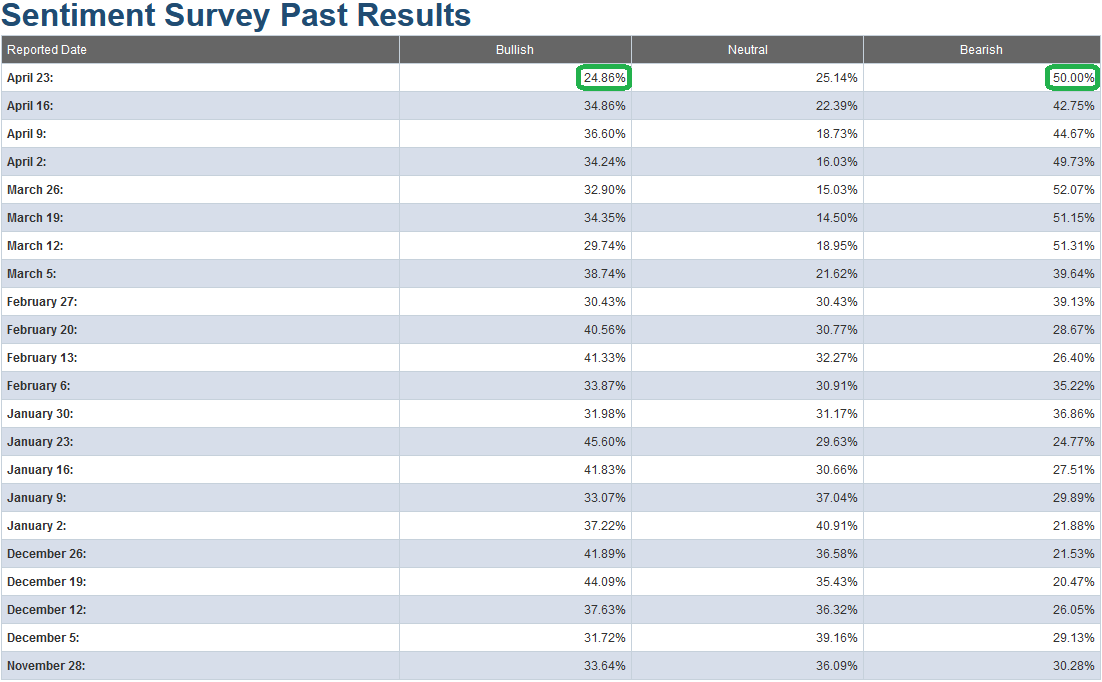
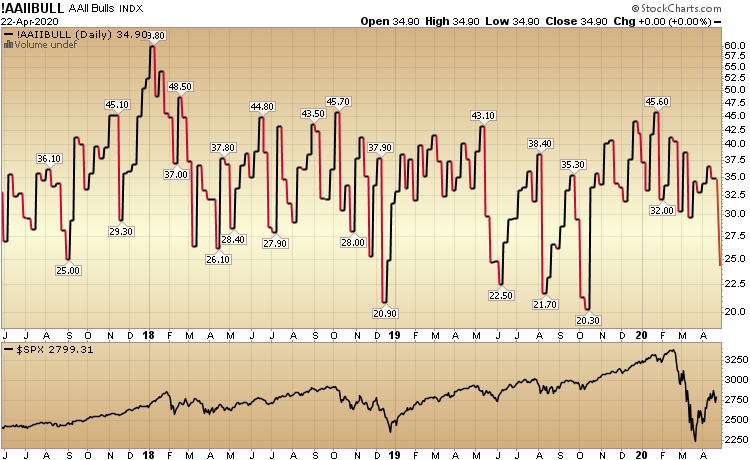
This week’s AAII Sentiment Survey result Bullish Percent (Video Explanation) dropped to 24.86% from 34.86% last week. Bearish Percent jumped to 50.00% from 42.75% last week. This is good news as we are now at/near extreme levels on both accounts. For the past few weeks I had been saying, “what is sitting in the back of my mind is the fact that while Bearish Percent is coming off an extreme level, the Bulls never got washed out in the crash.” That is less of a worry now.
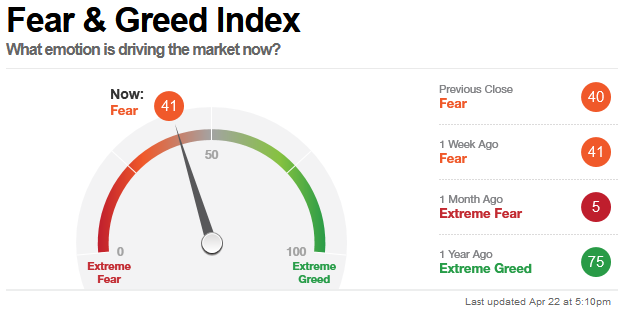
The CNN “Fear and Greed” Index flatlined from 41 last week to 41 this week. The fear is slowly thawing and will move in fits and starts in coming weeks. You can learn how this indicator is calculated and how it works here: (Video Explanation)
And finally, this week the NAAIM (National Association of Active Investment Managers Index) (Video Explanation) rose modestly from 26.74% equity exposure last week, to 28.71% this week.
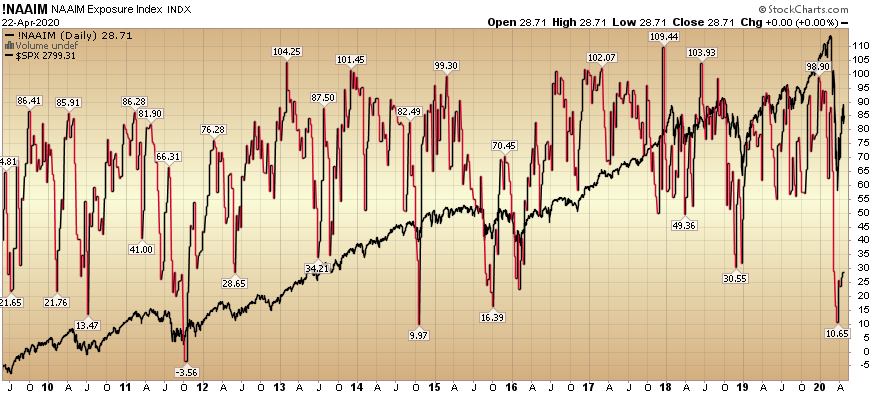
Active managers will have to regain exposure in coming weeks as the worst of the news starts to move into the rear view mirror. We are not there yet. The worst news is still ahead but it will get better. It always does…
Our message for this week is the same as last week:
Because we have taken advantage of most of the best discounts that were available in equities (during mid-March to early April – see previous weekly notes under “sentiment” category of the site), we shifted focus in the past few weeks to start picking up a selective portfolio of distressed high yield credit – that has fallen materially since the advent of COVID-19 (i.e. some bonds have fallen as much as 40-60% in the past 6 weeks – from par).
There are selective pockets that have not recovered to the same extent as the equity markets have. We believe that many of these securities will recover to par over time as credit markets repair and government provided liquidity finds its way to this distressed corner of the market.
We also have dry powder available to add to equities in the event we do get a re-test (or lower in coming weeks and months), but that appears to be a lower probability at this point. If the facts change, we will adjust, and be ready to take advantage. But for the time being, the bulk of the opportunity is in a selective basket of researched individual distressed credit securities.
As was our repeated plan in the previous four weeks (prior to early April) of buying the highest quality equities on every red/down day (and sitting on our hands on green days), we have followed and will follow the same template in the high yield credit markets.
Final Thought…
So I guess the final question is, “with rig counts now down to 438 from 1600 at the peak (and 2 full years of committed OPEC+ cuts starting in May – just as demand begins to recover), will we be seeing future Oil Billionaires buying oceanfront mansions from ex-Tech Unicorn Billionaires five years from now?” I won’t hold my breath, but if history tells the story – anything is possible…


