

The song I have chosen this week to represent the mood of the Stock Market is, “One Man Band” by Old Dominion.
As we discuss breadth and sector rotation, one thing sticks out: FAANGM stocks – which include Facebook, Amazon, Apple, Netflix, Google (Alphabet), and Microsoft – were as high as ~25% weighting in the S&P 500 in recent weeks. These lyrics speak to the emptiness of a “One Man Band:”
Nobody’s singing the harmony
Up there just me and my shadow
No bass, no guitar, no tambourine
More room to run?
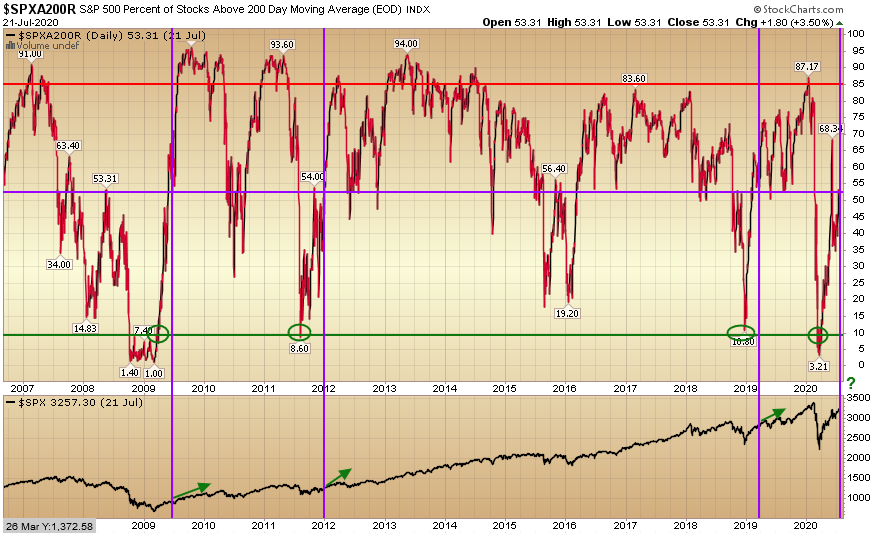 Currently, ~55% of components are above their 200 DMA. Coming off an extreme level of 10% or below, it is common to have some choppiness at this level before a resumed advance. Of important note is the fact that all major corrections in the last decade+ have been preceded by a print of 85% BEFORE the major selloff. We are not near those levels at present.
The implication of this lower level is that you could potentially see rallies “underneath the surface” of the general indices – with laggard sectors and stocks beginning to outperform relative to the small band of stocks that have led the way and currently carry the highest weighting.
The laggards (that are starting to finally show strength) are cyclicals/value (Financials, Industrials, Materials, Energy, etc.) which historically tend to outperform in the early stages coming out of recessions.
We covered this “Epic Battle” between Growth/Tech and Value/Cyclicals in last week’s note:
The Eagles, “Long Run” Stock Market (and Sentiment Results)…
Growth outperforms in the short term when it looks like cases are spiking, renewed shutdowns are coming, and the recovery will be slow (late June/Early July). Value outperforms when it looks like the vaccine is coming, cases are leveling off or more stimulus is coming (the recovery will be quick). We saw a taste of this in May and in the last week or so.
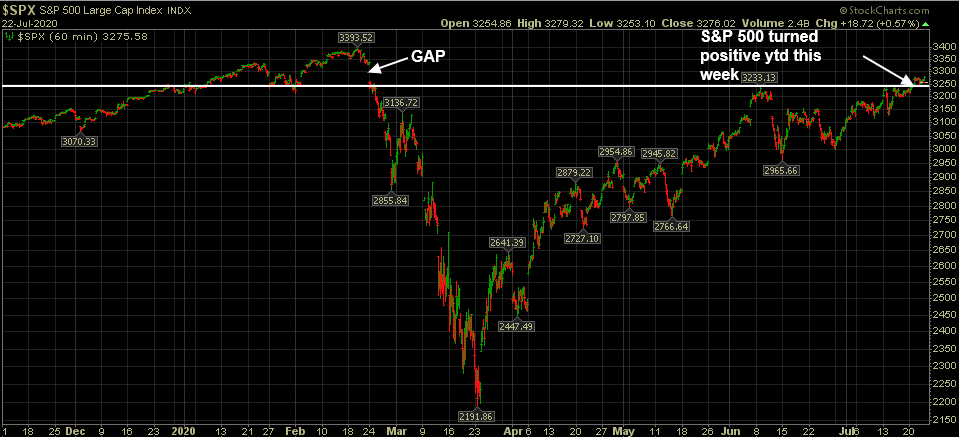
Last week we posted the chart above and pointed out that the next level of resistance to overcome was the white line (which was attempted and failed in June). This line also represented the inflection point for the S&P 500 to trade positive for the year – which it has now accomplished.
The next target will be to fill the gap from late February, which may be a “buy the rumor” scenario setting up in the anticipation of the final stage of the stimulus package.
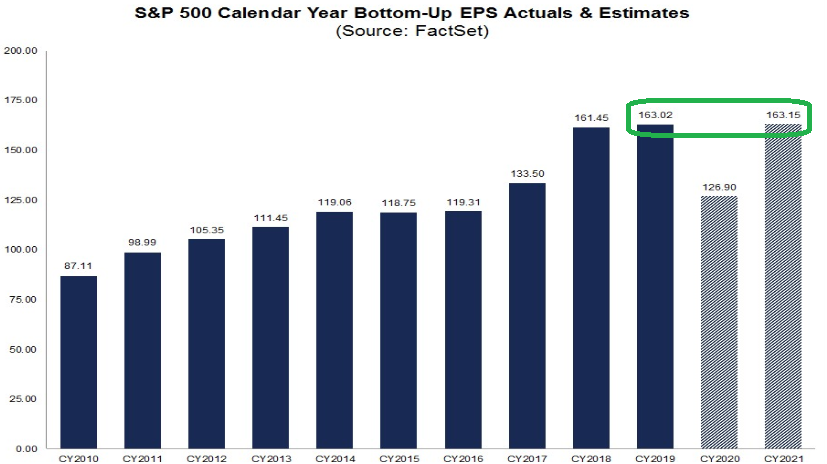
Given that 2021 estimates have held in-line with previous earnings levels that yielded ~3400 on the S&P 500, “filling the GAP” is well within reason (particularly with a lowered discount rate):
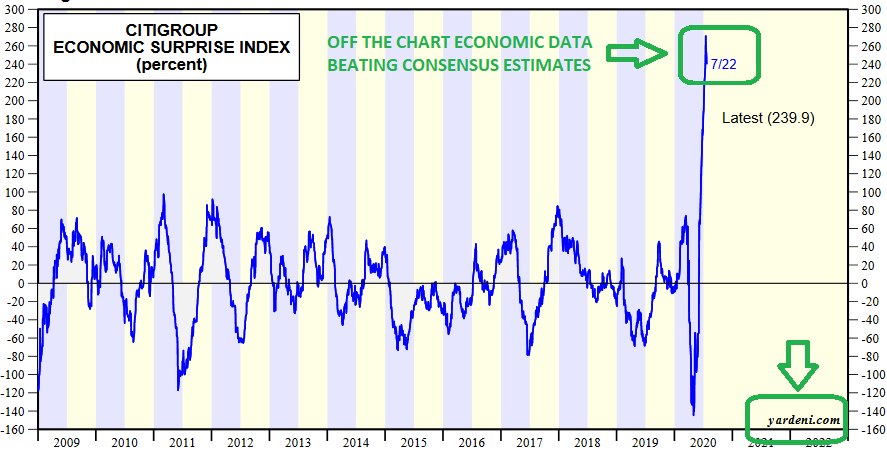
This outlook is also buttressed by the Economic Surprise index – which continues to show record beats this week (and is trickling into earnings results):
What will the Stimulus Package look like?
There is a bid/ask for $1T/$3.5T between the Republicans/Democrats. The two “Deal Breaker” points that could have torpedoed the deal were:
Republicans: Payroll Tax Cut
Democrats: Mail in voting
It appears that there may be a “work a round” scenario, “White House, Senate GOP Weigh Interim Unemployment Aid Extension.” This would be treated as separate from the $1T ceiling that Senate Republicans want to start at for negotiations.
This is the most urgent part of the package as it will enable the 2/3 of temporarily unemployed (who have not already regained employment) to pay their bills/rent/mortgages – as a bridge – until we get the vaccine in Q4.
The final stimulus bill will focus on nine categories:
-aid to state governments
-employee protections
-legal safe harbors for employers
-unemployment insurance reform
-employee retention tax credits
-more small-business aid
-food stamps
-money for schools to reopen
-more money into PPP to keep employees after Aug 8 (when it expires)
Source: Dan Clifton (Barron’s)
What do we like after such a big move?
We like/own Cyclicals and Banks. To update our recent thesis on Wells Fargo, the stock is now up over 10% in the past week following the dividend cut:
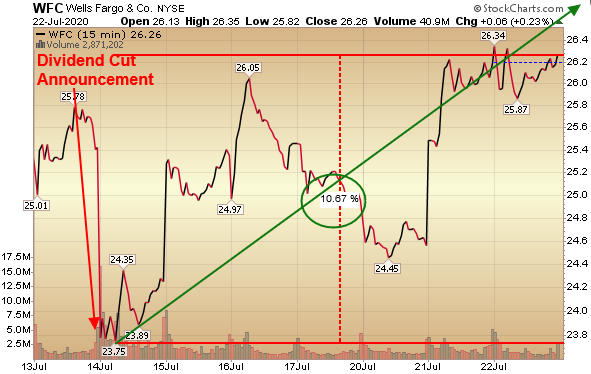
You can review our note from June 29 which anticipated this “sell the rumor, buy the news” scenario. We think it is just starting and are positioned accordingly. It will not be a straight line up, but should trade back up to book in due time.
Another major development took place this week at Wells Fargo: The CFO – John Shrewsberry was replaced by Mike Santomassimo (who was previously CFO of Bank of NY Mellon).
The significance of this move was pointed out by Wilfred Frost of CNBC – who noted that Shrewsberry was the last of the old administration that was around when all of the aggressive sales tactics were discovered. This change puts Wells Fargo in a new position to go back to regulators and say that they have replaced all of management that were involved in the company during that period and they would like the “asset cap” (which was part of their punishment), removed.
Wells Fargo had been barred from growing its assets above $1.95 trillion for more than two years. According Bloomberg data (as of May 19, 2020) Wells Fargo had lost $220.1 billion in stock market value since the Federal Reserve imposed a $1.95 trillion asset cap on the bank in February 2018.
Considering Wells Fargo is our nation’s largest mortgage and small business lender, it is imperative that this artificial asset cap is lifted. This Administration is serious about a quick/solid/stable economic recovery and re-employment of the the 2/3 of people who have lost their jobs and not yet been re-employed.
We CANNOT have a recovery without credit growth and extension to Main Street businesses and individuals. Handicapping the nation’s top lender (after they have already done their penance and cleaned house) works against the interest of millions of Americans. Sooner, rather than later, the regulators must figure this out and let Wells Fargo play a pivotal role in recovering America – with its full lending capacity.
A few more thoughts on Banks…
This week, Al Root put out an article on (Barron’s) elaborating on what I said about CECL last week on CNBC Europe:
Here are the key takeaways:
- Much of the “over-reserving” (for credit loss) last week was due to a new accounting treatment/rule called CECL. New accounting rules require that banks estimate, and recognize as an expense, all the losses they expect from loans the day loans are made. In the past, loan-loss recognition was far less aggressive.
- If accounting rules hadn’t changed, the big-four banks would have made roughly $28 billion in second-quarter pretax income versus $5B they actually reported. That is down from $33B year on year but still a lot better than the accounting change implied.
- When those reserves prove to be too conservative, the reserves will come back as income in future quarters – as there is more visibility (and possibly a vaccine).
- This was a case of “sell the rumor, buy the news.” Banks are starting to move back up after earnings – coupled by a rotation into cyclicals.
What else do we like in the Cyclicals Bucket?
We continue to like Defense Stocks. While trade relations between US/China should remain okay – so long as the terms of the Phase 1 Trade Deal continue to be acted upon, the rhetoric is picking up on multiple fronts:
- Disputes over South China Sea territory. $4T of global trade flows through this region ($1T is US interests).
- Disputes over auditing standards for US listed Chinese companies. Administration moving toward level Audit playing field across all listings.
- Disapproval over Hong Kong treatment and “favored status” removal.
- Disappointment over COVID communication/warning.
- Consulate closure in Houston.
Secretary Pompeo seems to be building alliances with other nations. This effort may put China in the global trade penalty box in short order – should other nations join the initiative. Should that be the direction that things move, there is no telling what China might do to protect their interests.
While it is true that it is difficult for an incumbent to get re-elected “if” still in a recession at election-time, incumbents are always re-elected when at war (6 out of the last 6 times).
The clear beneficiaries if/as rhetoric rises, will be the deeply undervalued Defense Sector. We have exposure to a basket of Defense stocks – irrespective of the short-term direction of relations with China.
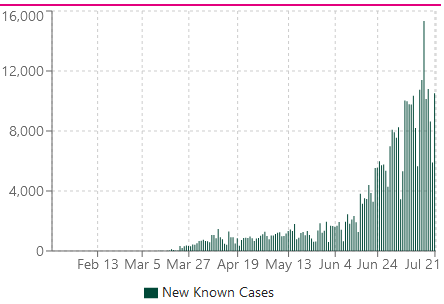
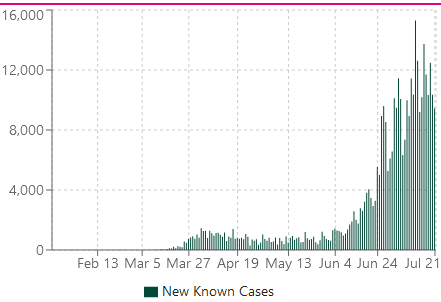
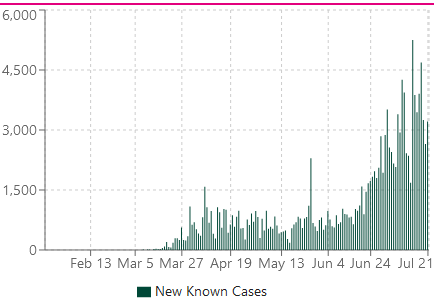
Some Covid Data:
While we have seen a recent spike in cases in the SunBelt – it has been directly correlated to a disproportionately larger percentage increase in testing:
OVERALL Deaths in the United States are the lowest they have been in years for this time of year (after coming off the recent spike in April):
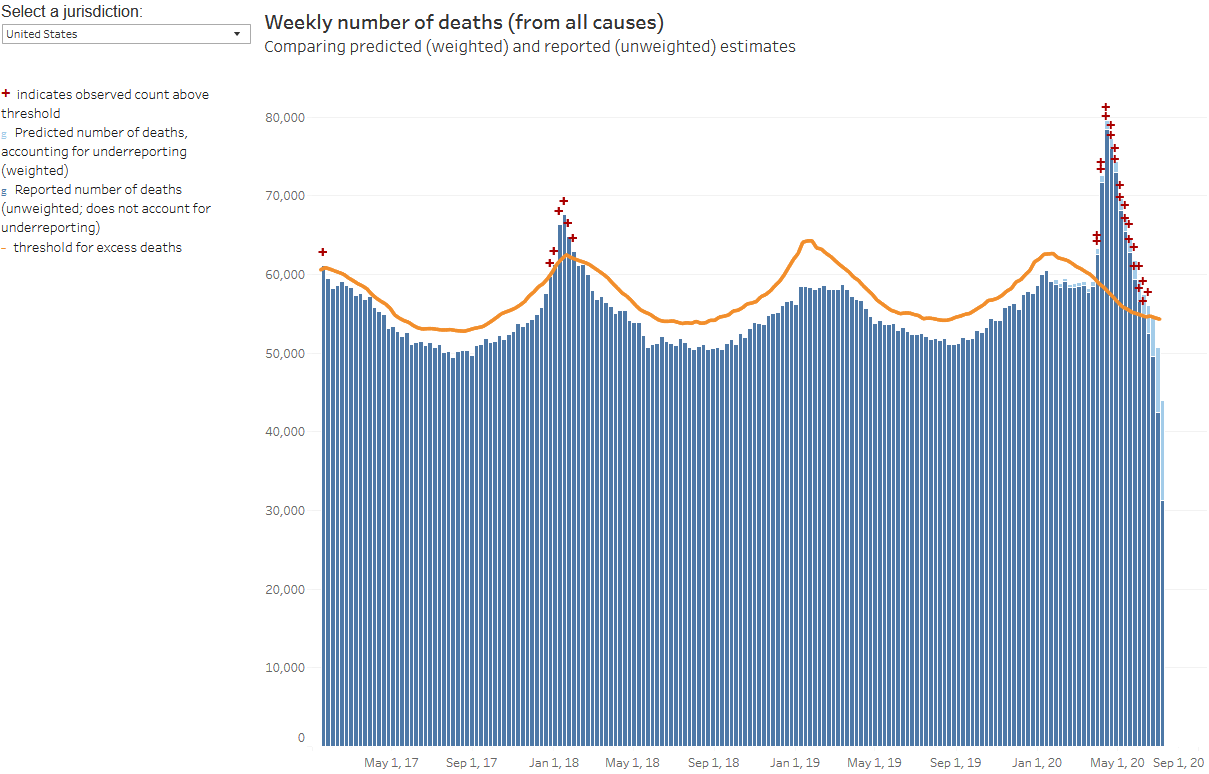
Source: tableau public
The good news is that new COVID cases seem to be SLOWLY and stubbornly coming down in the troubled states despite (daily testing numbers) remaining elevated at record levels (source: usafacts.org):
Arizona:
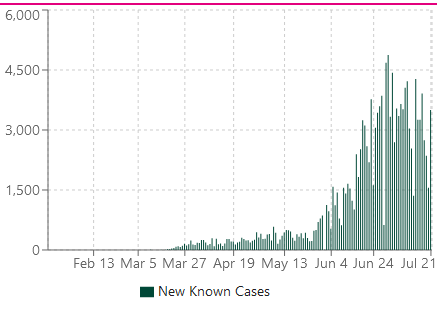
California:
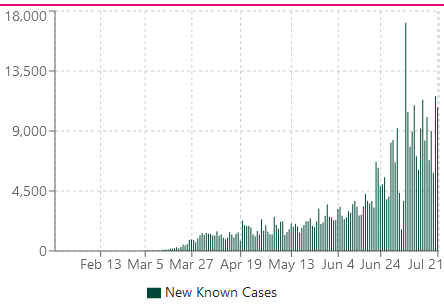
Texas:
Florida:
Georgia:
Wear a mask in public. It’s our best weapon to suffocate/starve the “invisible enemy” until a vaccine/treatment comes to destroy it.
Now onto the shorter term view for the General Market:
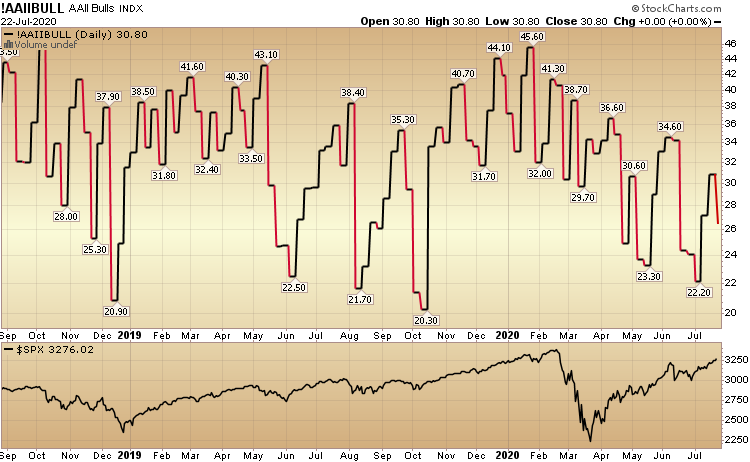
In this week’s AAII Sentiment Survey result, Bullish Percent (Video Explanation) retrenched to 26.06% from 30.84% last week. Bearish Percent rose to 46.83% from 45.37% last week. These are levels that historically favor being a buyer versus a seller. This is one unloved rally riddled with constant skepticism and disbelief. Because of that, we can continue to scale the “wall of worry.”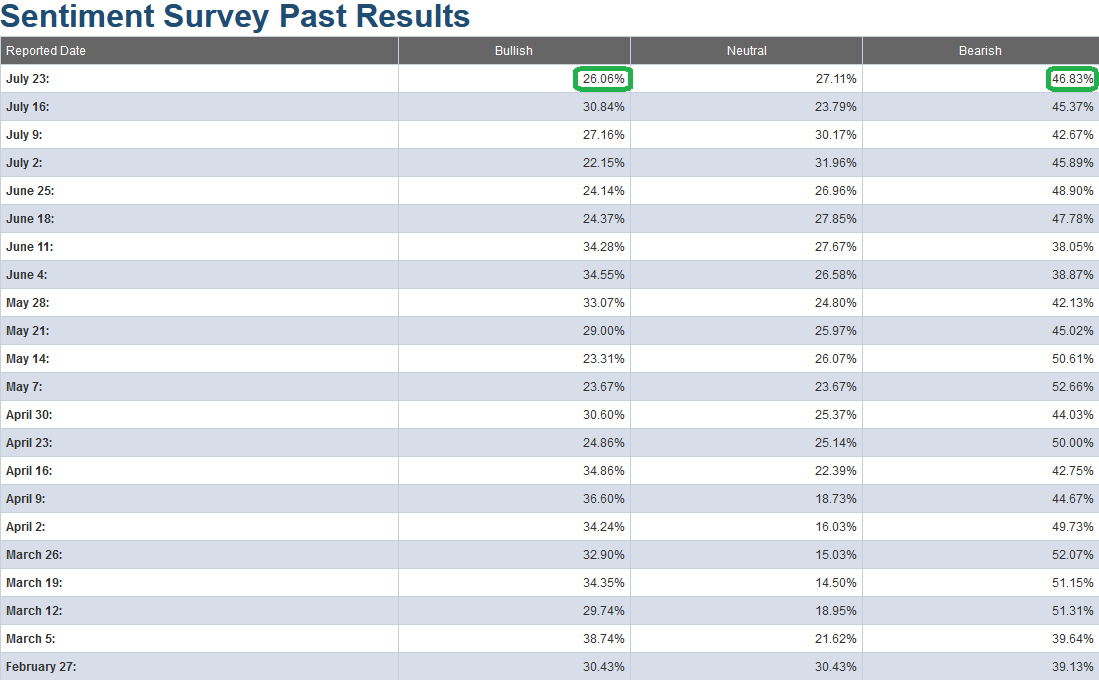
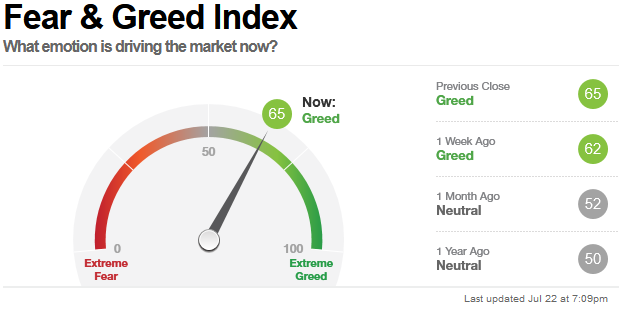
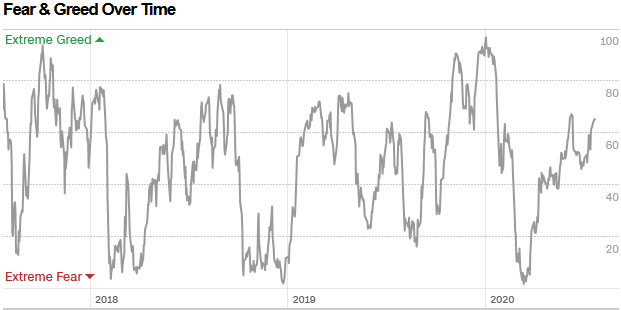
The CNN “Fear and Greed” Index edged up from 63 last week to 65 this week. Despite the market moving up >40+% off the lows, we have still not hit an extreme/euphoric level (>80/90) yet. You can learn how this indicator is calculated and how it works here: (Video Explanation)
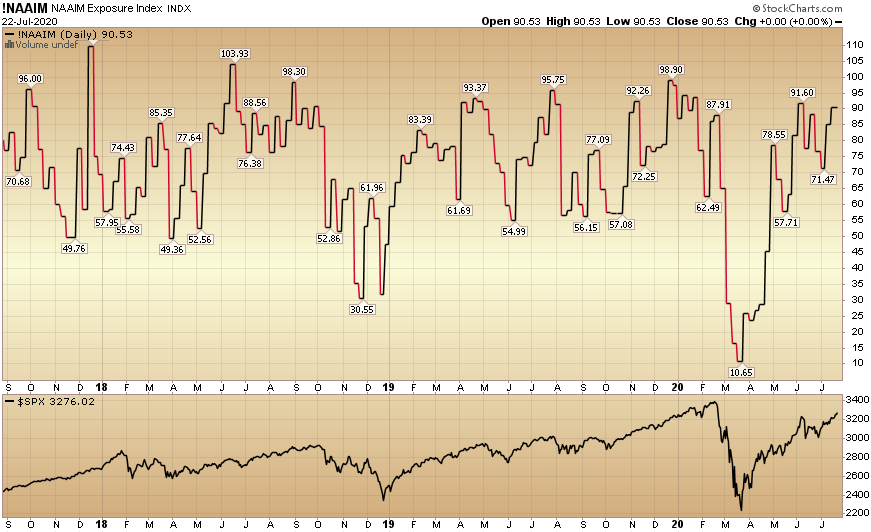
And finally, this week the NAAIM (National Association of Active Investment Managers Index) (Video Explanation) rose from 85.09% equity exposure last week, to 90.53% this week. This is on the high side, so we must keep an eye on it moving forward.
Our message for this week:
We remain very constructive in the intermediate term and will take advantage of any additional buying opportunities in laggard/cyclical names (per discussion above) – should they arise over the Summer/Fall. I would not be surprised to see a bit of volatility/chop related to the Stimulus Bill over the next week(s). When that chop shows up just remember the following three things:
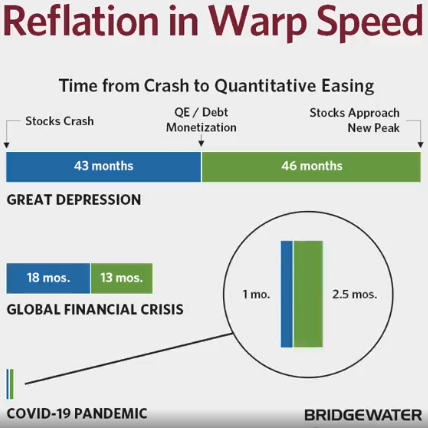
- The Fed did more in 1 month following the March crash than they did in the first 18 months following the GFC in 2008-2009 and 43 months during the Great Depression (source: Bridgewater)
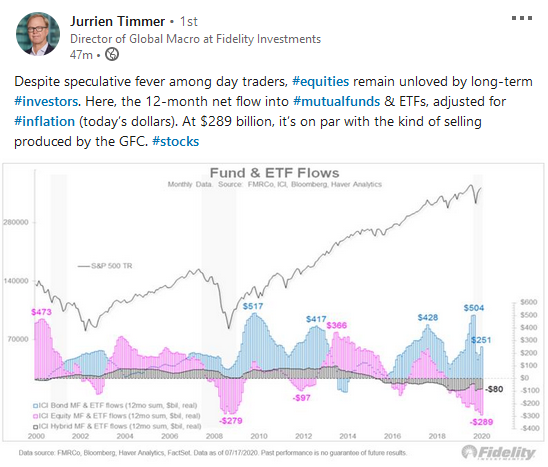
- Long term investors are still too underweight equities (just as they were after the crash in 2009):
 3. Milton Friedman was right (we should expect serious Nominal Growth in coming quarters with this level of M2 growth). But it wouldn’t have hurt him to have a few more drinks with Keynes!
 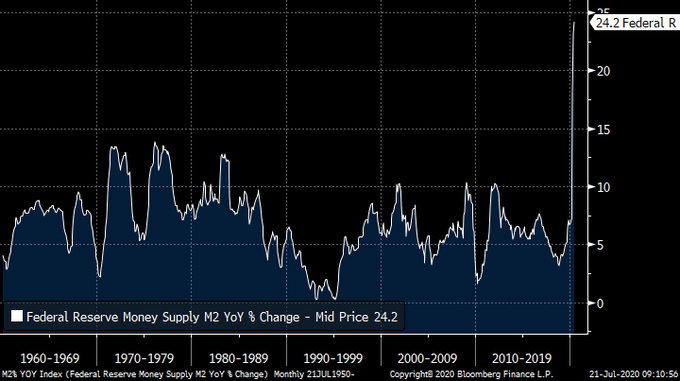 In the interim we will hold what we have and shave only in the event we DO hit levels of euphoria that we have not seen since February (we are not there yet).
Until next time, it’s time for this market to invite more participants on stage:
Been flying solo for so long
Nobody’s singing the harmony
Up there just me and my shadow
No bass, no guitar, no tambourine…


