

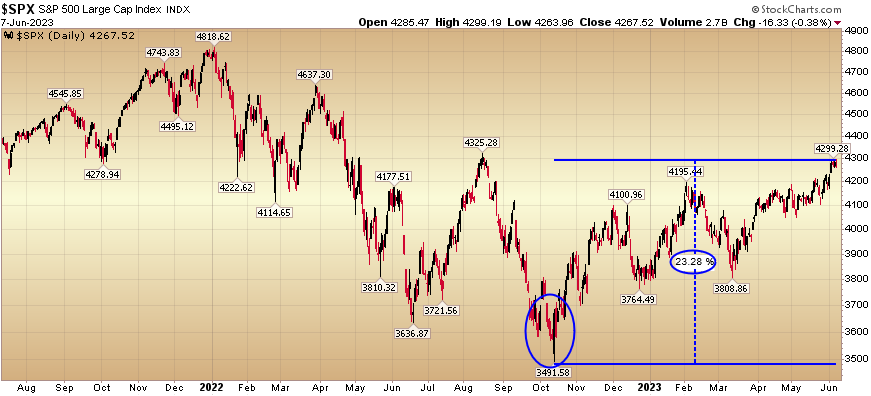
It was very lonely being a bull last fall when the S&P 500 was in the 3600s to 3700s. A few smart hosts kept an open mind (at those subdued levels) when we were pounding the table to buy equities (see circled dates below).
Will Koulouris at CNBC may have thought I was a bit too optimistic on October 4, 2022 but the results speak for themselves:
Chloe Aiello over at Cheddar kept an open mind on 10/17/2022 when we laid out our bull case:
Even more recently when the S&P 500 was in the 3,700s-3,900s, The Claman Countdown and Making Money with Charles Payne on Fox Business stayed receptive to the bull camp as I reinforced the upside case:
Many investors thought this was pollyanna, and I spent some time responding to their “great depression is coming” comments from October and November on TikTok this week:
@officialhedgefundtips
For so many, this 23% rally off the lows has been, in the words of Country Singer Jake Owen from his 2017 hit, “The One That Got Away.”
She was the one that got awayThe one that wrecked my heartI should’ve never let her goI should’ve begged her to stayShe was the one that got awayYeah, the one that got away
Okay, so we’ve taken you on a look through the rear-view mirror, now let’s have a look through the windshield. The good news is there’s plenty of runway ahead. The bad news is, it’s going to be a bit more tricky.
For starters, I don’t like the look of the SKEW index. This is ordinarily a level I would look to begin buying downside insurance.
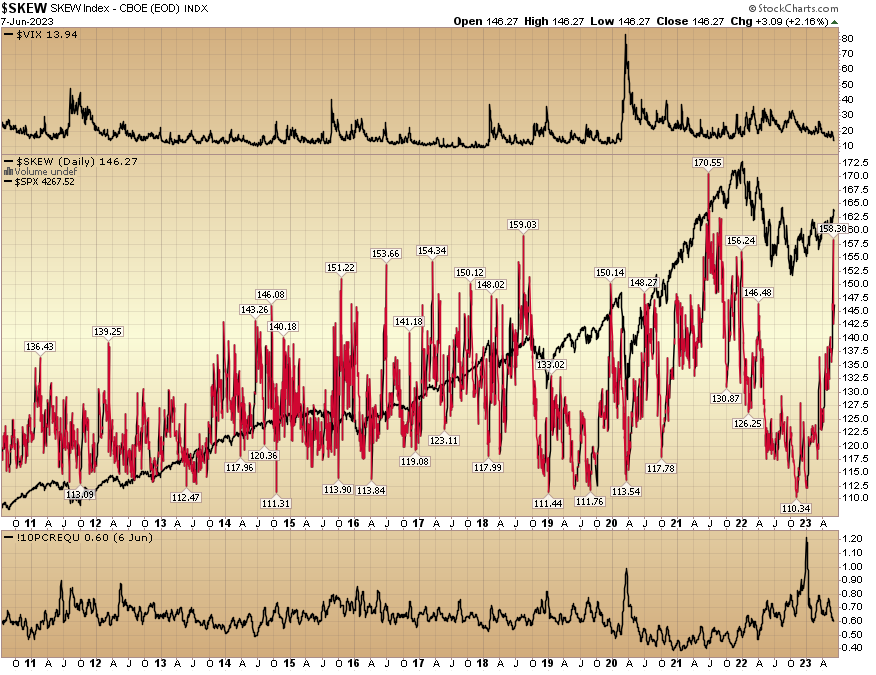
The SKEW index is calculated using S&P 500 options that measure tail risk—returns two or more standard deviations from the mean—in S&P 500 returns over the next 30 days. The primary difference between the VIX and the SKEW is that the VIX is based upon implied volatility round the at-the-money (ATM) strike price while the SKEW considers implied volatility of out-of-the-money (OTM) strikes. Investopedia
While I wouldn’t be surprised by some short term market consolidation, I also wouldn’t be playing for it. The primary reason I am making this exception is because what the “tail-risk” event traders were betting on was a U.S. debt default (debt-ceiling negotiation failure). It did not happen, so all of their insurance premium went up in flames.
I become way more concerned when SKEW spikes on no news (and a background of euphoria) because the implication is that smart money is quietly getting prepared for wholesale distribution. This is not the case. In this case, they were preparing for a nuclear bomb that has since been disabled (and skew is now dropping).
If you take a look at this recent chart – discussing the election cycle seasonality we referenced in the Cheddar appearance above – you will see there is meaningful runway ahead:
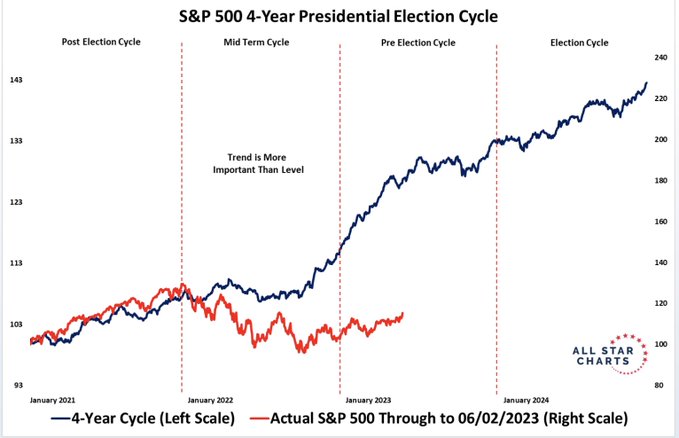
Source: J.C. Parets
If you zoom out a bit further, you can see the secular bull market timeline that we referenced in 2020 (when everyone was hidden under a bunker):
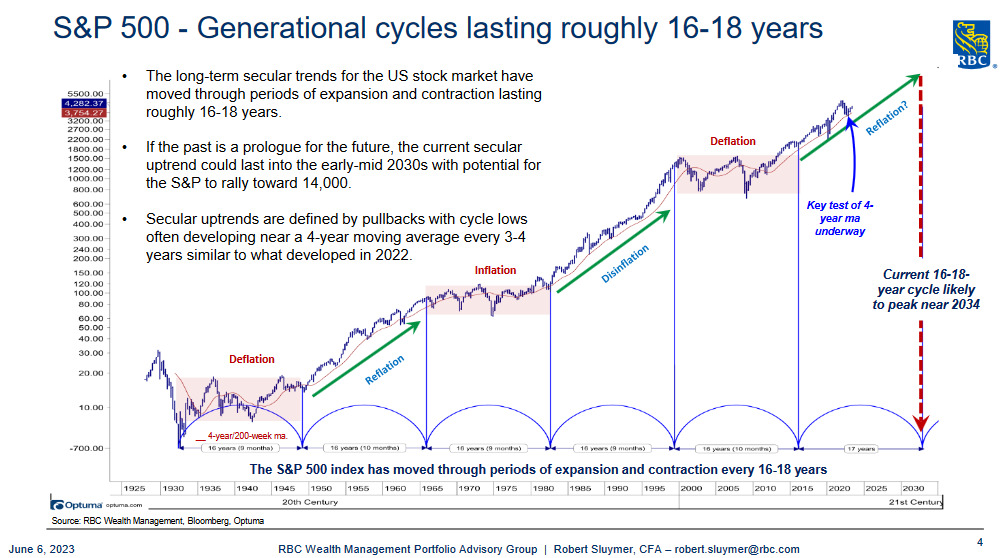

Source: Robert Sluymer RBC
Here’s where part of my optimism comes from moving forward:
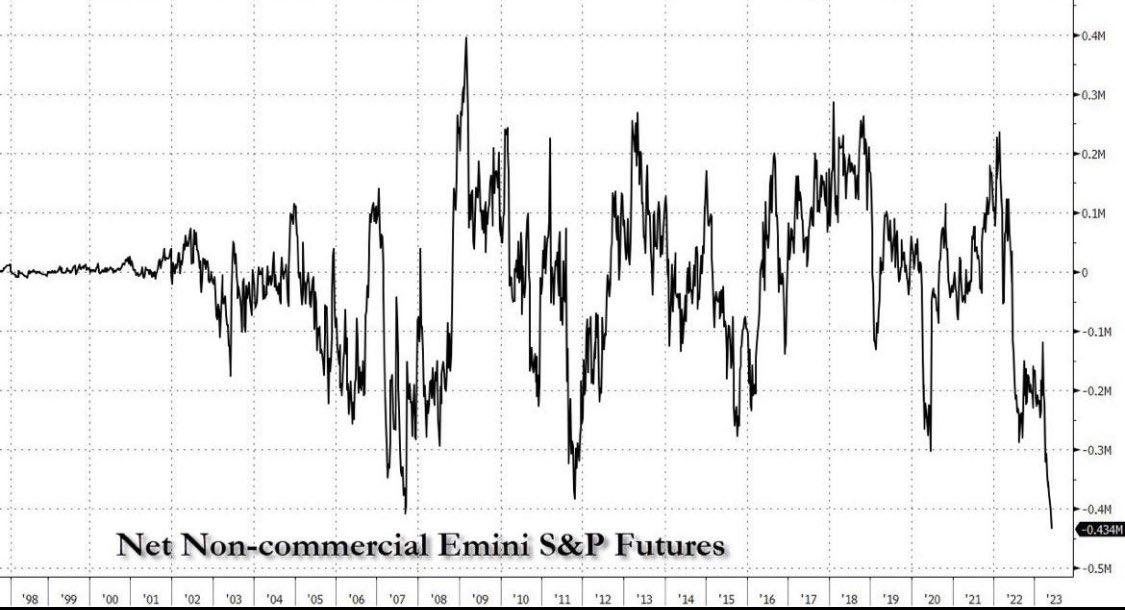
Source: ZeroHedge
Managers are the most short S&P futures since the last debt showdown in 2011. Other instances of extreme shorts (crowded to one side of the boat) that were great BUY opportunities were 2020 and 2015/2016. The Bear camp will point to the exception in 2007 as a reason to be bearish, but I would take issue with that due to the fact that cash levels were still euphoric in 2007 (meaning managers were still aggressively IN the market/equities) versus today where they are still in excess cash EVEN FOLLOWING A 23% RALLY OFF THE LOWS:
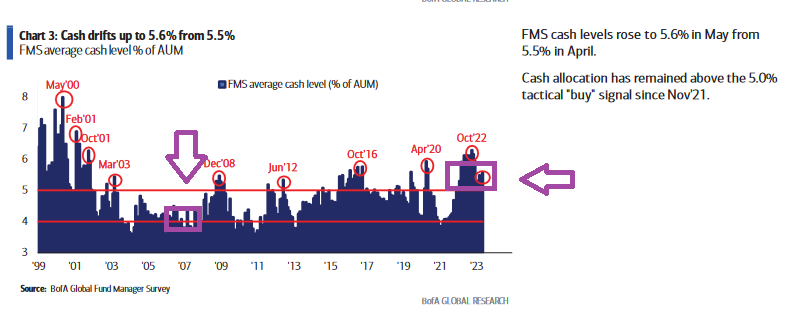
Today’s cash levels more closely resemble the 2011 and 2015/2016 levels that coincided with aggressive futures shorting VERUS 2007 when managers were still fully invested in equities.
The continued cash and worry imply (even if we get some short term chop), that the path of least resistance and the PAIN TRADE (based on current continued defensive positioning) is UP…
Now earlier, I referenced the next move higher will be trickier. What did I mean by that?
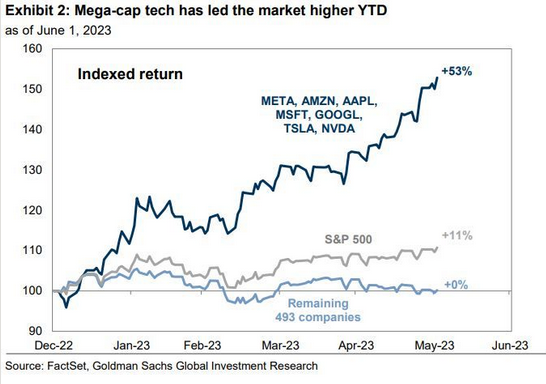
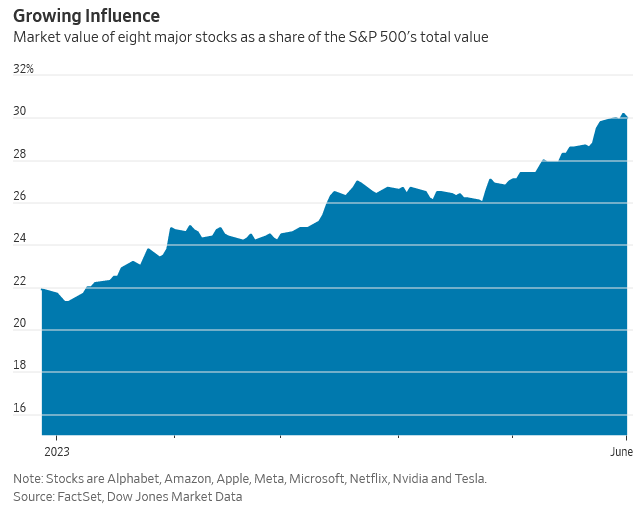
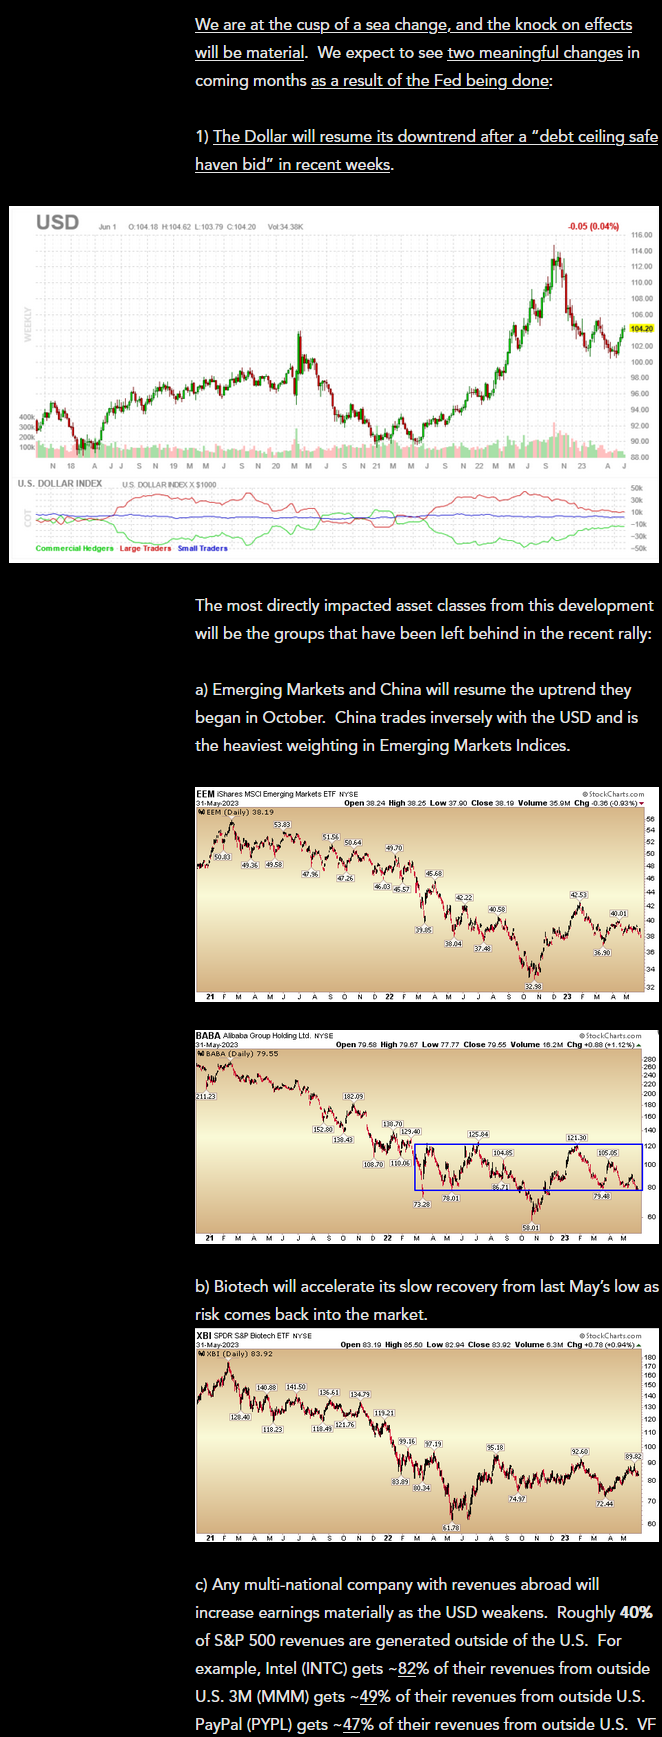
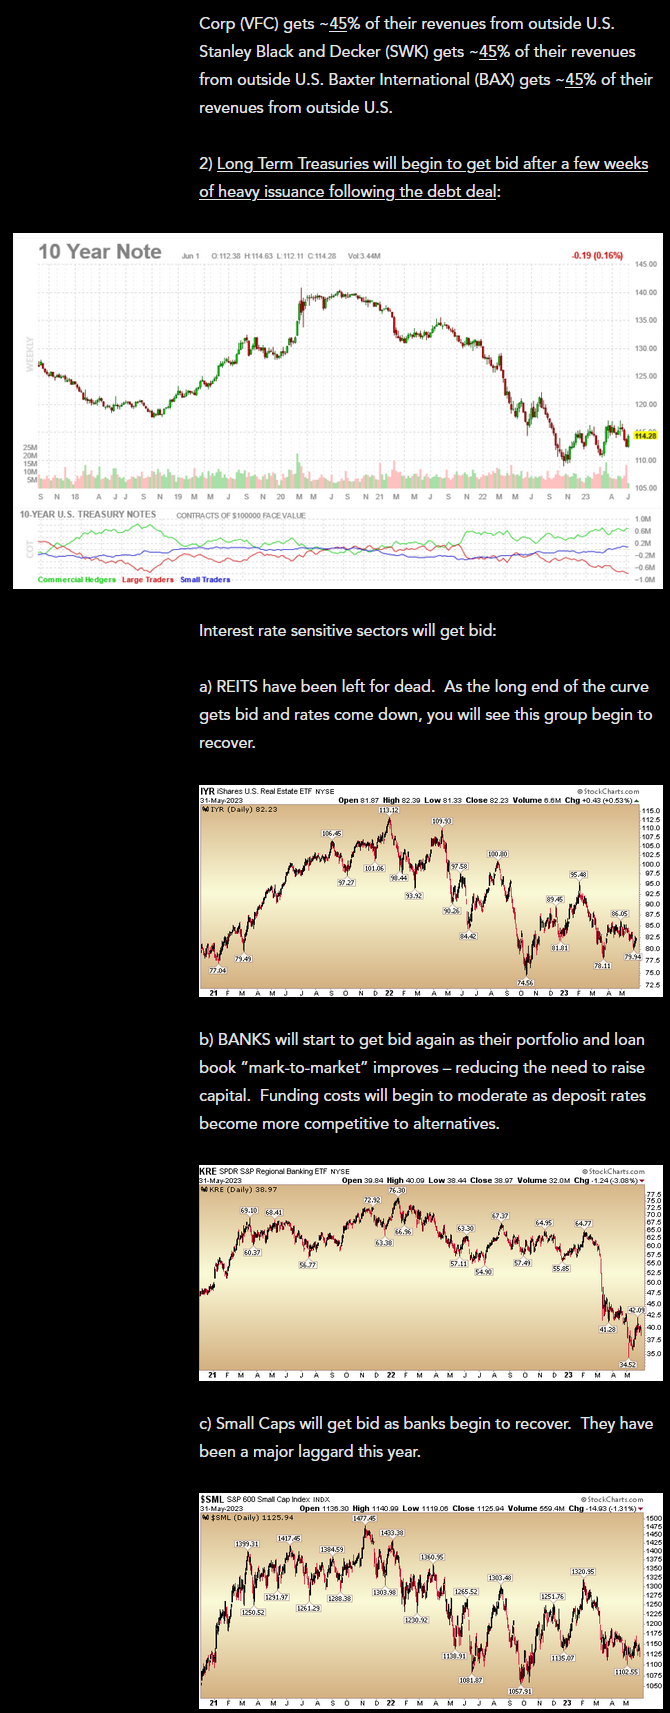
Last week we made the bold claim that we were on the cusp of a “sea change” and that a new group of stocks would start to outperform on a relative basis to the “magnificent 7” (tech names) that have driven the rally thus far:
So far that has played out in spades. Here is specifically what I said:
Here is what has happened to the names referenced (last week) in just 4 trading sessions (since):

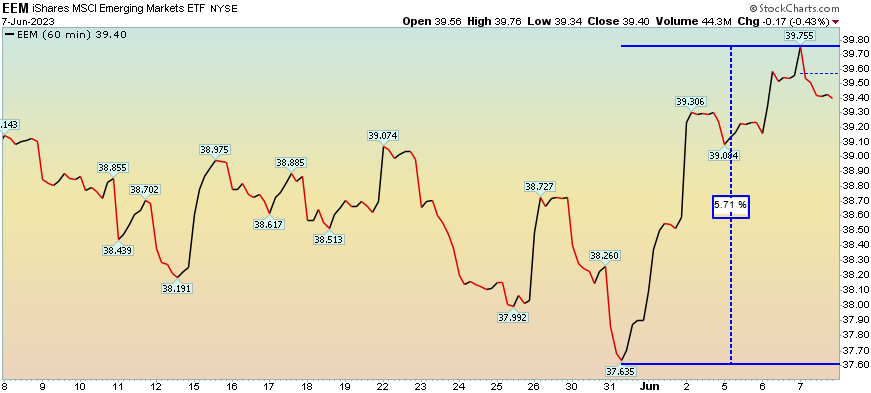
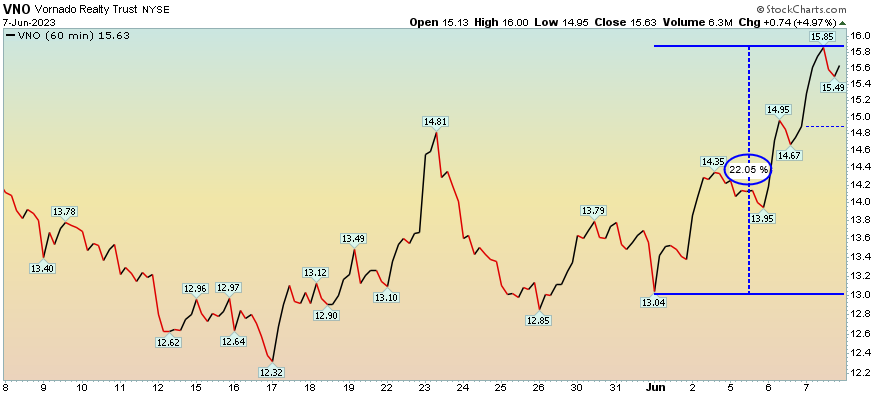
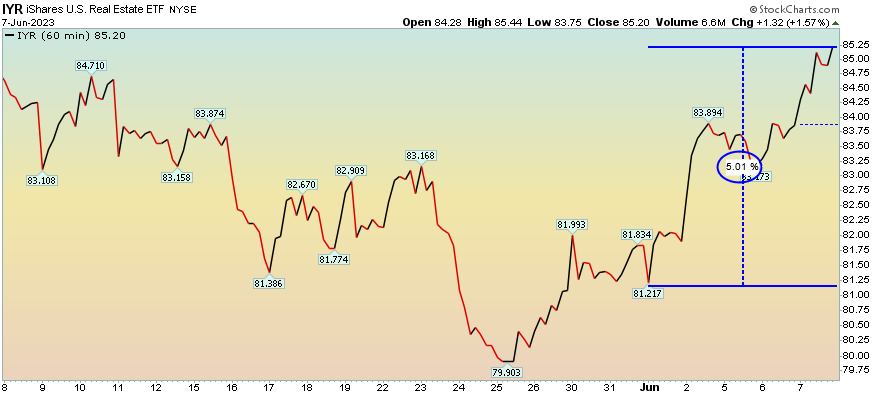
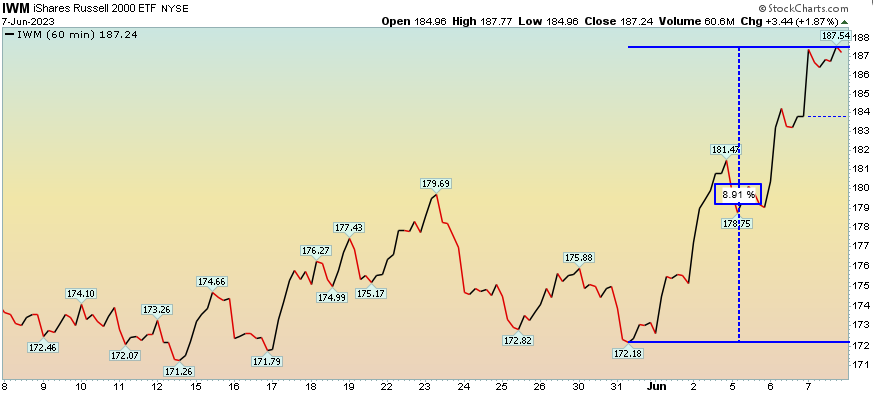
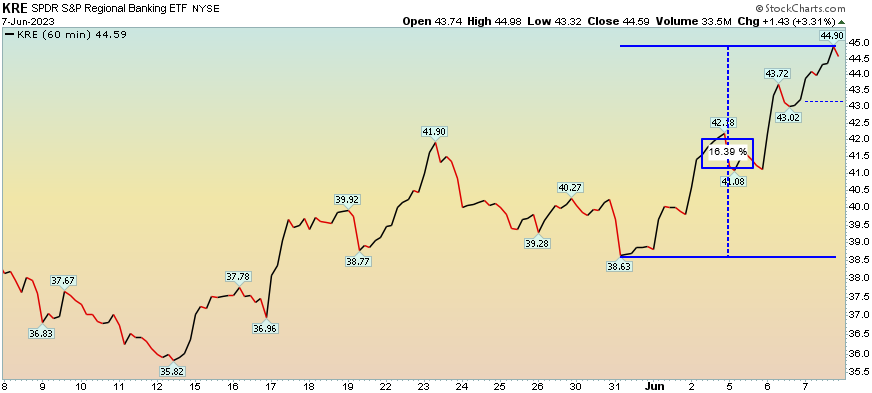
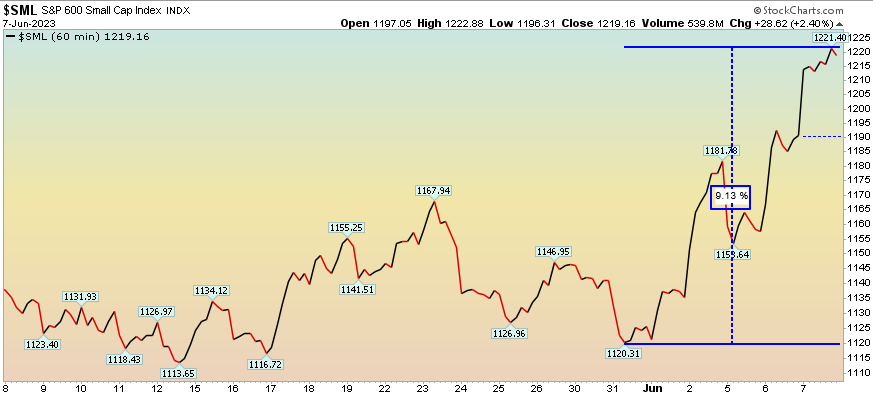
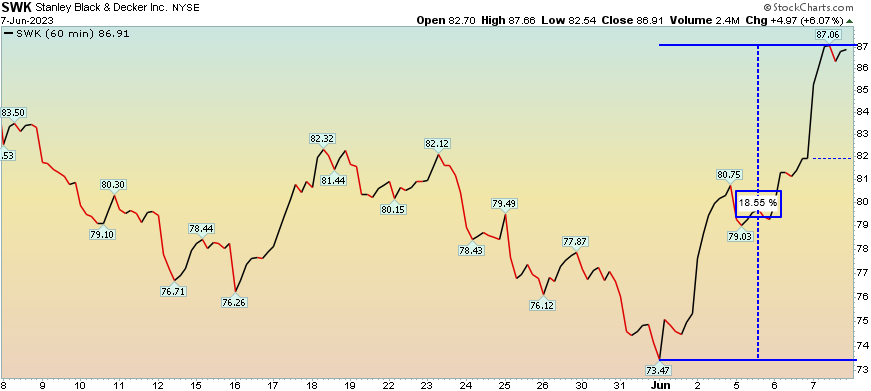
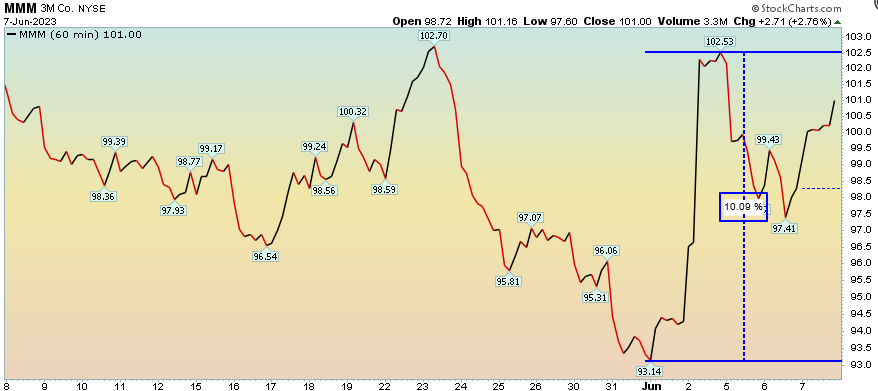
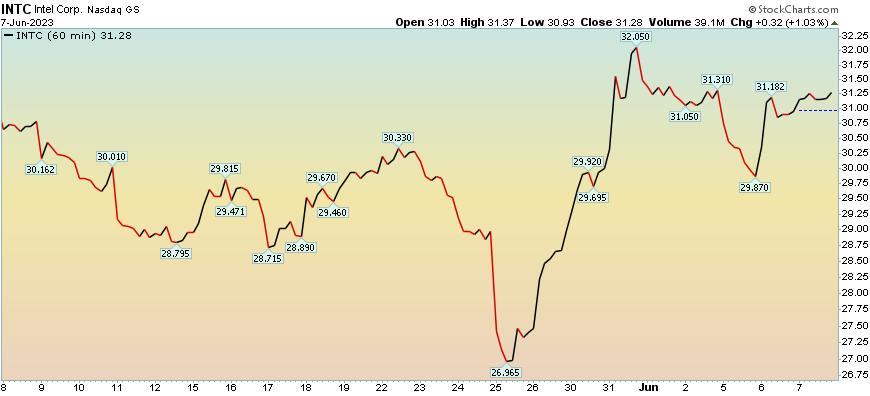
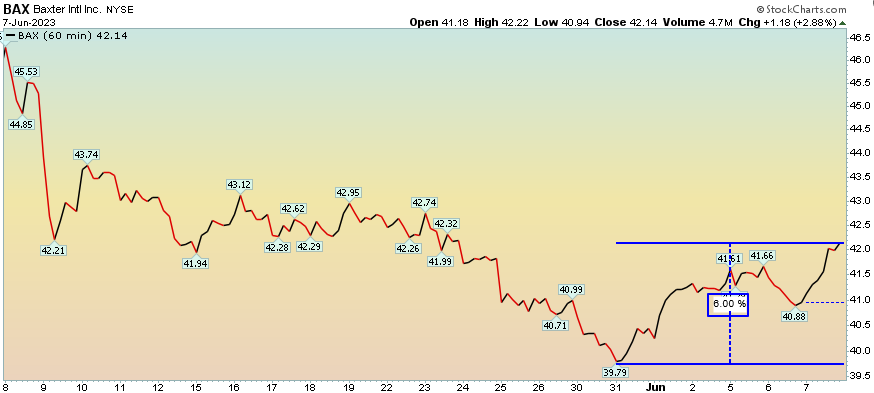
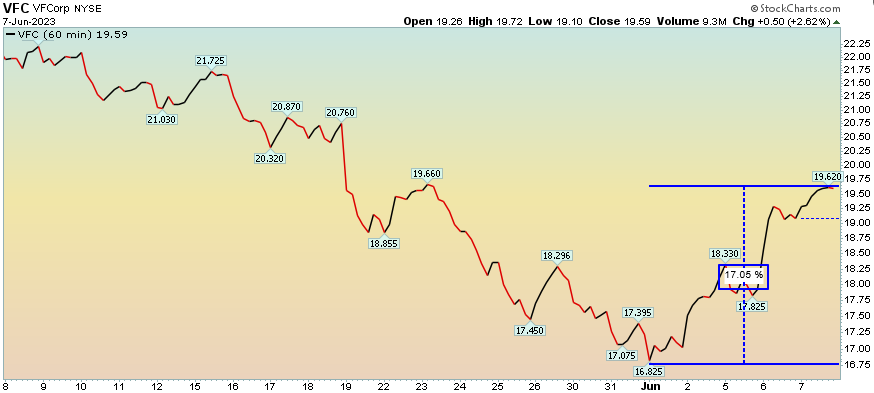
We expect these trends to persist in coming months. The “magic” will be found “under the surface” moving forward as many new groups will dramatically outperform the “magnificent 7” and the indices in general. It’s just beginning…
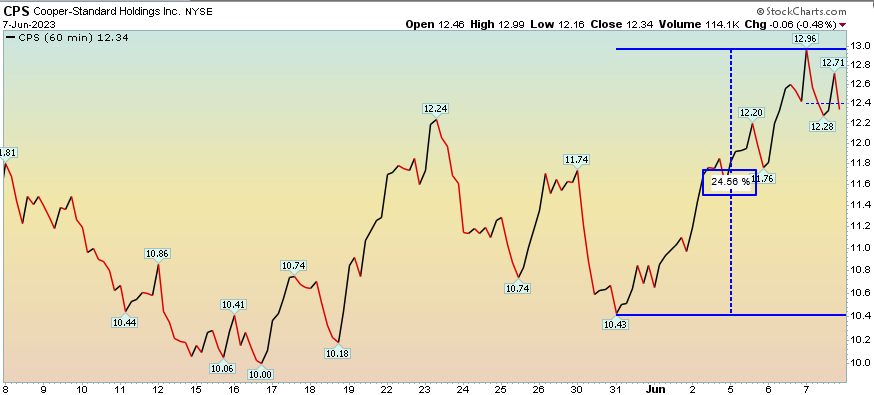
CPS Update
Cooper Standard CPS is now up over 100% since we disclosed it on our podcast|videocast in May and on the Claman Countdown (Fox Business) on June 7:
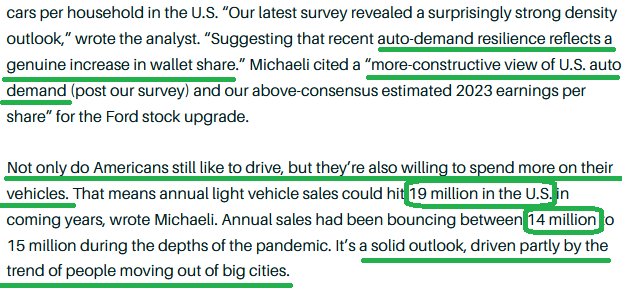
On Monday evening, Citi analyst Itay Michaeli upgraded Ford stock (ticker: F) to Buy from Hold. The following rationale he laid out (if it comes to bear) will be tremendous for CPS – as OEM volumes are the lifeblood to their profitability:
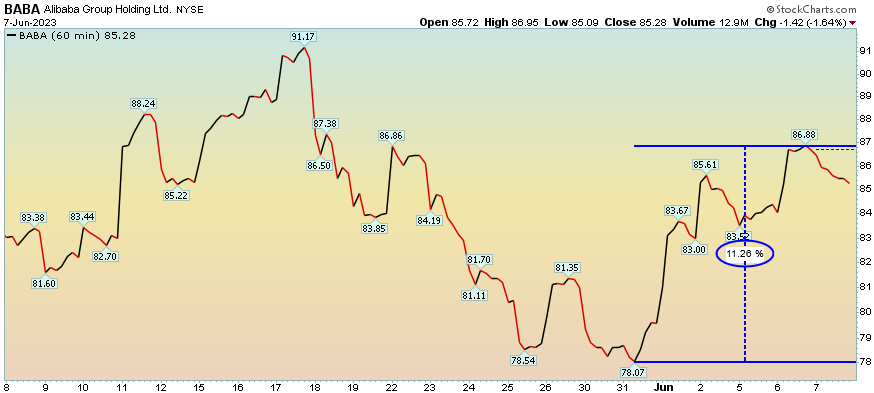
Alibaba Update
On Sunday, I posted this table from Mohnish Pabrai. It illustrates the magic of buybacks overtime – and more importantly – the exponential effect they can have the more the company shrinks the float:
How 10-BAGGERS can happen: This is an exceptionally important table by @MohnishPabrai h/t @QCompounding. In the case of @AlibabaGroup @BABA, with over $60B+ of net cash + generating $25B+ of FCF/yr, CEO Daniel Zhang could buy in at least 90%+ of the stock within 5 yrs and have… pic.twitter.com/Pa6rWkzCbr
— Thomas J. Hayes (@HedgeFundTips) June 4, 2023
With the company ipo’ing and spinning multiple divisions, there will be greater latitude to extract value for shareholders both from an economic and political standpoint (i.e. sometimes it pays to fly under the radar).
We do not expect a 10-Bagger out of Alibaba, but we do expect a multi-bagger over the next few years. We have discussed our estimates of fair value repeatedly on past podcast|videocast(s) as well as our SOTP (sum of the parts) overview here.
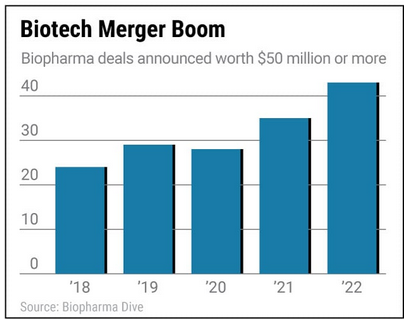
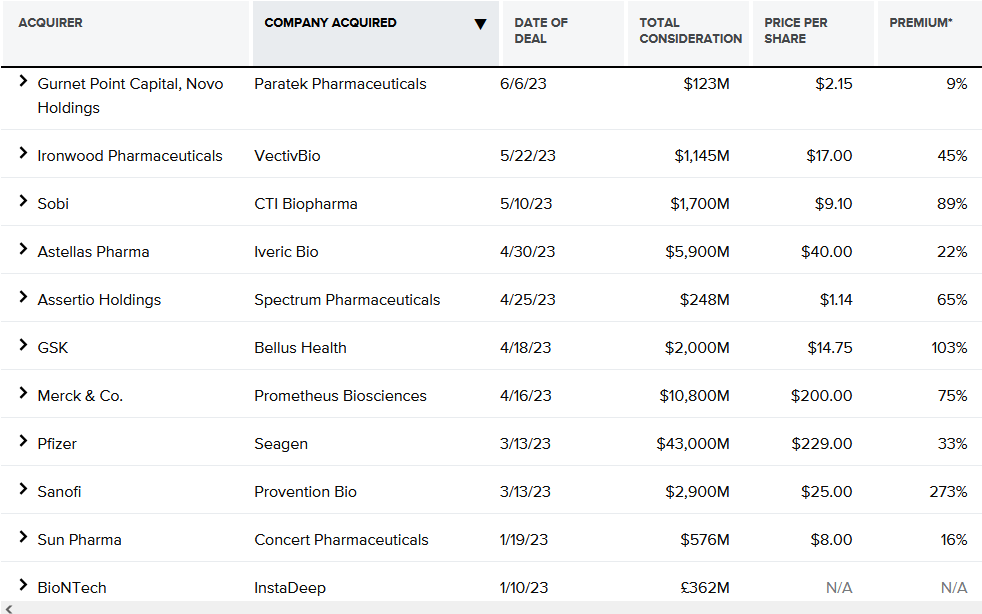
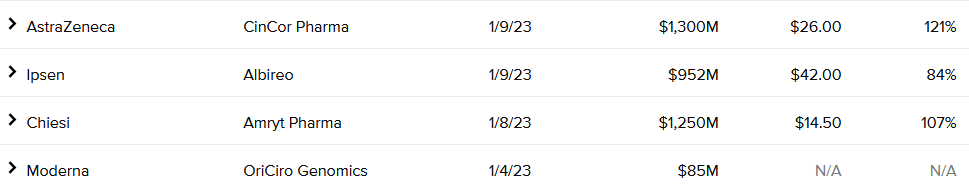
Biotech Update
The deals and drugs keep coming:
 Price is beginning to follow suit:
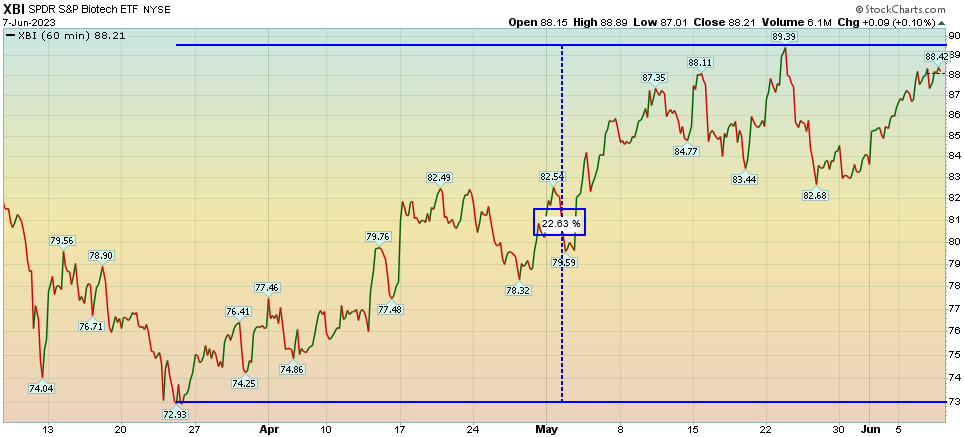
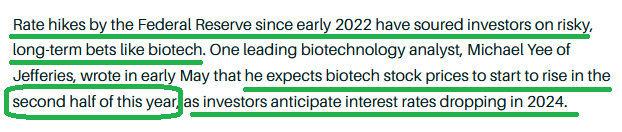
The recovery is just beginning:
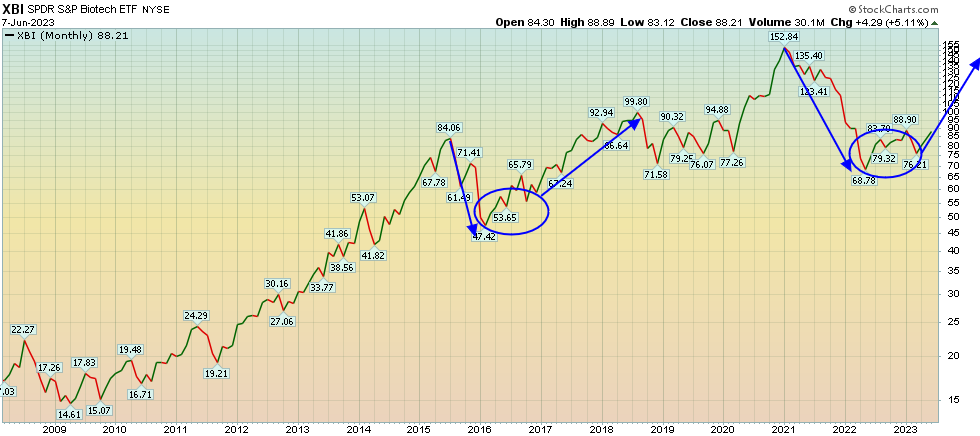
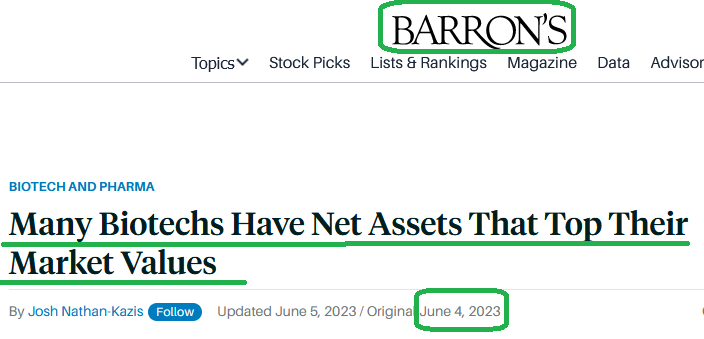
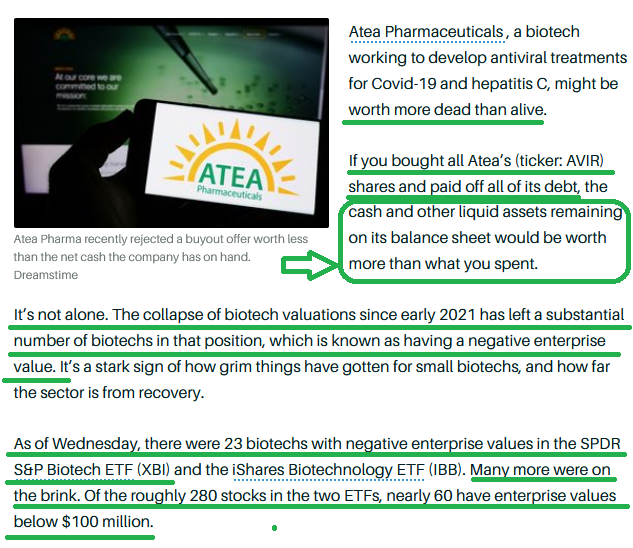
People are starting to figure out what we’ve been saying since last year:
Now onto the shorter term view for the General Market:
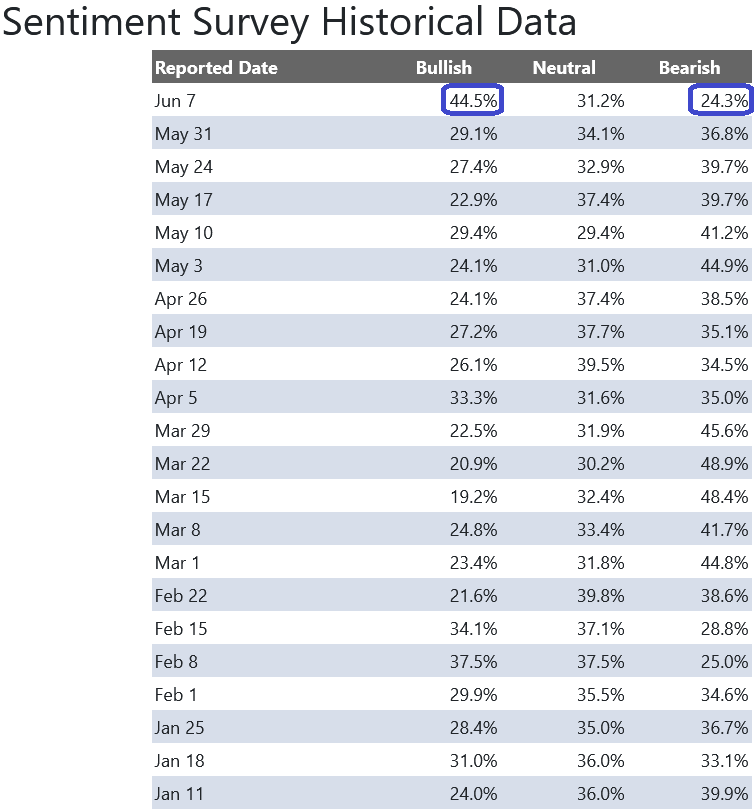
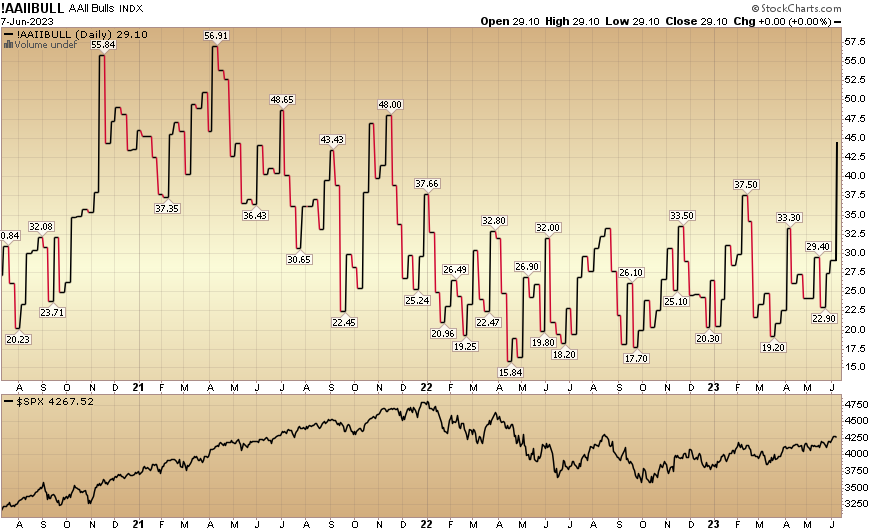
In this week’s AAII Sentiment Survey result, Bullish Percent (Video Explanation) jumped to 44.5% from 29.1% the previous week. Bearish Percent dropped to 24.3% from 36.8%. The retail investor is getting giddy with excitement. This can stay pinned for a while before they get taken out to the woodshed.
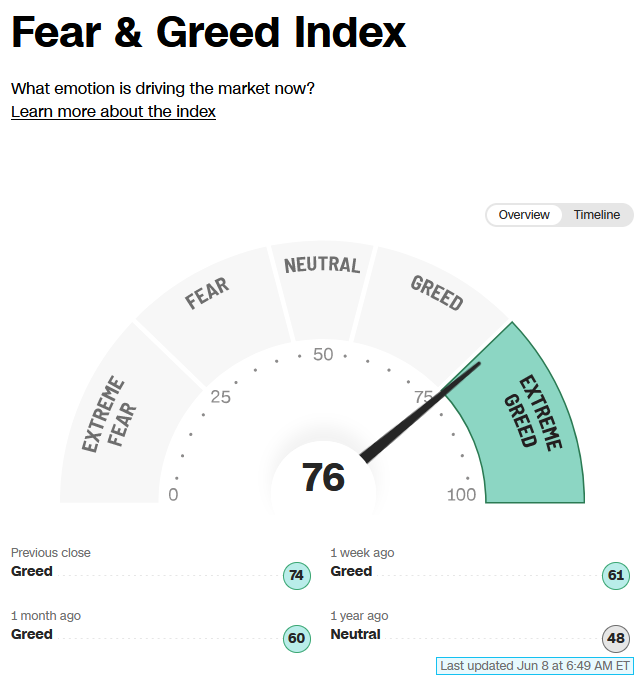
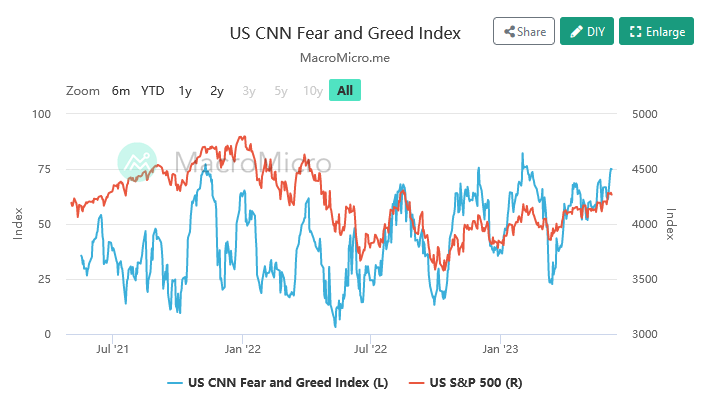
 The CNN “Fear and Greed” jumped from 61 last week to 76 this week. Sentiment is getting a bit hot but it would not surprise me if it stays pinned for a bit to force people out of their bunkers and back into the market. You can learn how this indicator is calculated and how it works here: (Video Explanation)
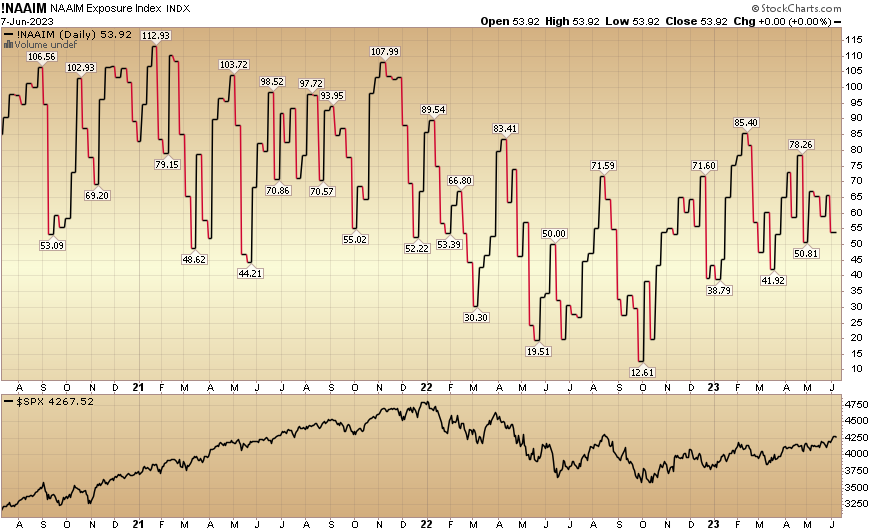
 And finally, the NAAIM (National Association of Active Investment Managers Index) (Video Explanation) dropped to 53.92% this week from 65.51% equity exposure last week. Managers will have to play catch-up or find a new vocation.
 Our podcast|videocast will be out late today or tomorrow. Each week, we have a segment called “Ask Me Anything (AMA)” where we answer questions sent in by our audience. If you have a question for this week’s episode, please send it in at the contact form here.
*Opinion, not advice. See “terms” above.


