

There’s an old maxim, “the secret to happiness is low expectations.” This saying could not apply more directly than to what we are seeing coming into the Q2 earnings season.
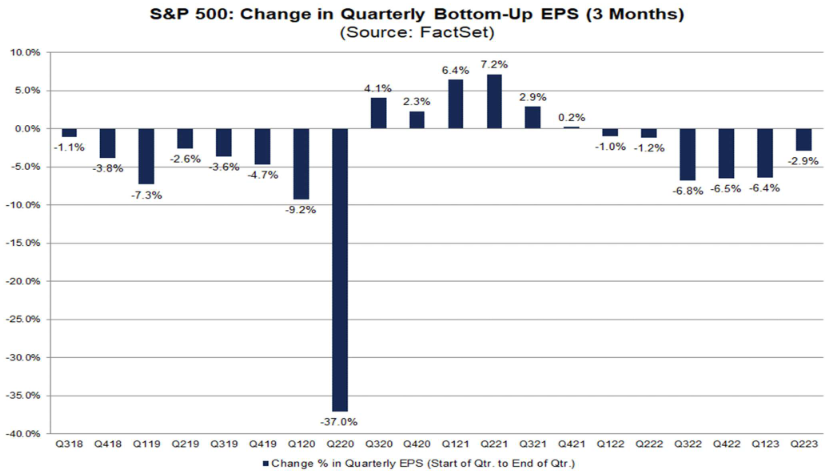
With consensus expectations looking as pessimistic as they were going into Q1 earnings season, the stage is set for another series of positive upside surprises. While Q1 earnings expectations were for ~(-6.6%) at the beginning of the season, they finished ~(-2.0%) by the end – shattering expectations to the upside and forcing analysts to begin modest upward revisions.
Q2 earnings season – which starts next week – may prove to be a replay of Q1. Set the expectations bar LOW (currently -6.8% estimated) and hop, skip and jump over the very low bar, forcing analysts to panic upgrade and PM’s to chase up with leverage.
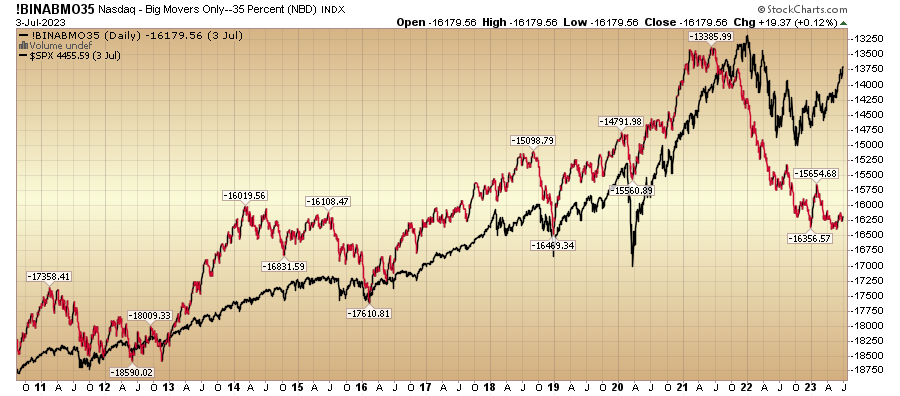
There is one pocket of the market where expectations are currently set HIGH relative to the market in aggregate (where pessimism prevails). This group is the AI related stocks and tech/”magnificent 7.” They have outperformed in 1H on the basis of these lofty expectations being fulfilled in the near term, but in our view – the likelihood is that this “new industry” emergence will take time. That does not mean the earnings of the “magnificent 7” will be bad, it simply means we expect the relative out-performance of this group in 2H will pale in comparison to their relative out-performance in 1H. It also doesn’t mean they will do poorly or “crash,” but it is our expectation that the remaining 93% of the S&P will start to catch a bid as managers who missed the gains in 1H start to play “catch up” by buying laggards they have NOT missed.
In Q2, analysts lowered estimates for the quarter by 2.9%. This is lower than the average intra-quarter lowering of 3.4% over the past 5 years.
FactSet:
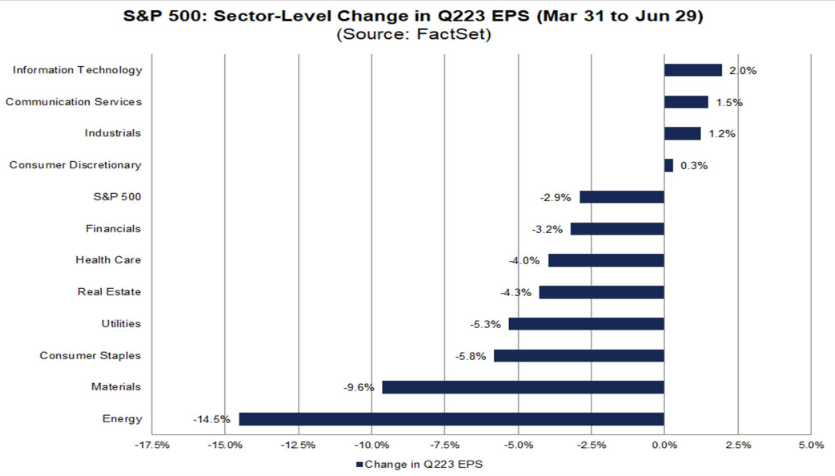
The Energy sector has recorded the largest percentage decrease in estimated (dollar-level) earnings of all eleven sectors since the start of the quarter at -12.5% (to $33.7 billion from $38.5 billion). As a result, the estimated (year-over-year) earnings decline for this sector has increased to -47.3% today from -39.8% on March 31.
The Materials sector has recorded the second-largest percentage decrease in estimated (dollar-level) earnings of all eleven sectors since the start of the quarter at -8.3% (to $14.2 billion from $15.5 billion). As a result, the estimated (year-over-year) earnings decline for this sector has increased to -30.6% today from -24.3% on March 31.
The Information Technology sector has recorded the largest percentage increase in estimated (dollar-level) earnings of all eleven sectors since the start of the quarter at 2.3% (to $83.4 billion from $81.5 billion). As a result, the estimated (year-over-year) earnings decline for this sector has fallen to -3.7% today from -5.9% on March 31.
The Consumer Discretionary sector is expected to report the highest (year-over-year) earnings growth rate of all eleven sectors at 26.1%. At the company level, Amazon.com is expected to be the largest contributor to earnings growth for the sector. If this company were excluded, the expected earnings growth rate for the sector would fall to 5.5% from 26.1%.
The Communication Services sector is expected to report the second-largest (year-over-year) earnings growth rate of all eleven sectors at 12.6%. At the company level, Warner Bros., Discovery and T-Mobile are predicted to be the largest contributors to earnings growth for the sector.
Target Price: The bottom-up target price for the S&P 500 is 4813.70, which is 9.5% above the closing price of 4396.44. At the sector level, the Energy (+22.0%) sector is expected to see the largest price increase, as this sector has the largest upside difference between the bottom-up target price and the closing price. On the other hand, the Consumer Discretionary (+4.4%) and Information Technology (+4.8%) and sectors are expected to see the smallest price increases, as these two sectors have the smallest upside differences between the bottom-up target price and the closing price.
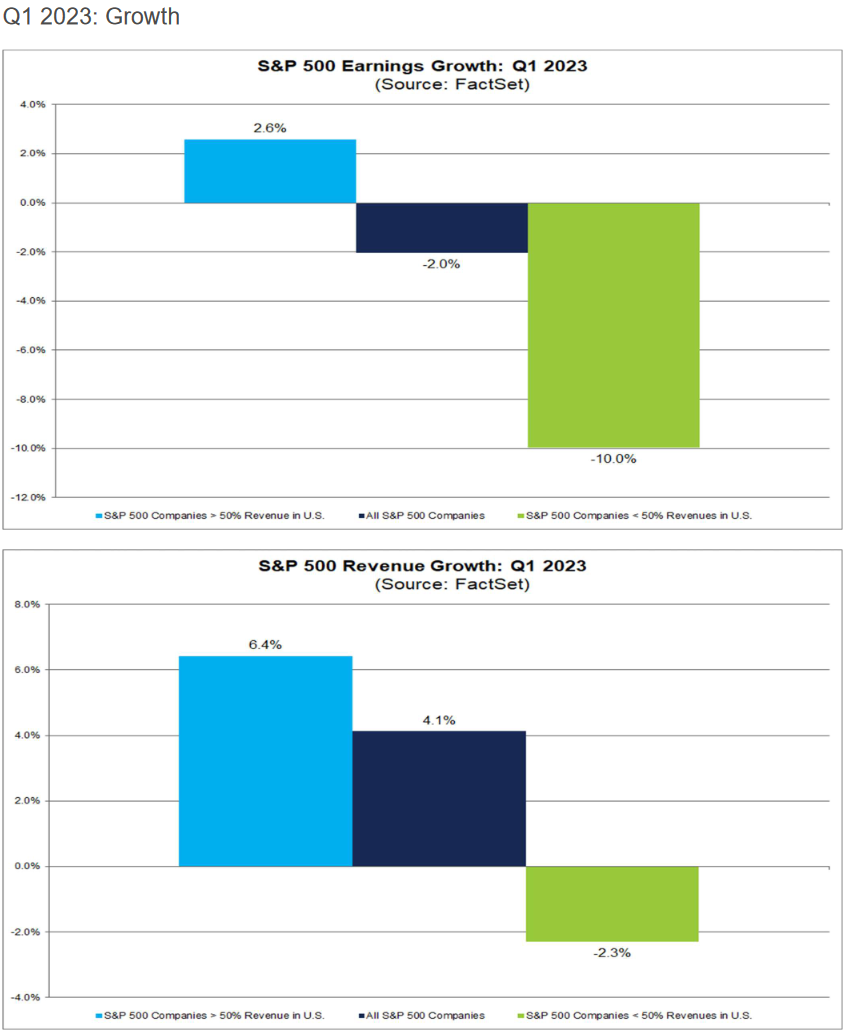
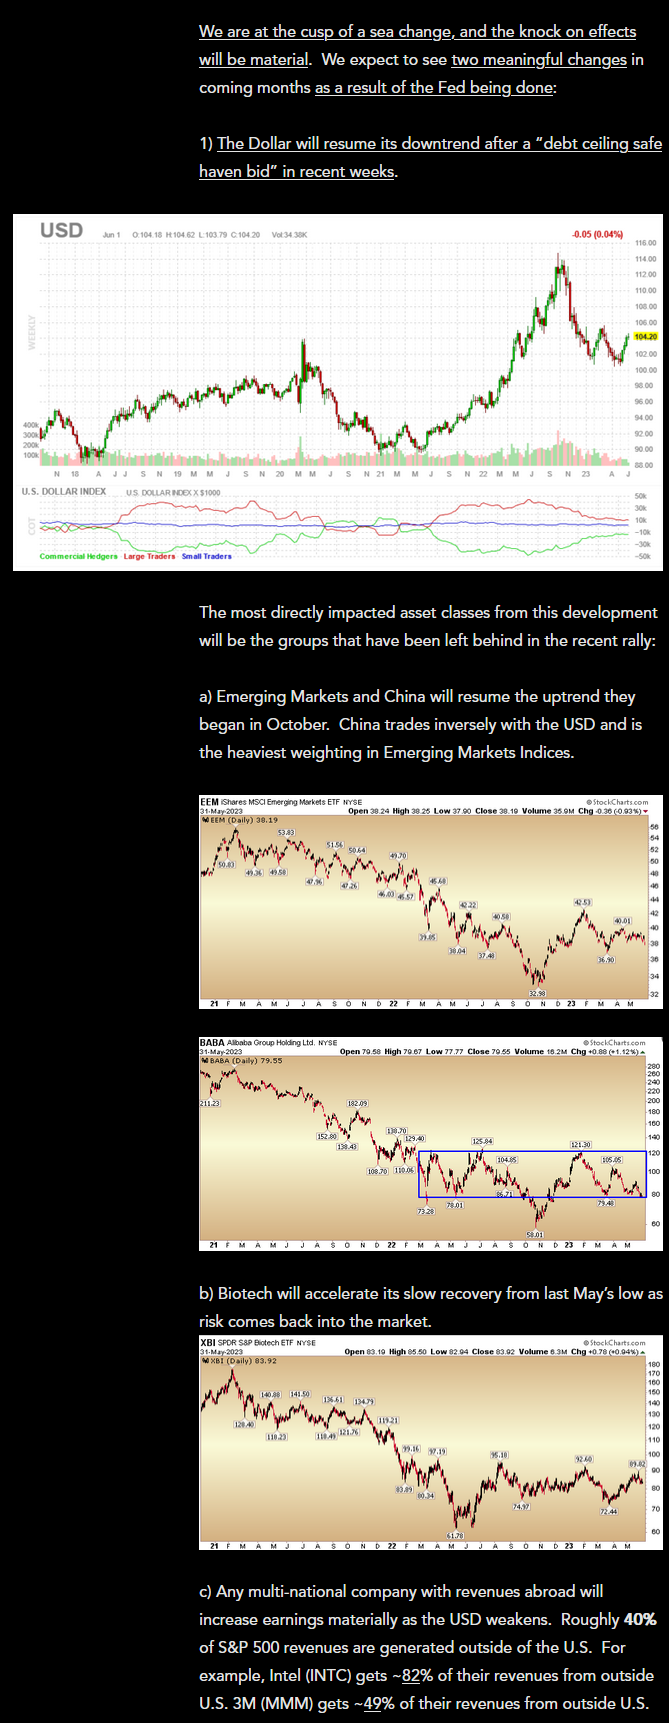
As we have stated in previous notes and media appearances, besides Emerging Markets being a major beneficiary of a resumption of the downtrend in the US Dollar in 2H, multi-nationals with >50% of their revenues abroad will get have an enormous tailwind moving forward just as they had a headwind in the rear-view mirror:
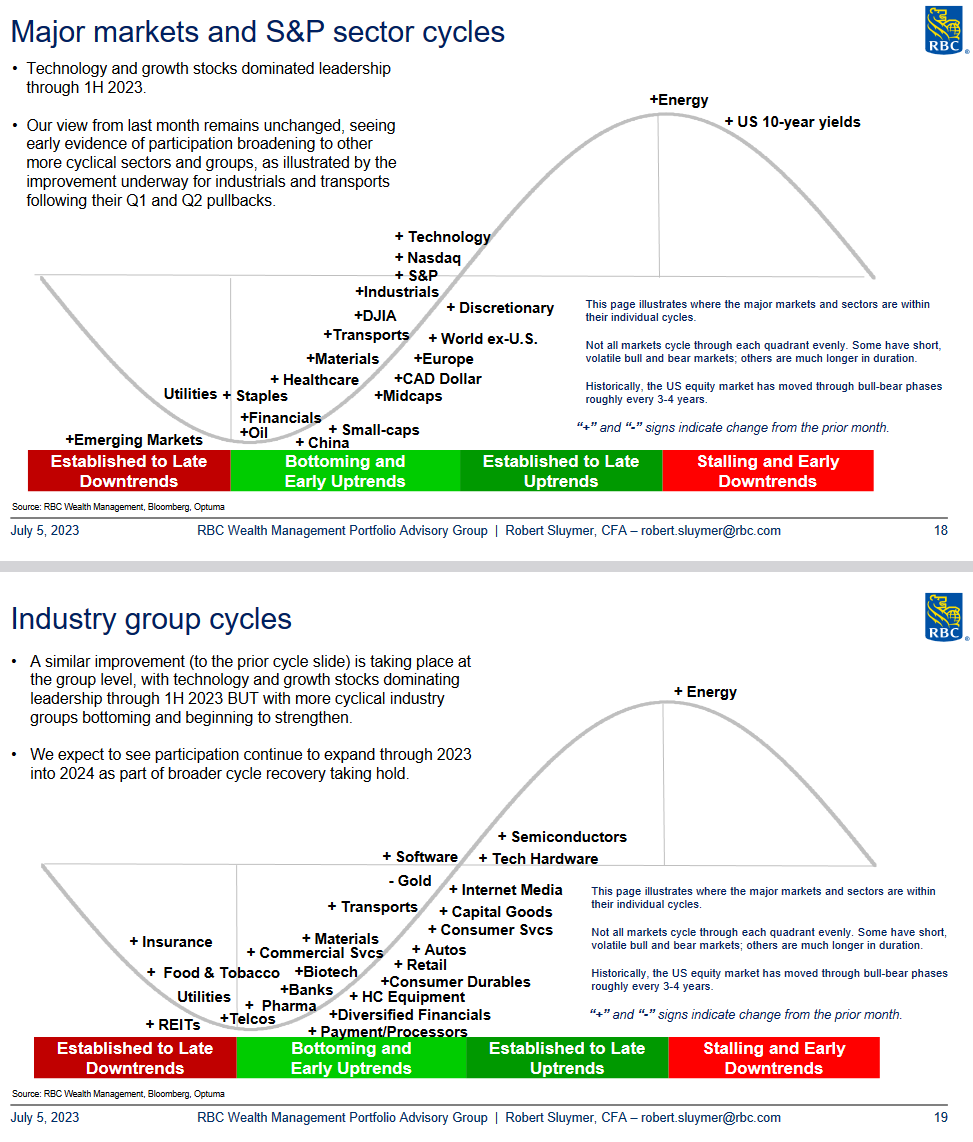
On June 1, we laid out the case that we were on the cusp of a “sea change” and we would see the following sectors begin to participate:
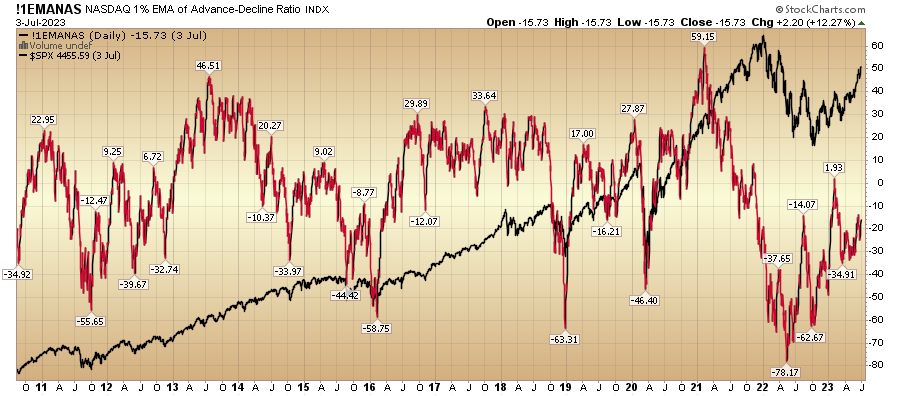
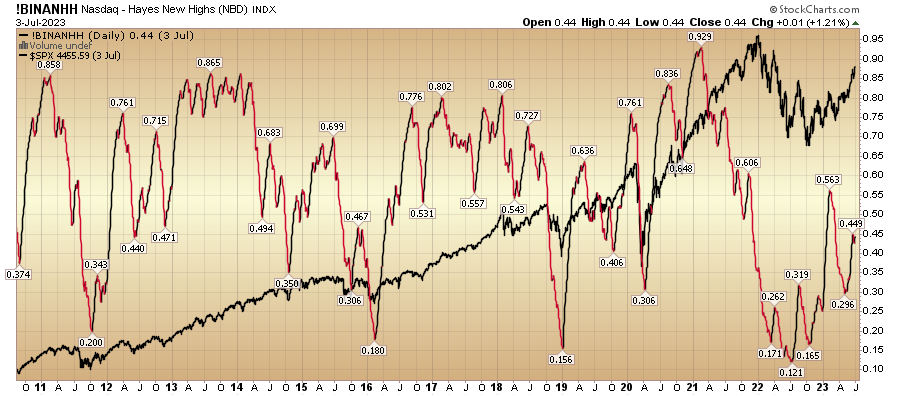
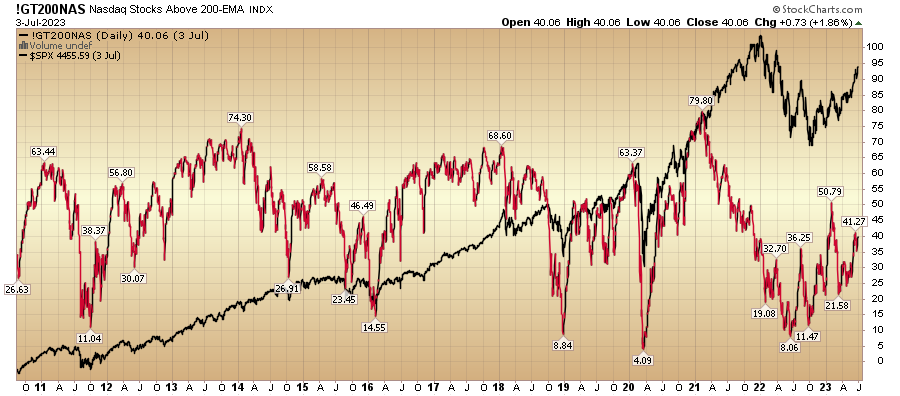
While this move began in earnest in the month of June with REITS and Small Caps leading the way, the remainder of the thesis will play out through 2H. We pounded the table for Tech/Semi’s in late fall and early winter 2022 when no one wanted them. They led the way in 1H and while we think tech will under-perform on a relative basis in 2H, we are NOT sellers. We are holders. Many of the indicators we consider show there is still upside in Tech until we reach extremes:


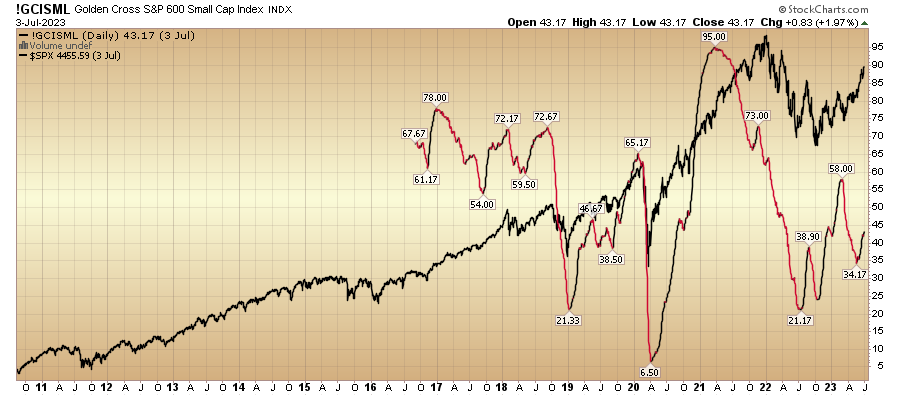
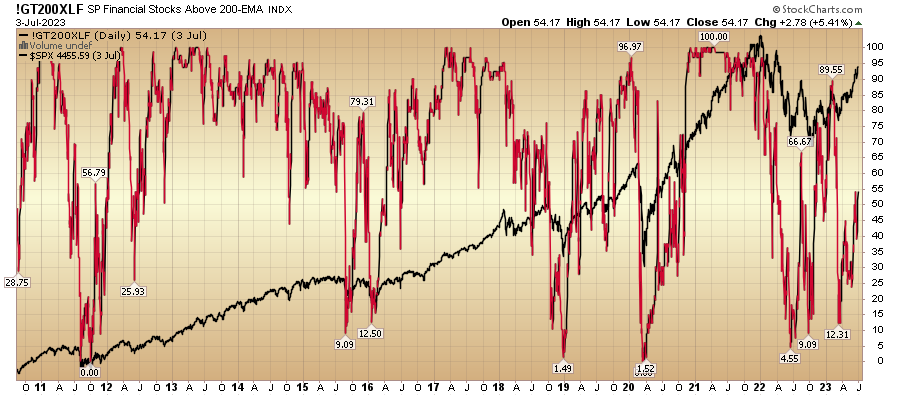
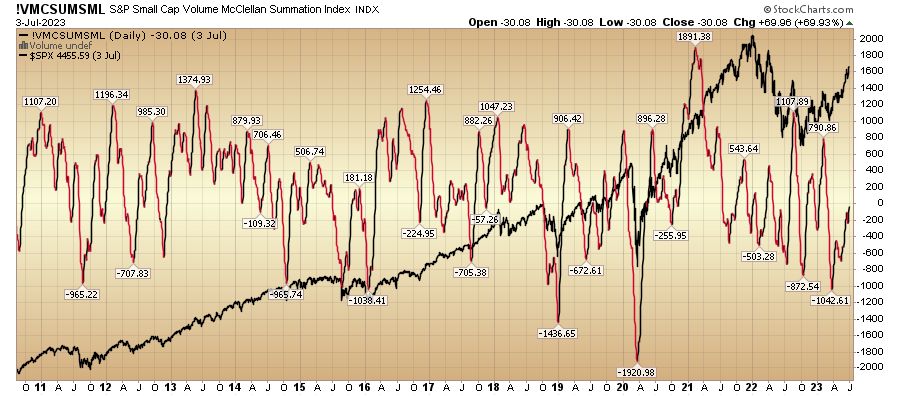
As for small caps starting to out-perform, understand one thing: For Small Caps to work, Banks have to work:
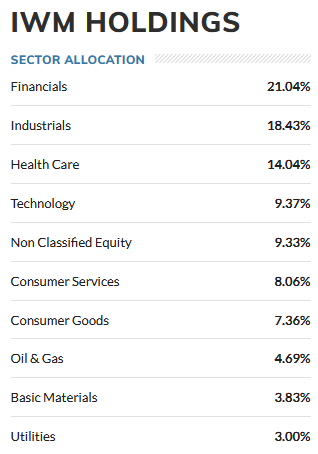
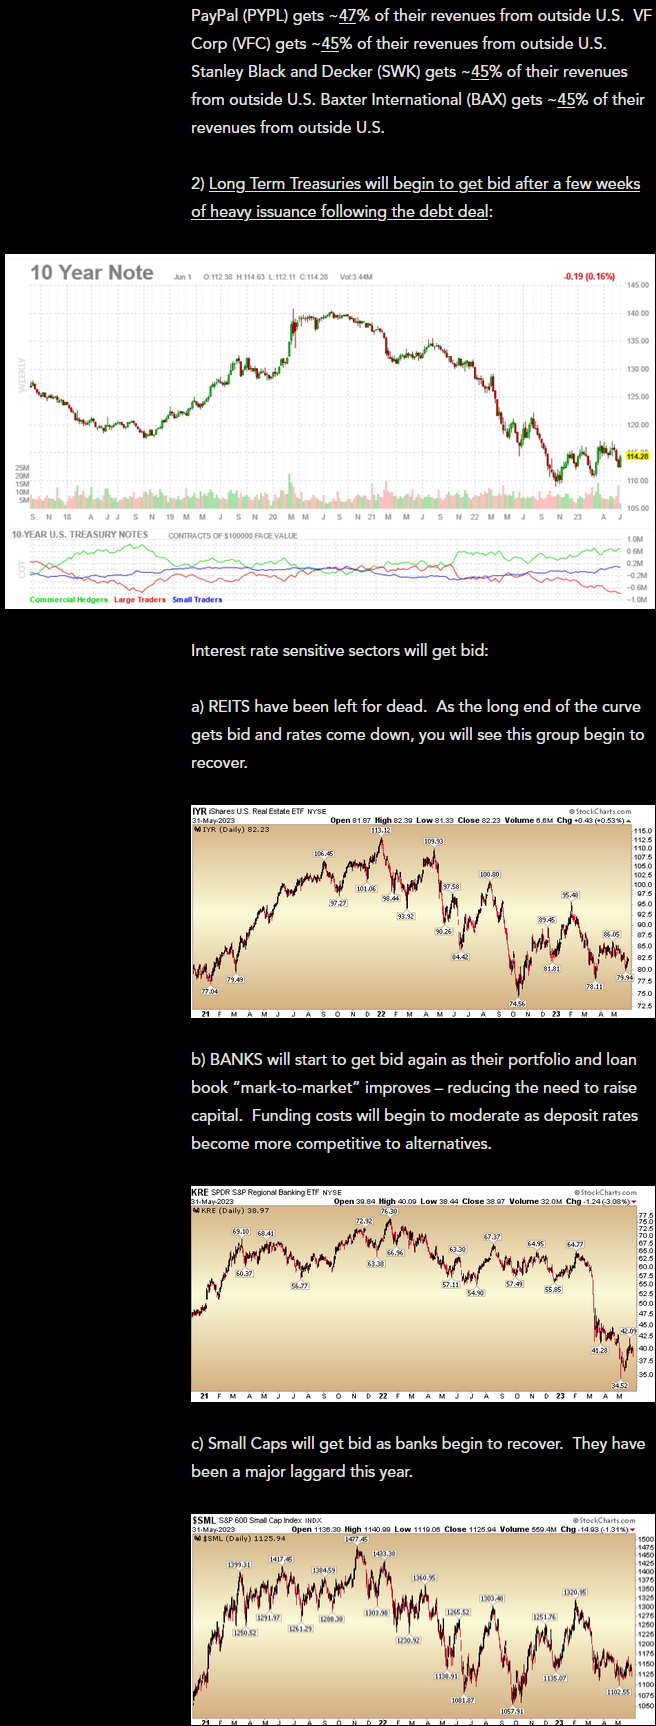
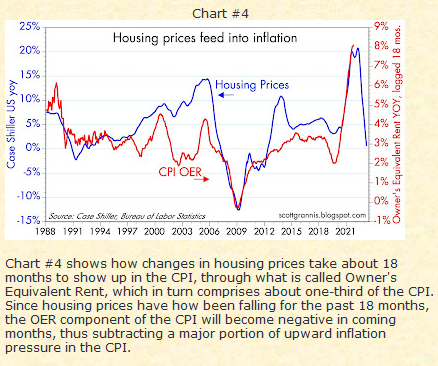
If we are correct that next week’s headline inflation print will surprise to the downside (mid to low 3’s handle), the Fed will be done, USD will go down and bonds will get bid (yields compress). A bid in bonds improves bank balance sheet marks, reduces default expectations, caps funding costs, and begins the yield curve normalization process.
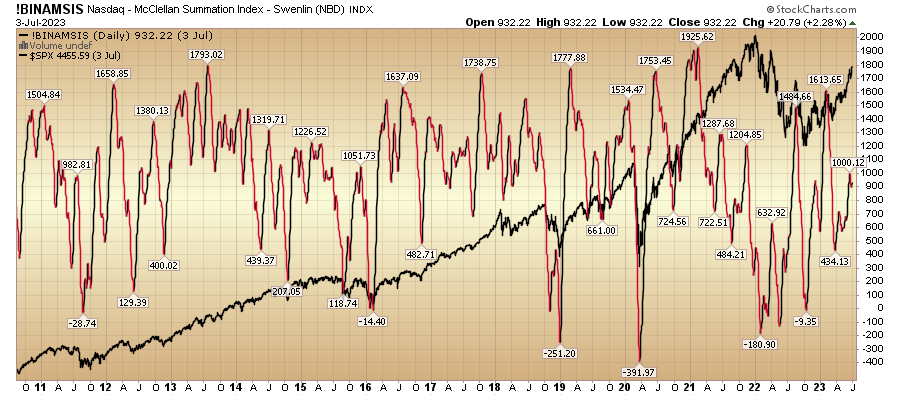
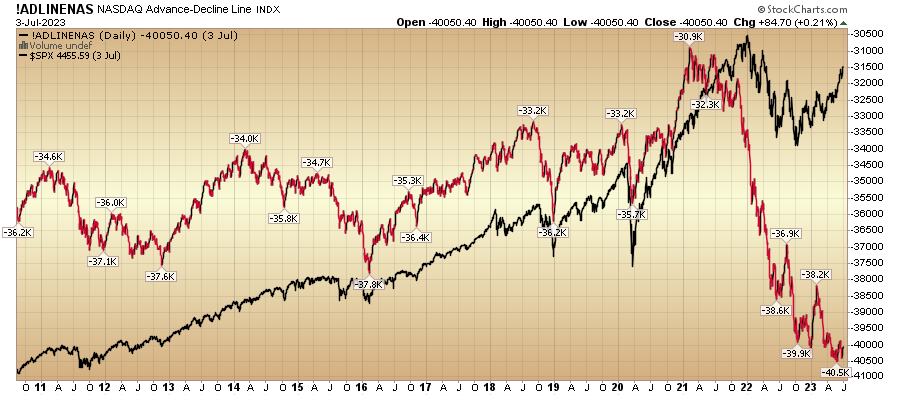
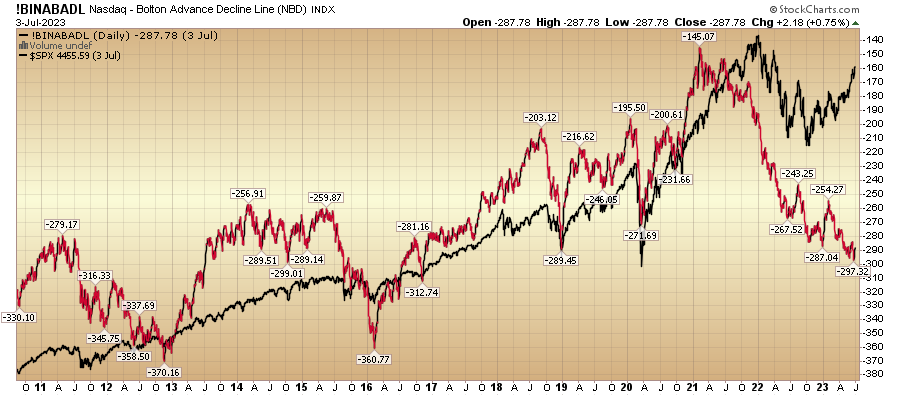
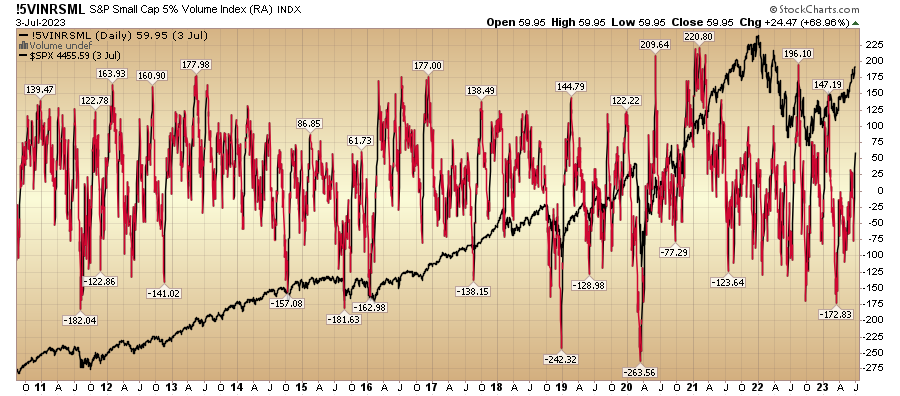
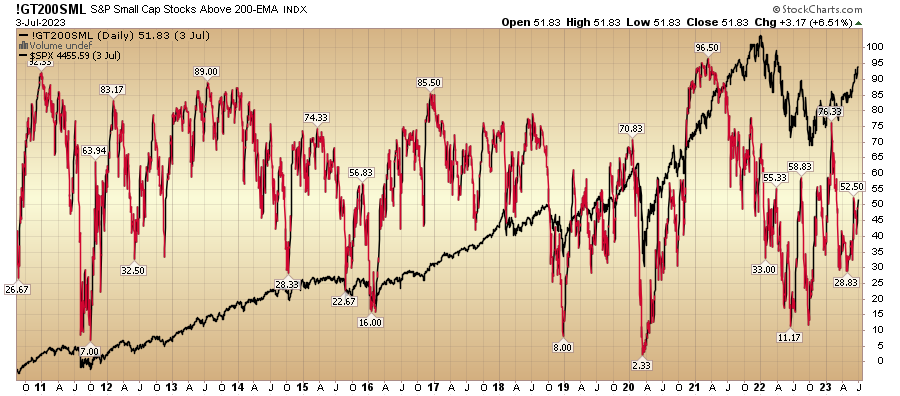
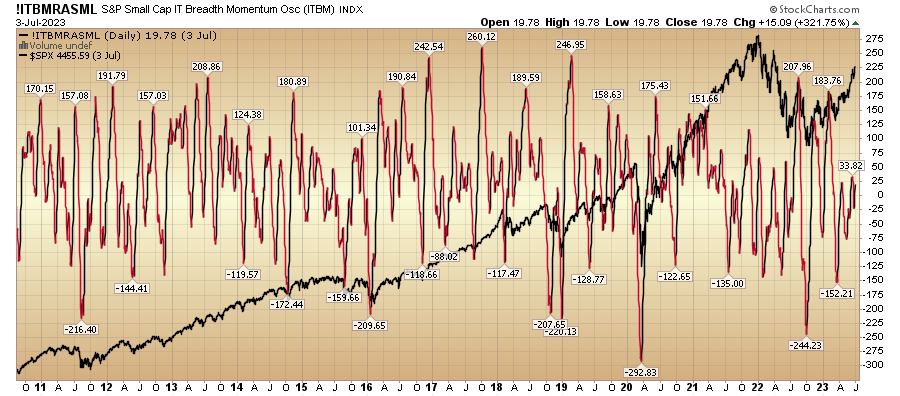
 Some indicators related to constructive small-cap outlook:

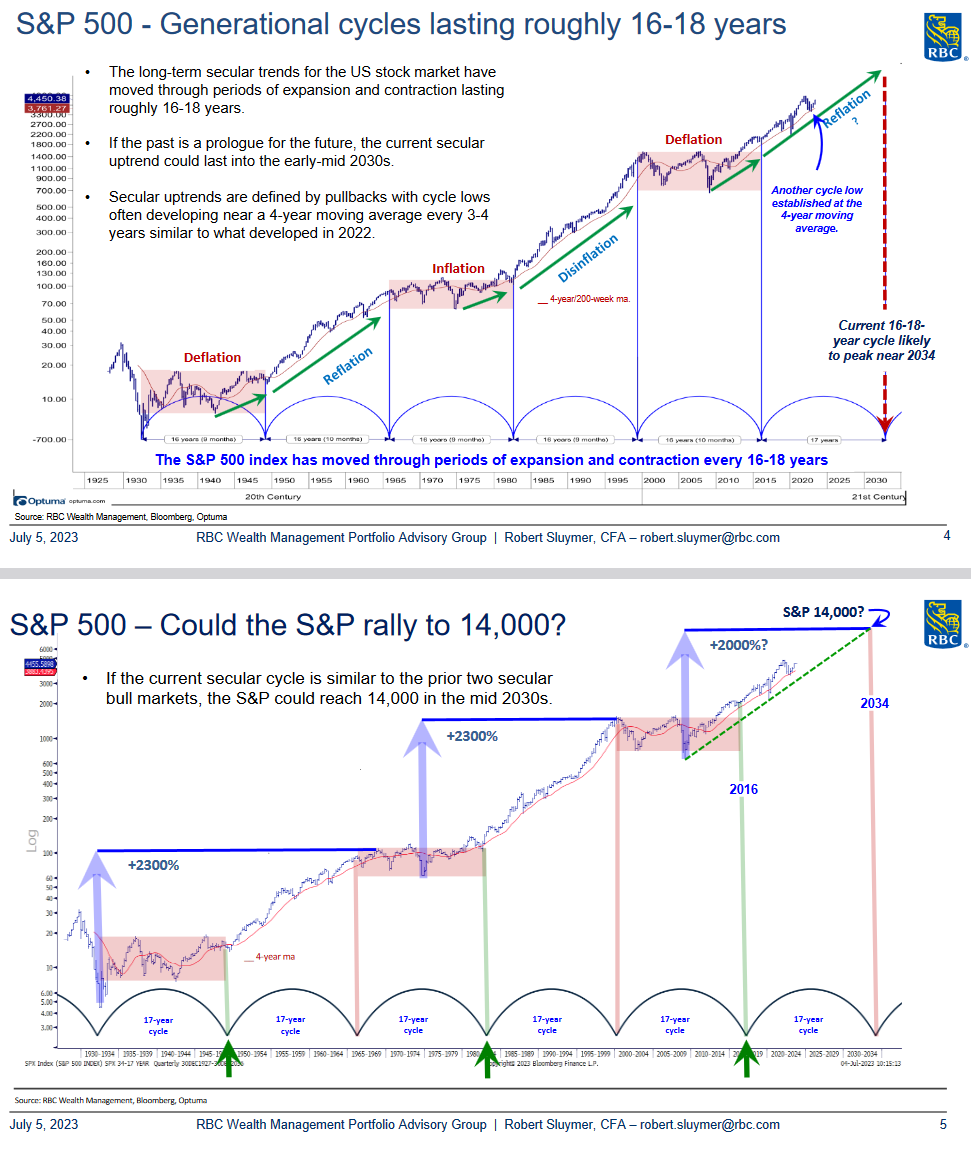
The Big Picture
While weekly commentary and outlook can be useful as it relates to individual companies and sector rotation, it’s important to zoom out and keep the “big picture” in mind:

China Update
Now onto the shorter term view for the General Market:
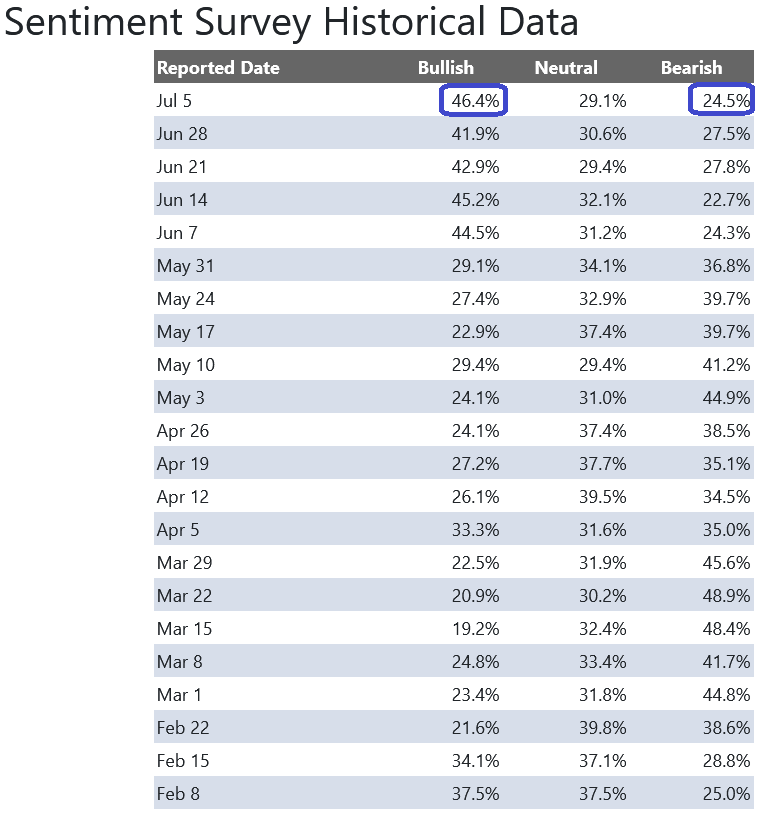
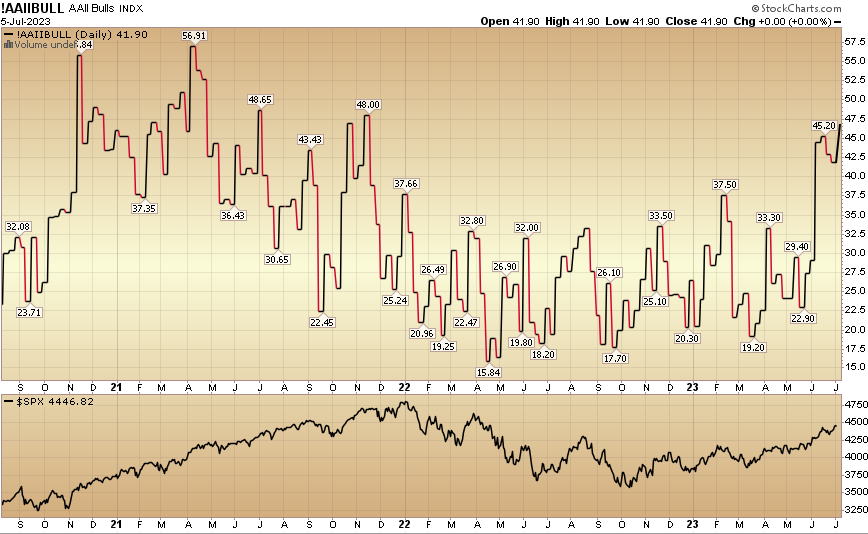
In this week’s AAII Sentiment Survey result, Bullish Percent (Video Explanation) jumped to 46.4% from 41.9% the previous week. Bearish Percent dropped to 27.5% from 24.5%. The retail investor is very optimistic. This can stay elevated for some time based on positioning coming into these levels, but we are watching it closely.
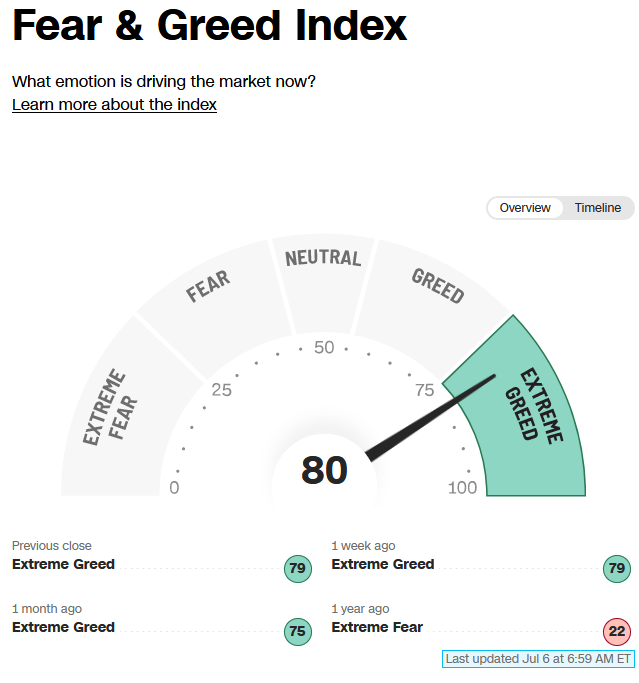
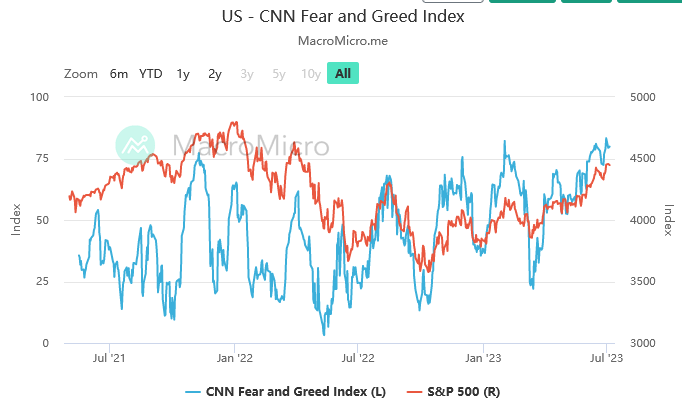
 The CNN “Fear and Greed” ticked up from 79 last week to 80 this week. Sentiment is hot but it would not surprise me if it stays pinned for a bit to force people out of their bunkers and back into the market. You can learn how this indicator is calculated and how it works here: (Video Explanation)
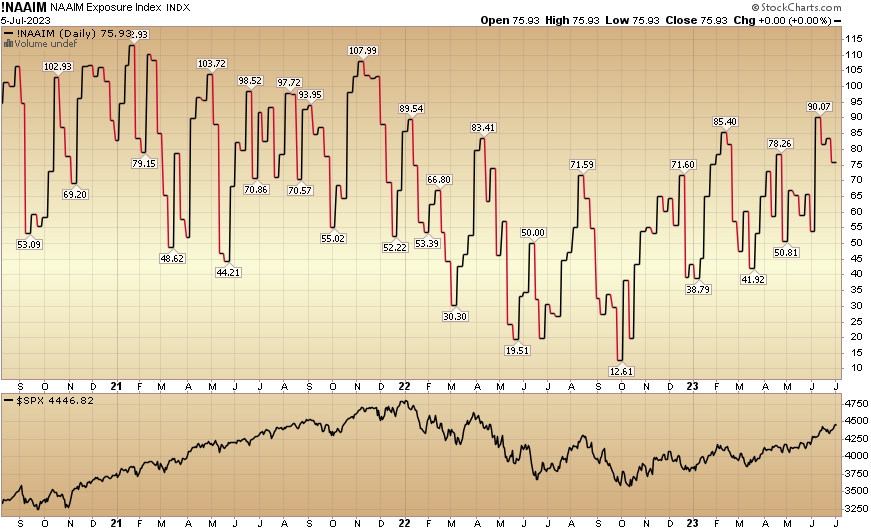
 And finally, the NAAIM (National Association of Active Investment Managers Index) (Video Explanation) dropped to 75.9% this week from 83.6% equity exposure last week. Managers have been chasing the rally.
 Our podcast|videocast will be out late today or tomorrow. Each week, we have a segment called “Ask Me Anything (AMA)” where we answer questions sent in by our audience. If you have a question for this week’s episode, please send it in at the contact form here.
*Opinion, not advice. See “terms” above.


