

This week we chose Yogi Berra’s famous quote, “It feels like deja vu all over again” to describe one aspect of the current market climate. This is in contrast to what many talking heads are saying about China in recent days (also a famous Yogi quote), “the future ain’t what it used to be!”
In October of 2018, China cracked down on its Online Gaming providers by stopping approvals of any new games. In similar fashion to its recent crackdown on Online Tutors/Education Providers, ALL China stocks were punished in response to the arbitrary crackdown and regulation. Here is a 2018 article from the Economist that chronicles the crash of Tencent in response to the crackdown:
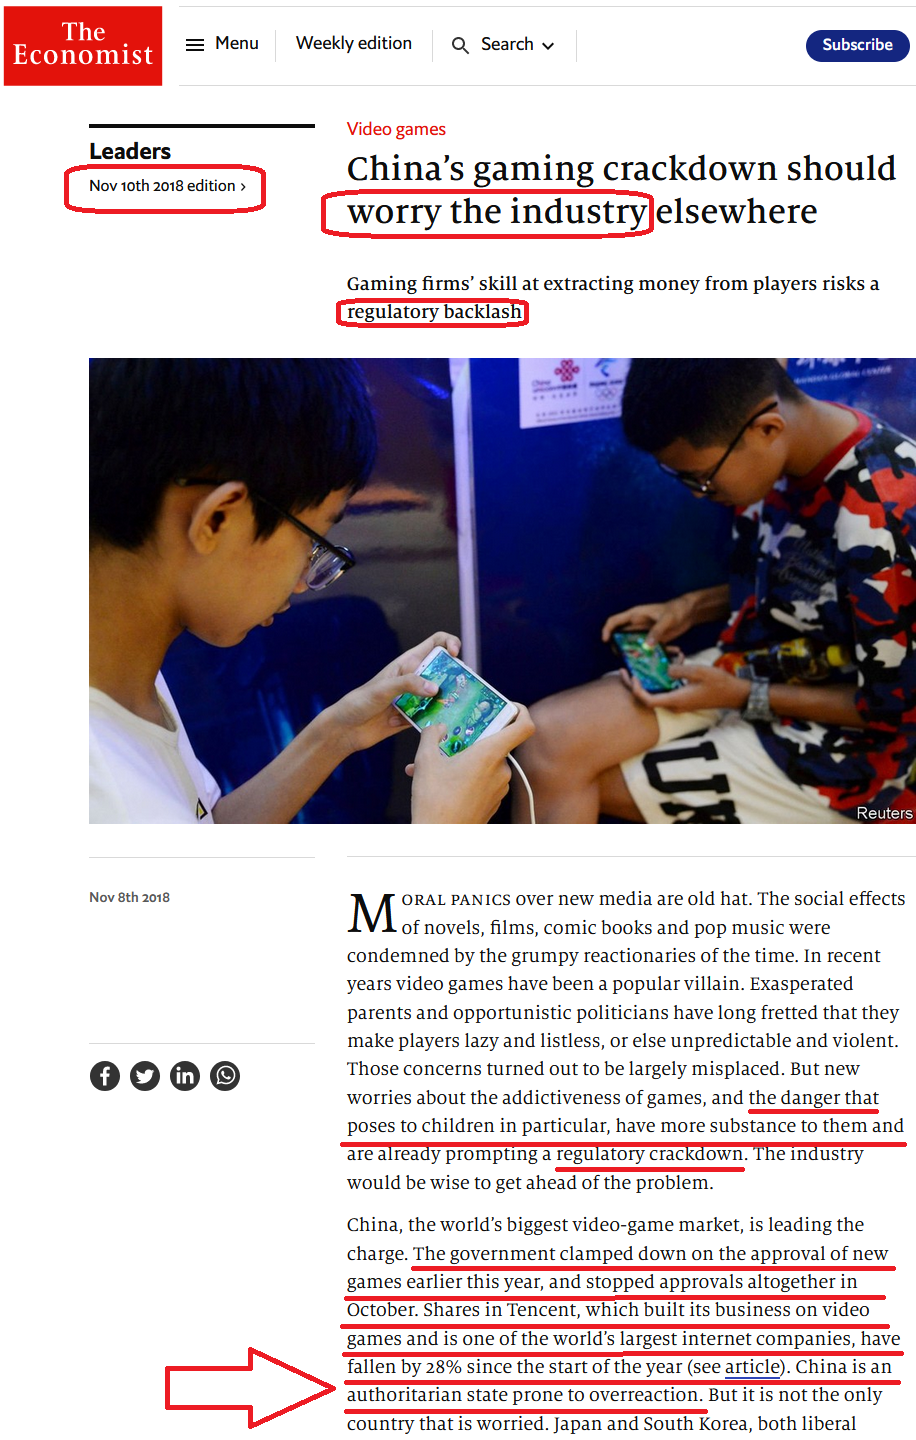
Here’s what happened next (see blue vertical line marking October 2018 “Crackdown”):
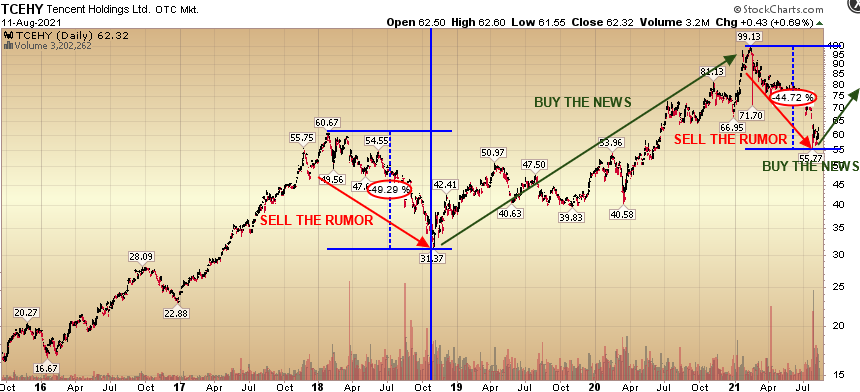
After falling ~50% over 9 months (anticipating a regulatory crackdown), Tencent rallied 62.5% over the next 6 months (after the crackdown), and 216% in just over 2 years.
Here’s a WSJ article written in October 2018 (after a 50% correction in NTES) anticipating the worst was yet to come. It marked the beginning of a 288% rally:
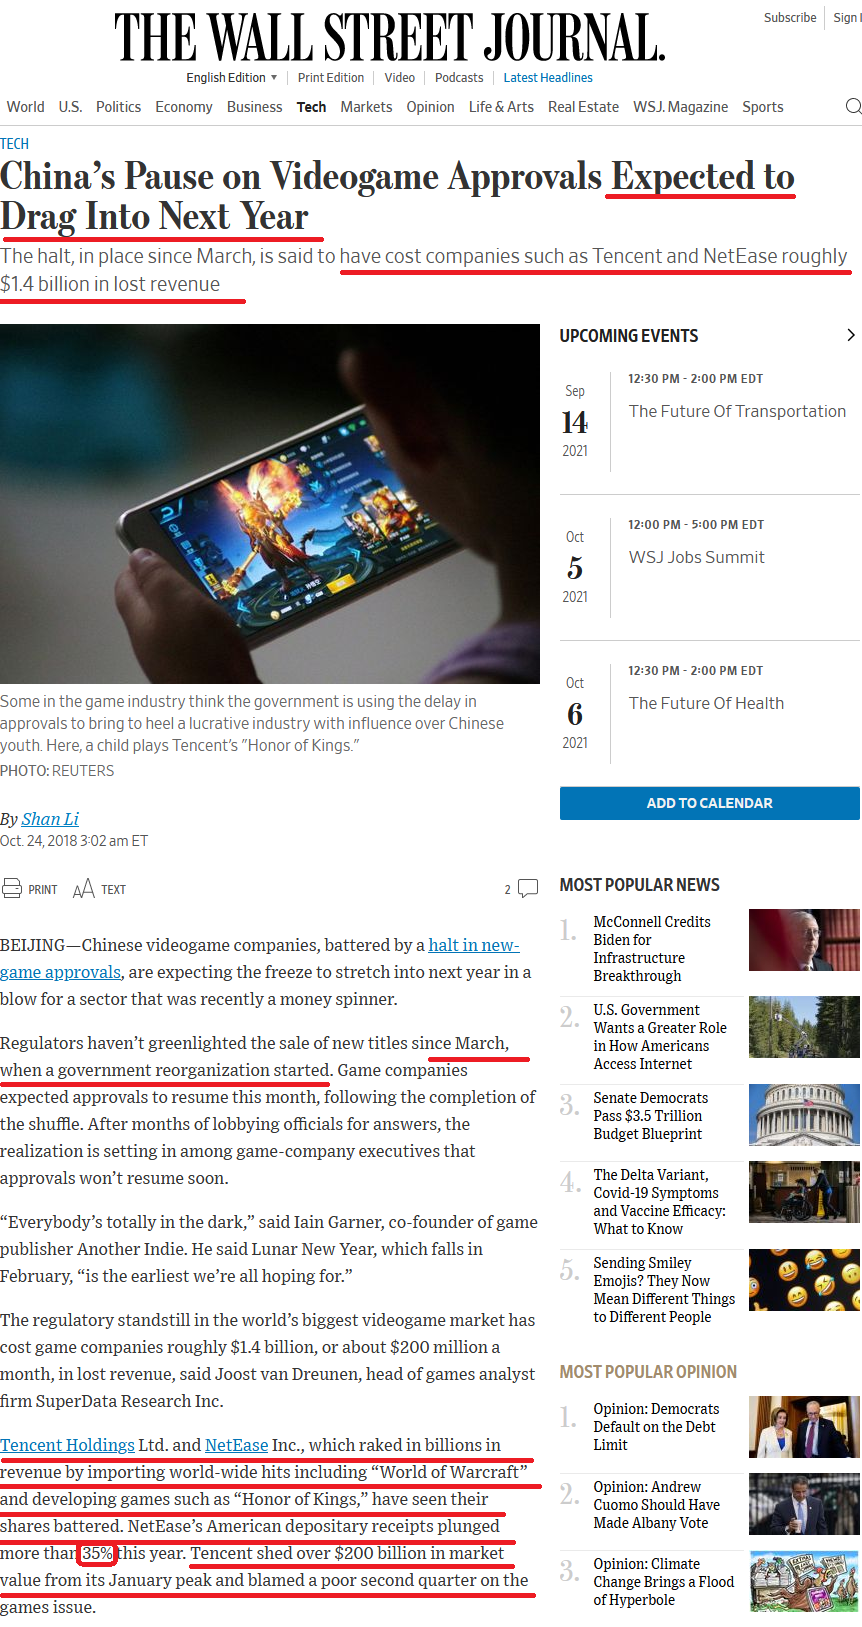 Here’s what happened to NetEase over the same period (and afterward):
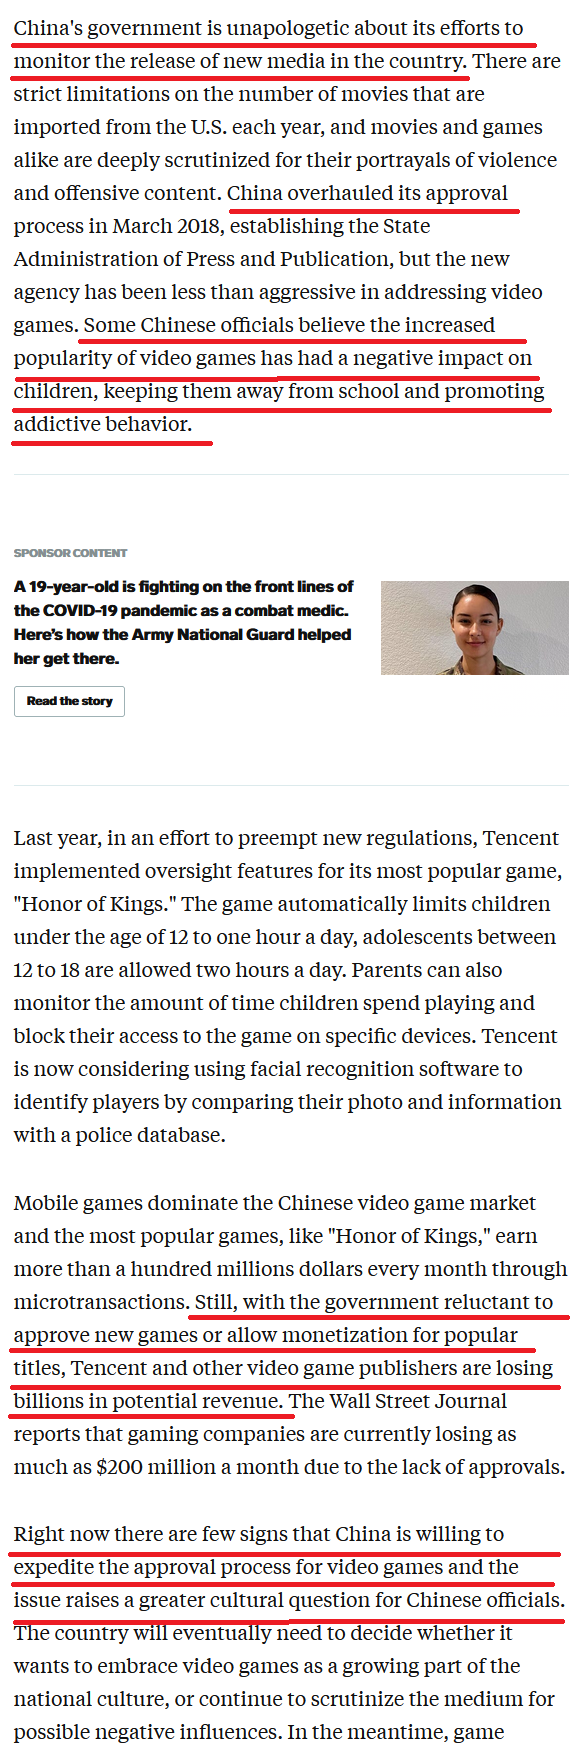
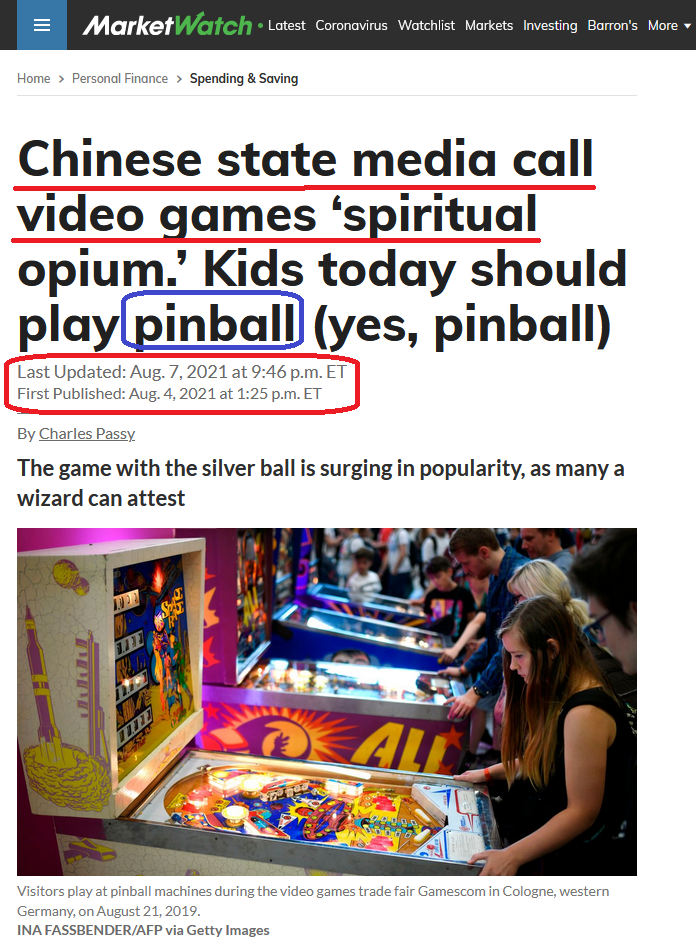
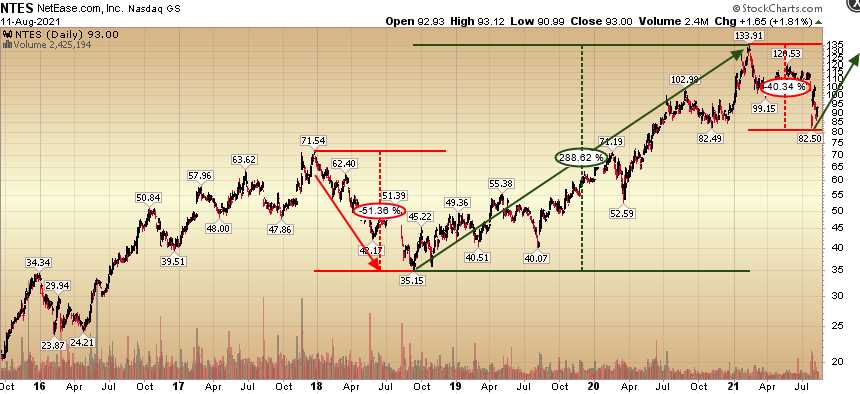 This article from October 2018 (on Business Insider) indicated that there were “few signs that China is willing to expedite the Approval process” and that “some Chinese officials believe the increased popularity of video games has had a negative impact on children.”
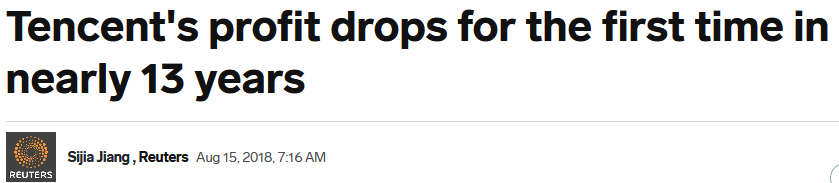
Here was a Reuters headline that dropped during this period:
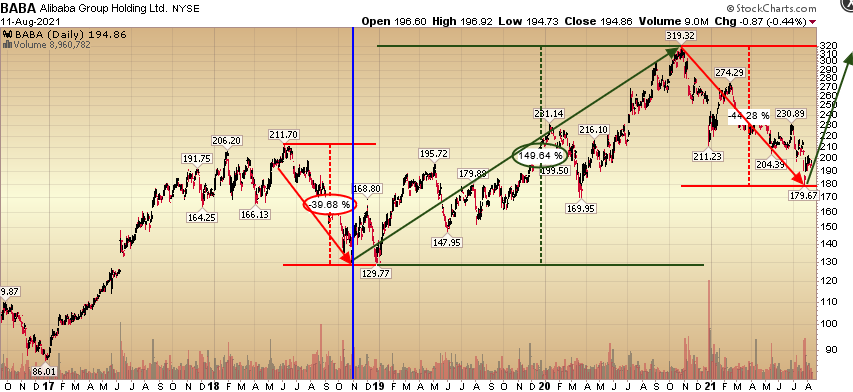
October 2018 looked like the end of the line for Big Tech in China. Even Alibaba was crushed in sympathy with the regulatory crackdown and capital was fleeing out of an unfriendly regulatory regime.
The blue vertical line marks the October/November 2018 period when negativity and headline risk was at its highest. After crashing nearly 40% in ~4 months, BABA went on to rally ~150% over the next two years. Sell the rumor (regulation), buy the news (crackdown).
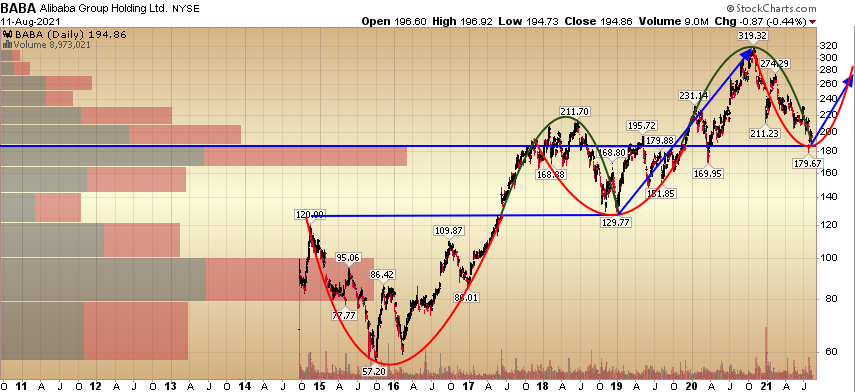
The other pattern worth noting about the historical behavior of BABA since its IPO, is its tendency to retest its points of “breakout” before taking the next leg higher:
We have covered the fundamental case on BABA for a number of weeks. You can review our previous articles and media spots regarding the core thesis. We are posting this chartwork only as illustrative and helpful when the next catalyst is a headline away.
From 2014 through 2017, BABA went down and back up (forming a “cup” shape outlined by the red line). After it “broke out to new highs” in mid 2017, it rallied and then rolled over to around its “breakout point” in the 120’s (late 2018)- before rallying higher. It “broke out” to new highs again in late 2019, and has recently come back to test the 2019 breakout area.
You’ll note that the “volume by price” (bars on the left) is where the stock has recently bounced. There is a ton of institutional money that so far is doing a good job defending these levels.
Now that we have retested the 2019 breakout point and bounced, we’ll see if we can get a new strong rally in coming months, and breakout to new highs in the next year or so. The fundamentals support ~$300 of intrinsic value in the short to intermediate term – and if the Chinese government lets the business perform – it’s likely to see $400+ in coming years (and become a Global Tech Leader).
I think we’ve seen this movie before:
Our bet is that we already know how this movie ends…
So, it’s your choice: “Deja vu all over again” or “the future ain’t what it used to be!” We’re in the former camp and believe that Yogi would be too!
On Monday night I was on CGTN America – Global Business – with Rachelle Akuffo. Thanks to Rachelle and Delal Pektas for having me on. In this segment we covered the recent China economic data, inflation and economic stimulus programs the government has recently put into place:
On Friday I joined Kristin Myers and Alexis Christoforous on Yahoo! Finance to discuss the Jobs report, Fed, and market outlook. Thanks to Sarah Smith, Ivana Freitas, Kristin and Alexis for having me on:
Here were my Show Notes (topics covered):
-
Thoughts on Jobs Report (post-release). Will labor shortage turn into labor glut after September, or is it unrelated and a jobs mismatch?
-
Everyone is focused on August/September chop/seasonality. We suggest using any weakness to buy high-quality names that have pulled back in recent weeks. Here are 3 picks we believe can outperform into year-end:
Pick 1 – Citigroup.
-
Trading at .87x Tangible Book vs. 1-2x under normalized conditions.
-
Trading at 8.5x 2022 EPS vs. Avg. historic multiple of 12x EPS.
-
Turnaround Story: New CEO Jane Fraser took efficiency ratio down from 64% to 52.9% by cutting costs. Anything below 50% is good.
-
More Credit Reserve reversals coming.
-
Commercial loan demand will pick up in 2H 2021 and 1H 2022.
-
3% dividend yield.
Pick 2 – Dollar Tree.
-
Trading at 14.5x 2022 EPS vs. Avg. historic multiple of 18x EPS.
-
Online sales slowing (AMZN). People getting out and about. DLTR beneficiary.
-
Avg. Ticket up 9.5% last quarter.
-
Best same store sales comps since 2017 (up 4.7%).
-
Guidance light due to short term spike in shipping and freight costs. This will mitigate in coming quarters and has created the opportunity to step in ~20% off its recent highs.
Pick 2 – Intel.
-
Trading at 11.8x 2022 EPS vs. Avg. historic multiple of 15x EPS.
-
Lions share of PC and Server Processor markets.
-
Server processors will be the main driver of growth in the short term.
-
2.5% dividend yield. Long-term dividend grower.
-
Earnings: Peak Growth (rate), however – estimates will continue to climb in coming weeks. Last week, 2022 S&P EPS EST were $213.5, now up to $217 and on their way to $230 (which will make current market levels look more reasonable in coming months)…
-
Consumer is in the best shape in recent history. This is attributable to the shift to aggressive fiscal policy.


Source: Bridgewater
-
FED remains accommodative. Has prioritized “FULL EMPLOYMENT” over price stability for the time being (8.7M unemployed vs. 5.7M before covid). Liquidity remains abundant and will continue even AFTER tapering ($120B/mo of Bond Purchases) begins in 2022. Fed balance sheet is at all time highs, and it has been a fool’s errand to fight the fed.
-
OUTLOOK: While it may feel like the market is “due for a crash,” there have been many mini-crashes going on “under the surface” all summer and creating opportunities to pick up selective stocks on the cheap. Small caps have done nothing in a half a year:

The Dow has behaved similarly:

Thoughts on August/September “Seasonal Chop”: Don’t wait for a “big storm” to conclude before you cast your net. 1) It might not come, and 2) There have been many rolling “flash storms” already taking place over the past weeks and months – and if you wait too long to put some lines in the water, you may find all of the best fish are gone.
Inflation
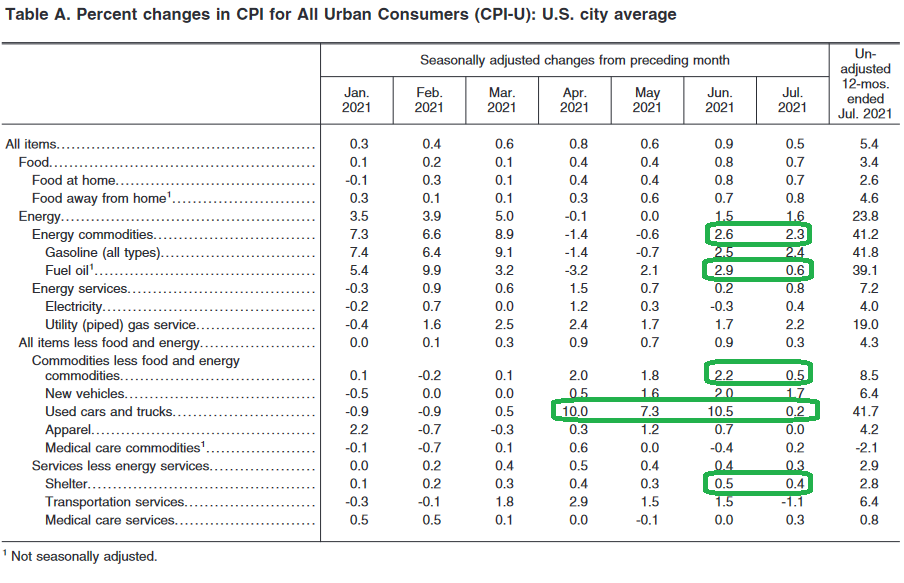
The “transitory” inflation narrative promulgated by the Federal Reserve now has some supportive data behind it in the most recent (August 11) CPI report:
 The rate of price increase is starting to come down. We see a big change in Used Car prices and a welcome moderation in Shelter costs:
That said, we cannot ignore the amount of spending and monetary liquidity that has been injected into the system in just over a year. As of March 15, 2021, the spending tally was ~$5.3 Trillion:
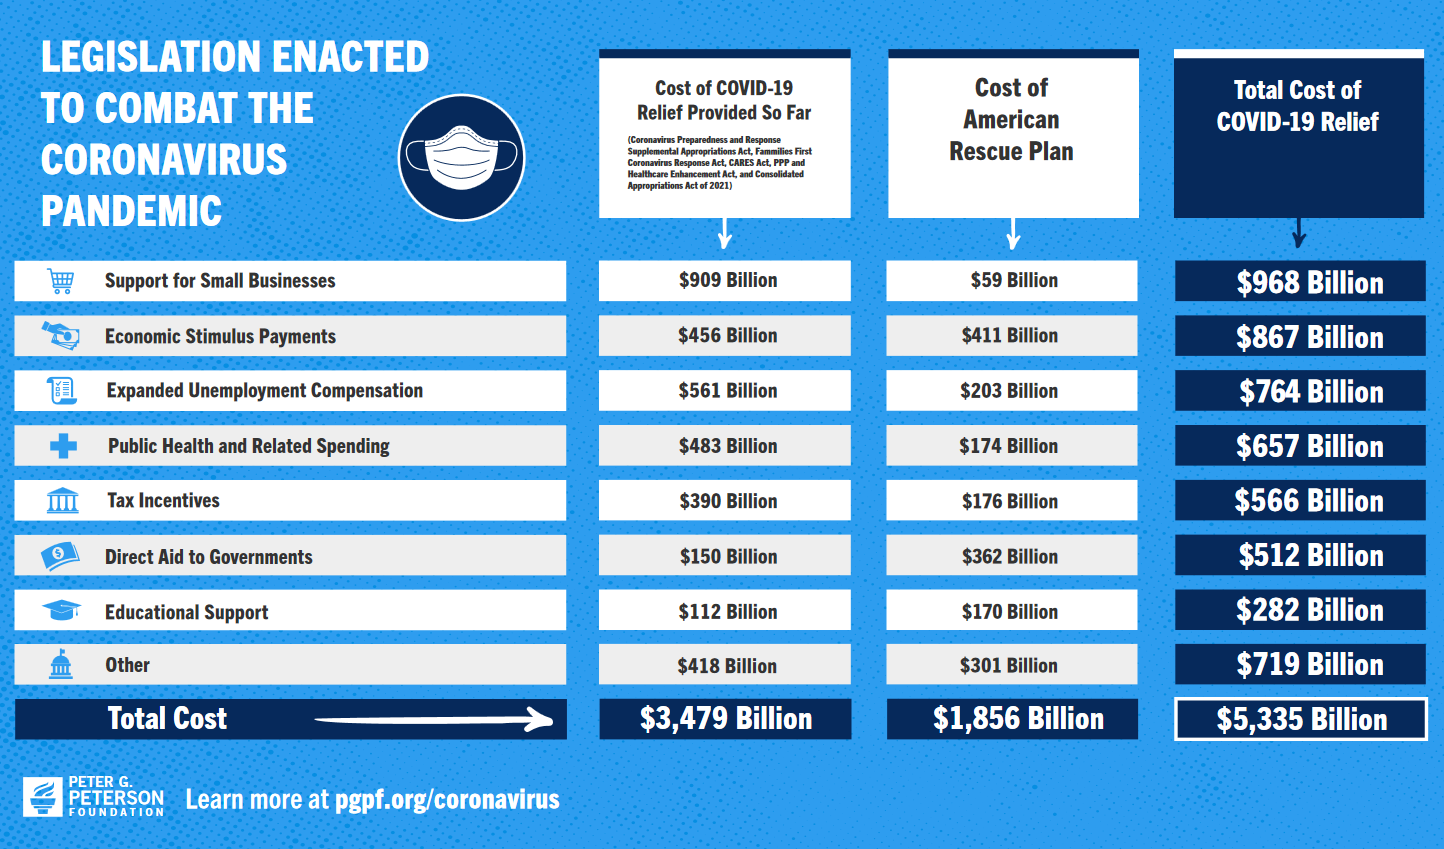
We have since added around $4T to the Fed Balance Sheet:
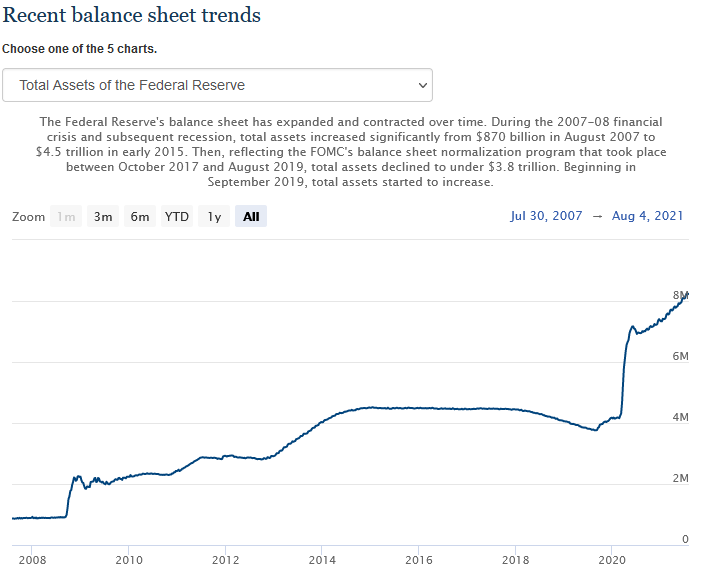
And that number EXCLUDES the $1.2T Infrastructure package that was just approved in the Senate as well as the $3.5T proposed Social and Climate spending package that is intended to pass through Reconciliation later this year.
The only thing that has held inflation at bay is the persistent decline of the velocity of money. “The velocity of money is the frequency at which one unit of currency is used to purchase domestically- produced goods and services within a given time period. In other words, it is the number of times one dollar is spent to buy goods and services per unit of time. If the velocity of money is increasing, then more transactions are occurring between individuals in an economy.” (St. Louis Fed)
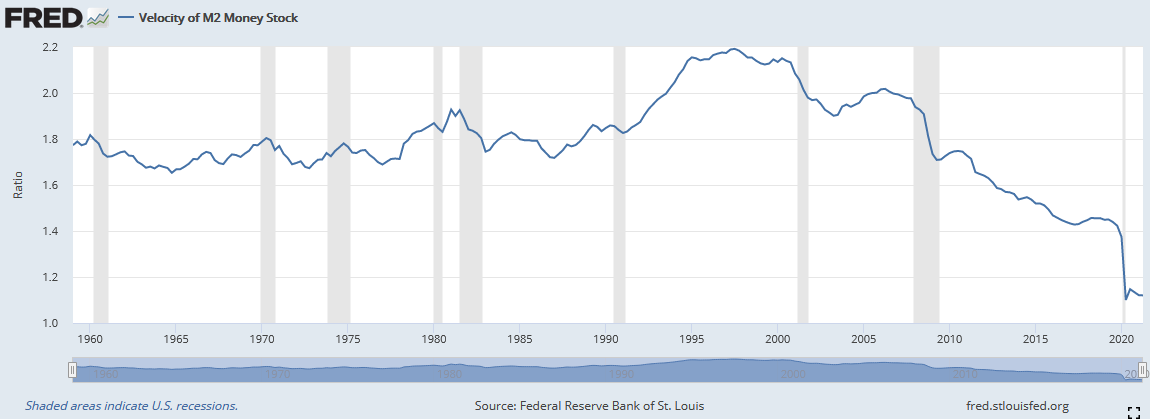 This however may prove to be a phenomenon of the past. There were two factors that precipitated this decline in velocity:
- Aging population (Boomers’ peak spending was around the turn of the Century).
- Most policy stimulus over the past two decades was Monetary Policy versus Fiscal. Monetary stimulus winds up in assets. Fiscal stimulus winds up in people’s pockets – and often in the pockets of those who are inclined to spend all/most of it in the economy.
These two factors are now changing abruptly:
- The boomer spending that rolled off is now being displaced by our largest demographic of the population (72M Millenials). They are ~30 years old and starting their peak spending cycle as they begin housing and family formation.
- While monetary policy is still running hot, fiscal stimulus is higher than ever. More direct payments and spending projects are being injected into the economy than at any point in history. This may very well create a scenario with too many dollars chasing too few goods – and an inability to be offset by deflationary technological innovation.
Who are the beneficiaries?
DEBTORS. Those who borrow (at a fixed rate) will be paying back a fixed obligation in deflated dollars.
GOVERNMENTS: With high public sector debt – as it is inflated away relative to nominal GDP.
OWNERS OF ASSETS. Real Estate, Land, Commodities, and Ownership of High Quality companies that have the moat/pricing power to pass on increased costs to consumers and maintain margins.
Who loses?
CREDITORS. Those who lend in today’s dollars and get paid back with devalued dollars will be at a disadvantage in this scenario.
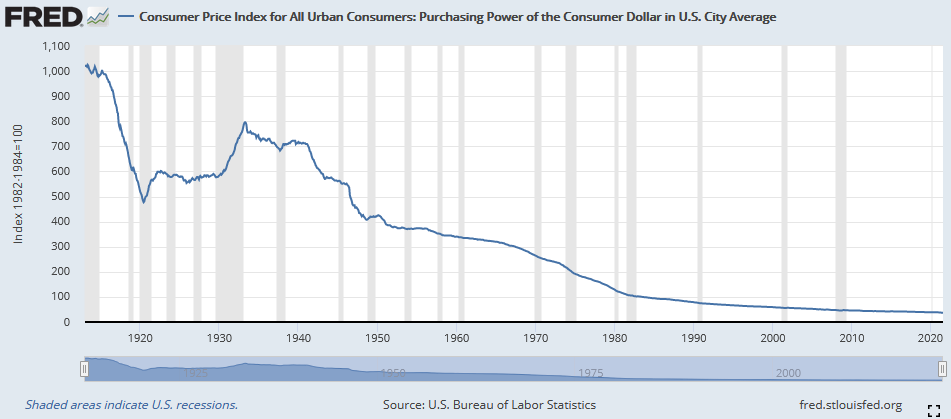
CONSUMER. Prices of food, gas and shelter will likely rise faster (and sooner) than wages. Between 1940 and 1982, the value of one dollar fell from $700 to $100 or 85%.
 SAVERS: The money saved will lose purchasing power at an accelerated rate if not invested in the right assets.
Today, Senator Joe Manchin – a Democrat from West Virginia said, “given the current state of the economic recovery, its simply irresponsible to continue spending at levels more suited to response to a Great Depression or Great Recession, not an economy that is one the verge of overheating.” (additional spending) would “put at risk our nation’s ability to respond to the to the unforeseen crises our country could face.” Perhaps Stanley Druckenmiller got to him when he made his rounds in D.C. in recent weeks – warning against such profligacy.
Roads and bridges are a long-term investment with a clear return on capital. Another $3.5T in social spending when the consumer is in their best shape in history (see Bridgewater data above) may lead us down a road of much more than healthy moderate inflation. This is not our base case, but it is one we have to keep an eye on and prepare for the possible eventuality.
The key number we will keep an eye on moving forward is wages. In last week’s jobs report, we saw average hourly earnings come in higher than expectations. The Fed is betting that when the kids go back to school – and extended unemployment benefits roll off in September – a new supply of labor will return and keep wages down. We’ll see how the thesis plays out… 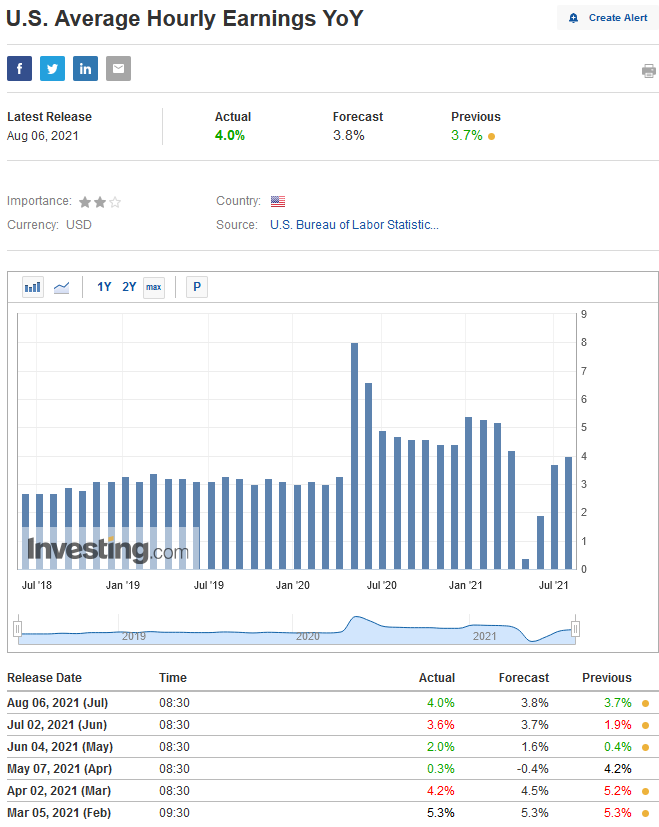
Now onto the shorter term view for the General Market:
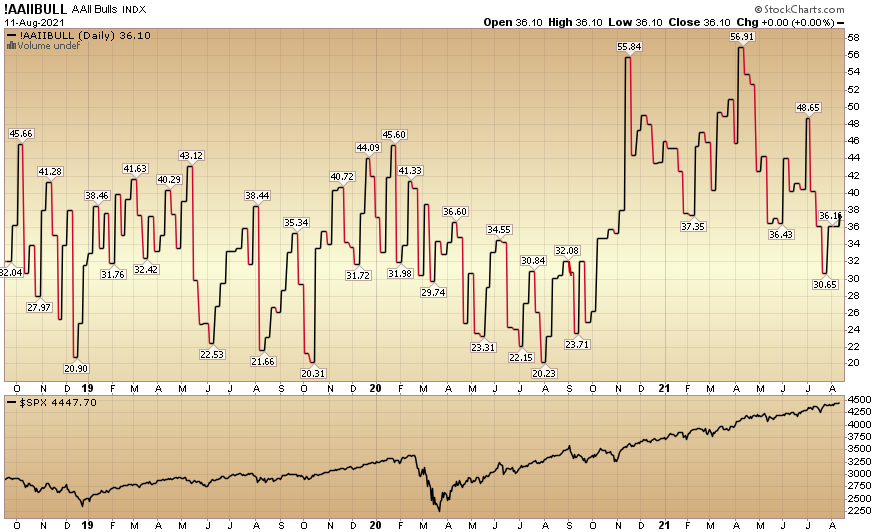
In this week’s AAII Sentiment Survey result, Bullish Percent (Video Explanation) ticked up modestly at 37% from 36.1% last week. Bearish Percent flat-lined to 31.5% from 31.7% last week.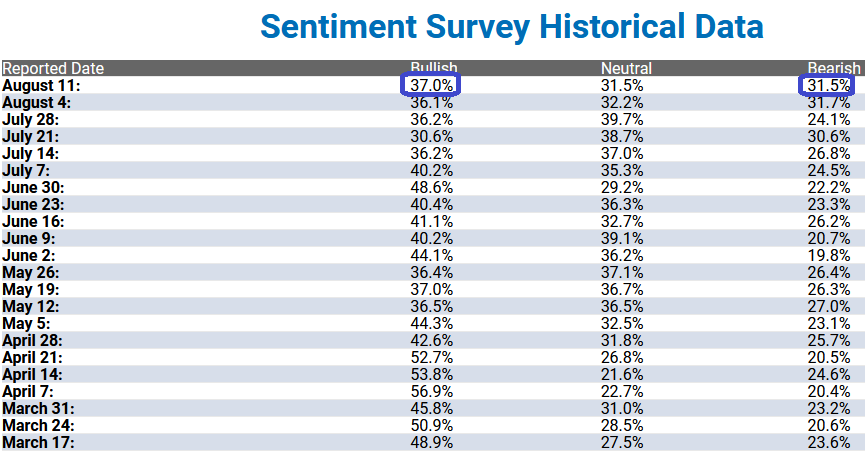
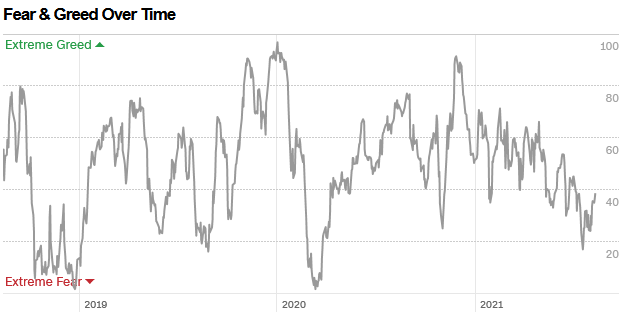
The CNN “Fear and Greed” Index rose from 26 last week to 39 this week. Fear is still present in the market. You can learn how this indicator is calculated and how it works here: (Video Explanation)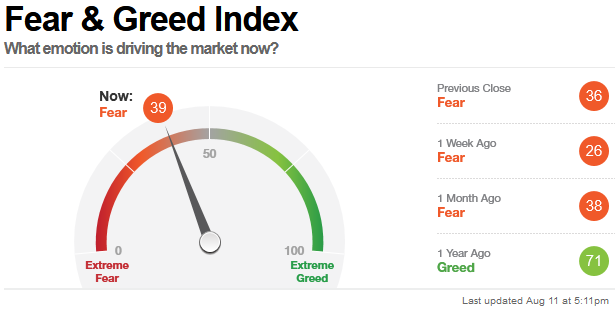
 And finally, this week the NAAIM (National Association of Active Investment Managers Index) (Video Explanation) jumped to 97.2% this week from 78.39% equity exposure last week.
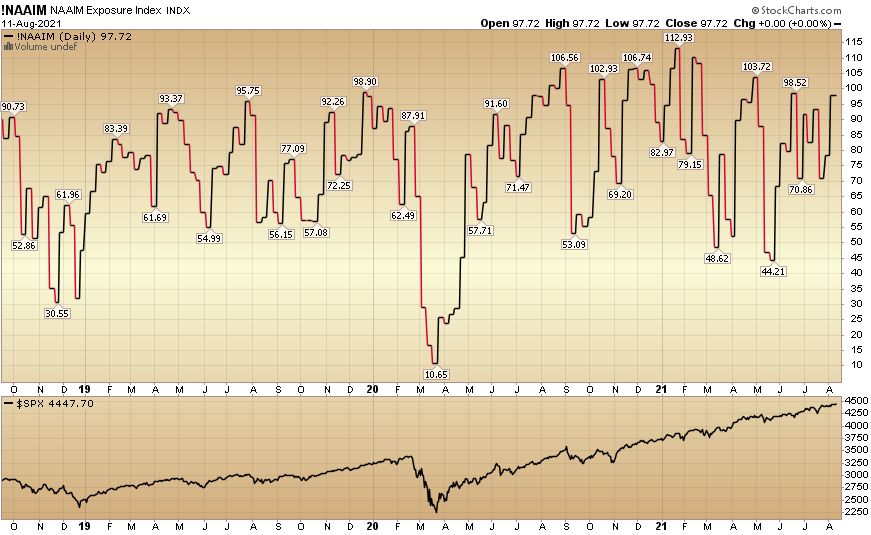
Our message for this week
Many folks have been out since the beginning of the month declaring that we must get a 10-15% correction because market breadth is weak (few stocks are pulling all of the weight in the S&P 500). Urban Carmel put out a refutation of that thesis on Twitter this February with the following chart:
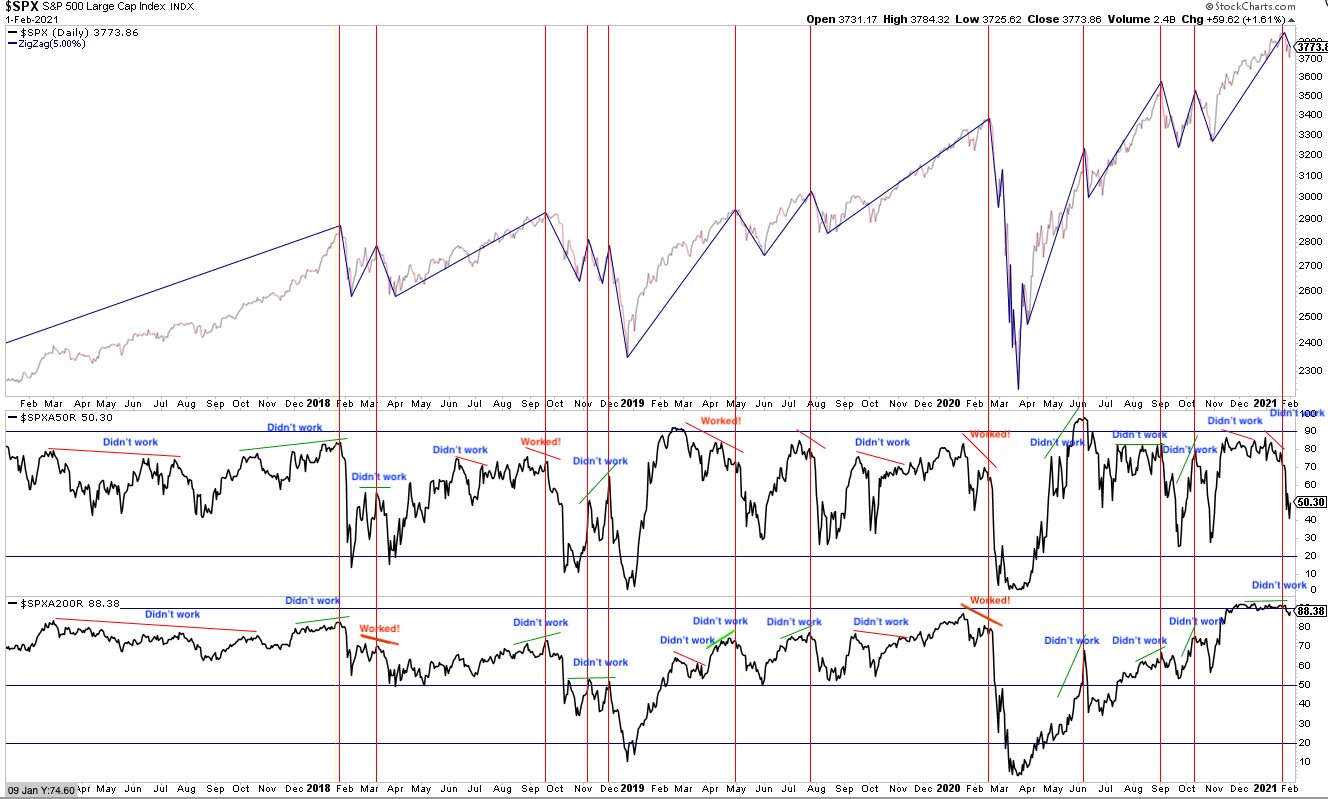
Here’s the latest data:
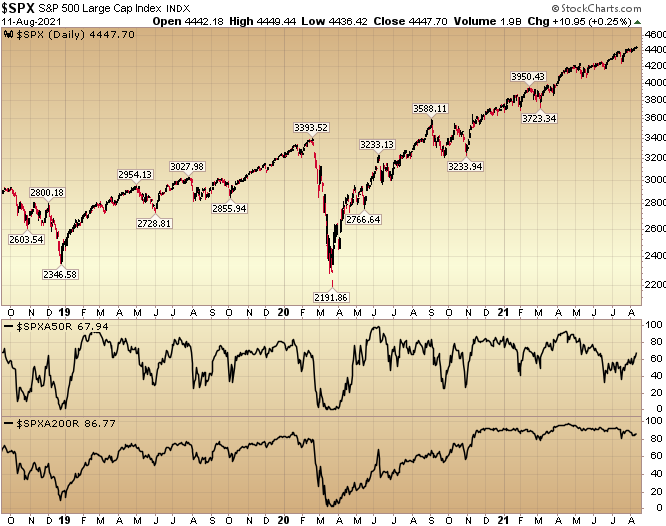
We are seeing breadth improve in the last couple of weeks (see first footer chart depicting S&P stocks above 50DMA). Whether we get a correction or not is less important than buying quality when it’s on sale.
As we covered last week, there are more areas still on sale than not. You just have to know where to look and buy what’s marked down. Here are the groups we covered, and while many have improved in the last week, there is still plenty of selective opportunity to be had.


