

Cooper Standard Update
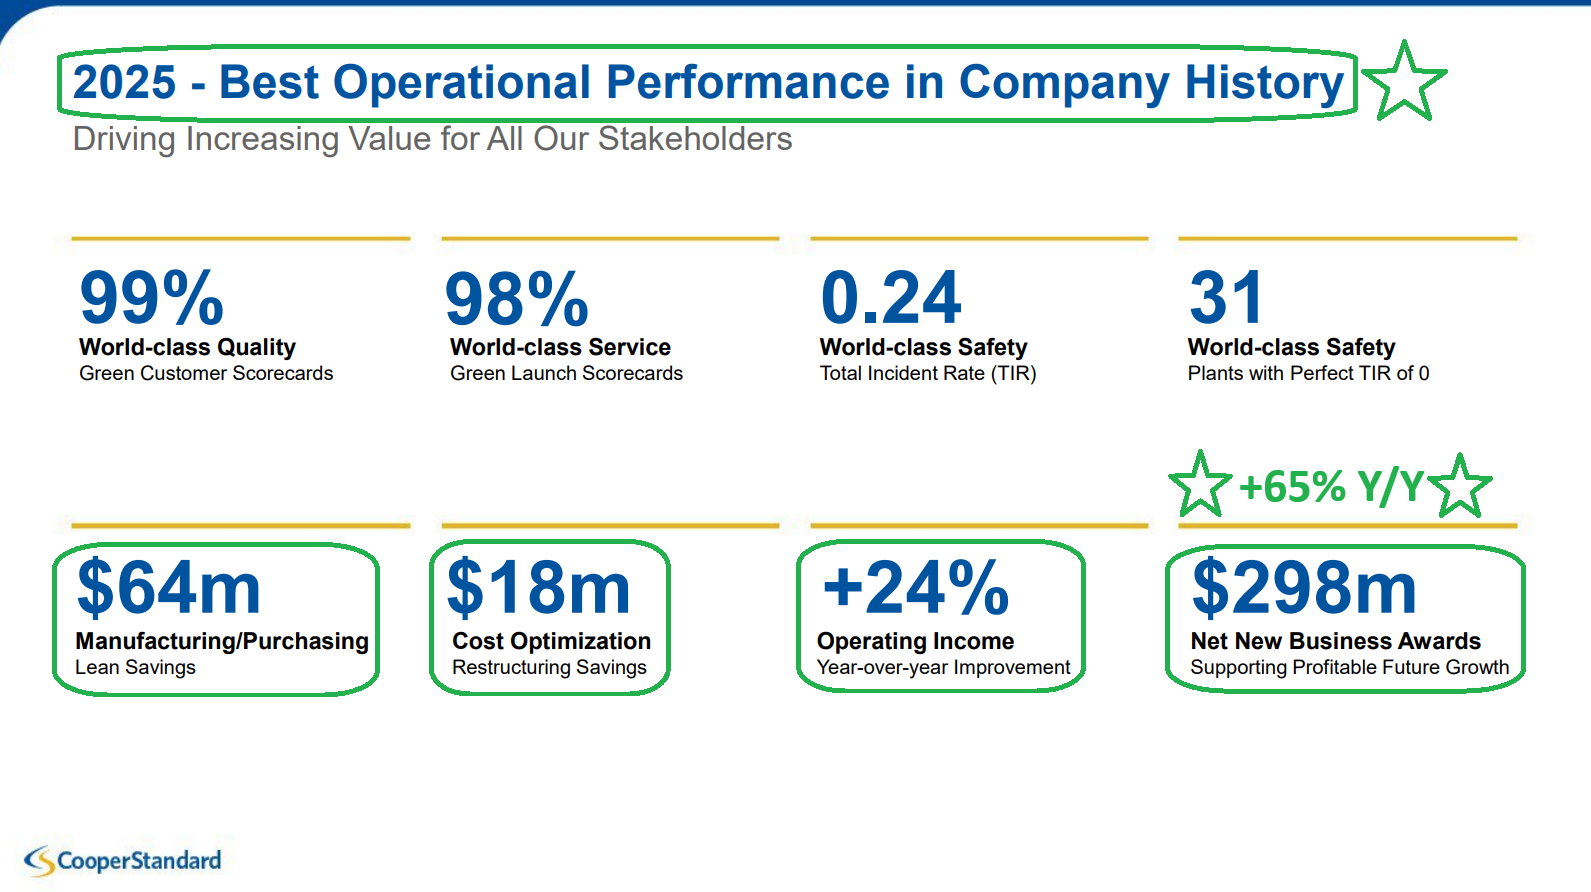
Cooper Standard closed out 2025 with a textbook quarter of disciplined execution, playing the hand it was dealt and focusing on what it could control. Management called it the strongest operational year in company history, and the results back that up.
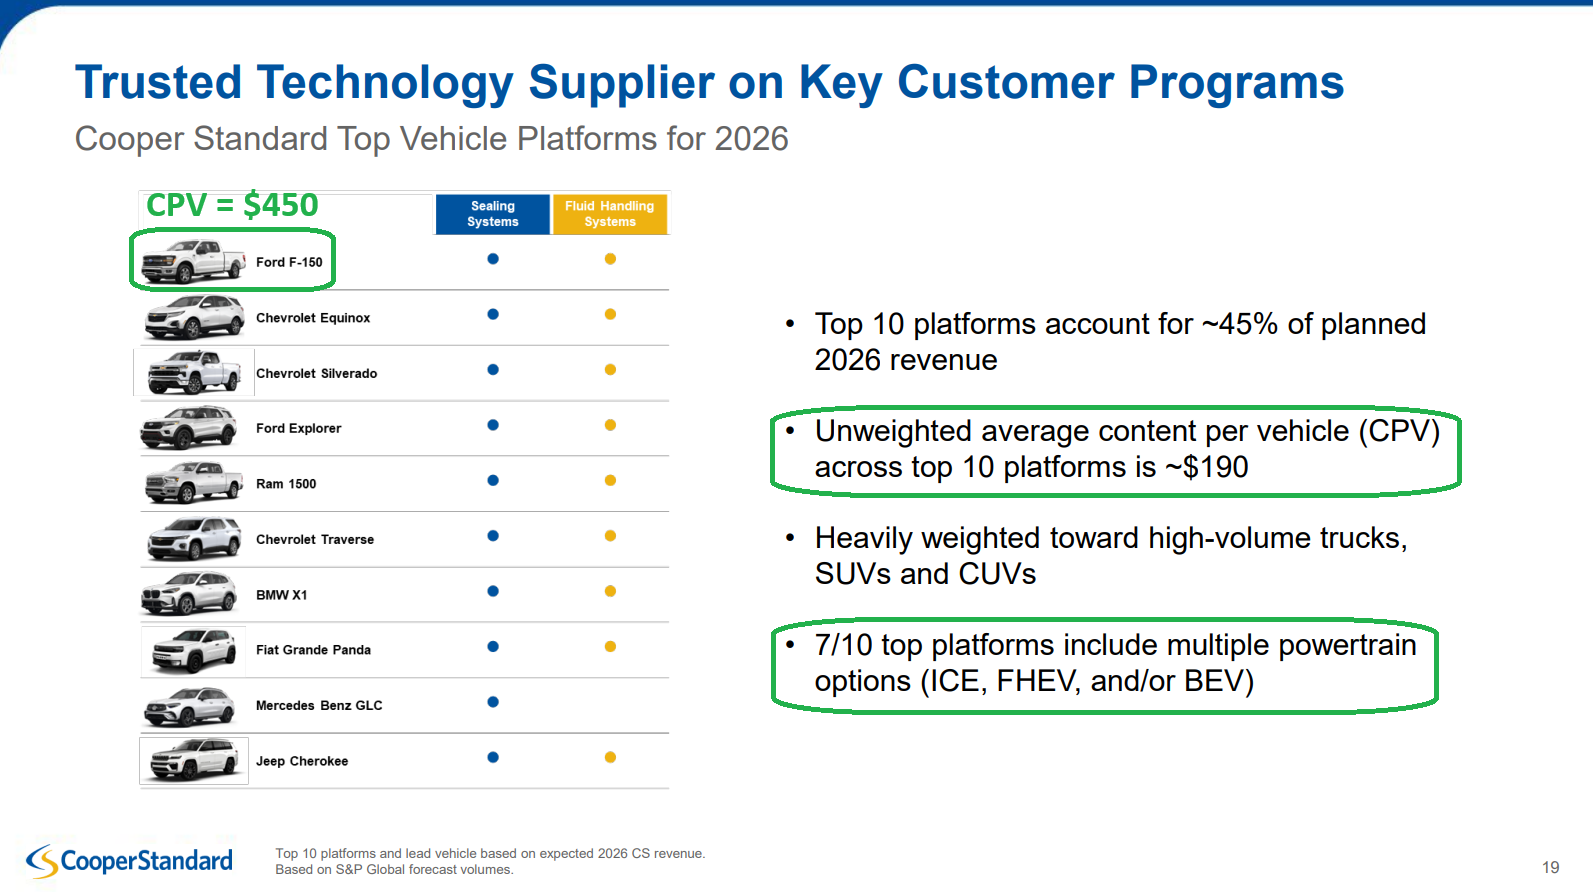
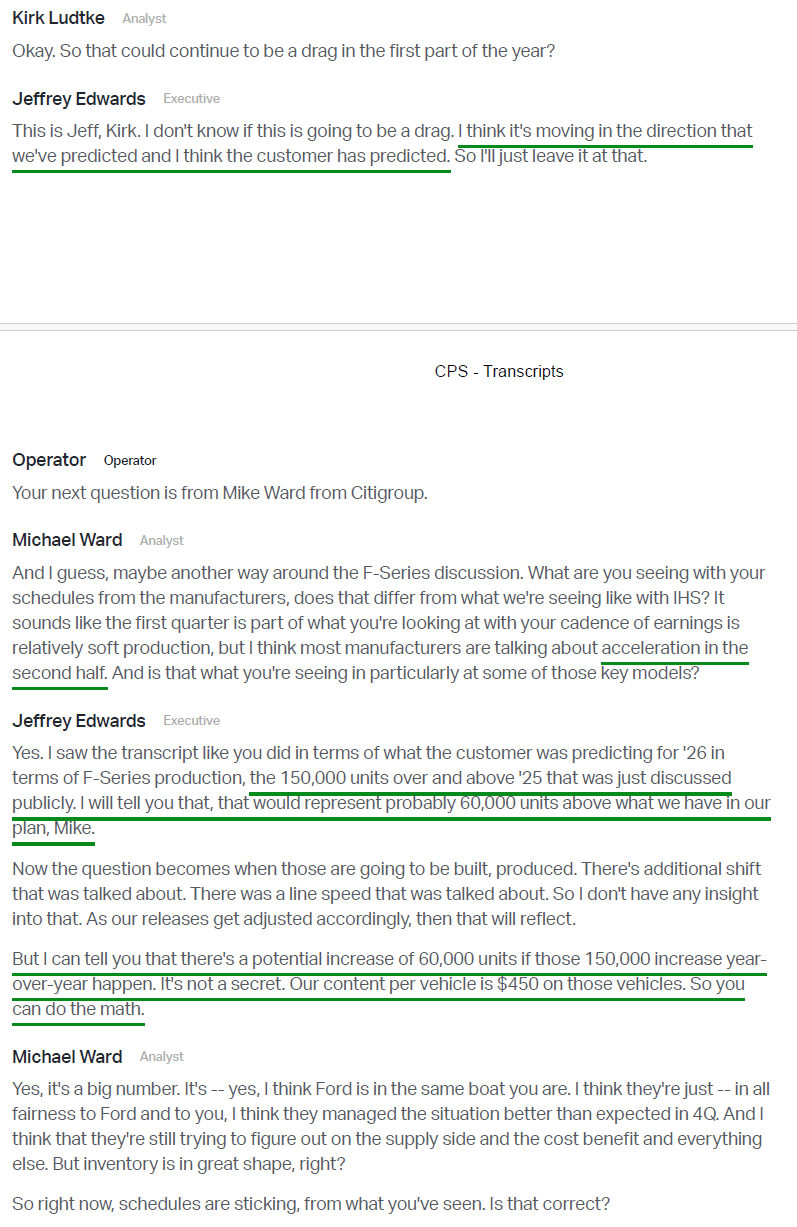
Despite the Novelis aluminum plant disruption, which idled ~40% of North American sheet supply and halted F-150 production, CPS’s #1 platform, the key drivers that move the needle continued to trend in the right direction.
Adjusted EBITDA rose 16% to $209.7M, reaching the high end of guidance with 100 bps of margin expansion to 7.6%.
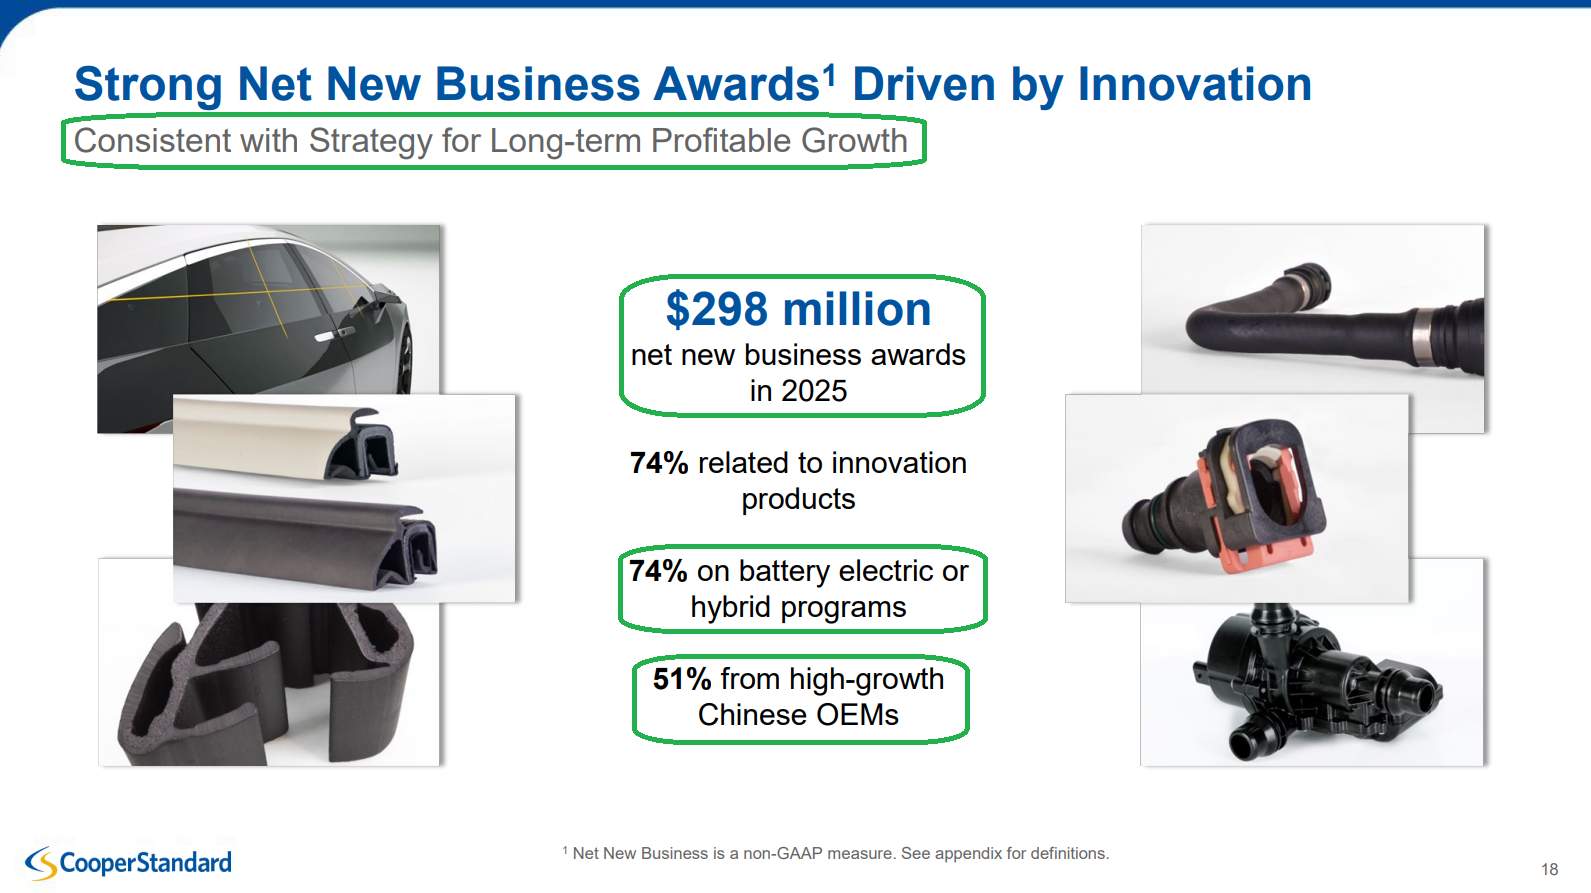
Net new business awards (the #1 indicator of future growth) totaled $298M, the highest level since 2019, with 74% tied to EVs (+20% CPV) and hybrids (+80% CPV).
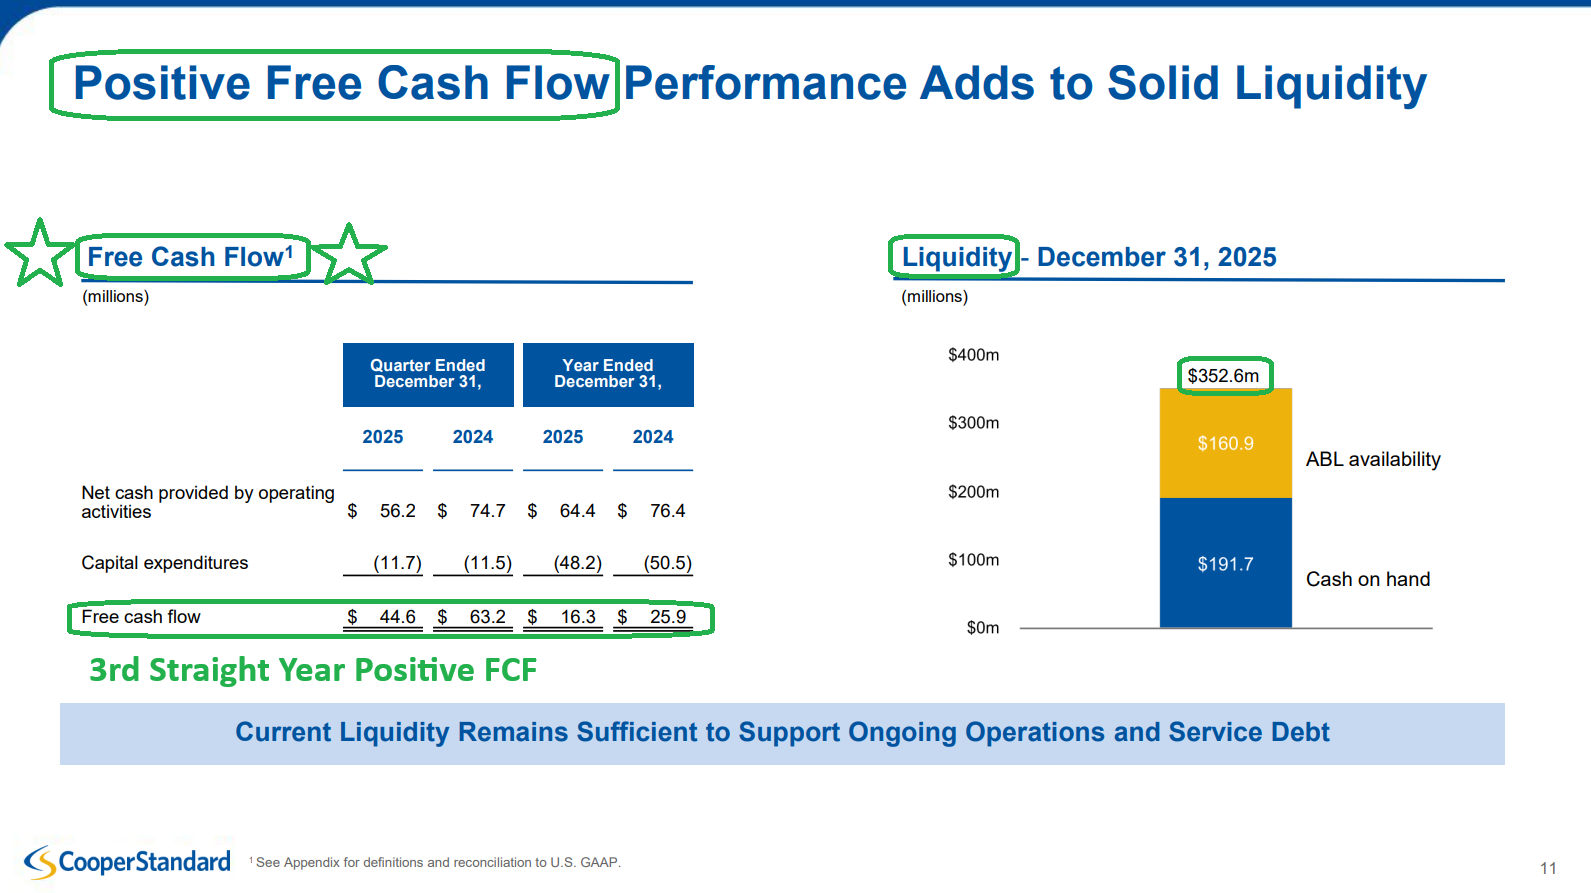
Free cash flow reached $16.3M, marking the third consecutive year of positive FCF.
Most importantly, and the reason the market sent shares up over 30%, 2026 guidance implies another major step higher.
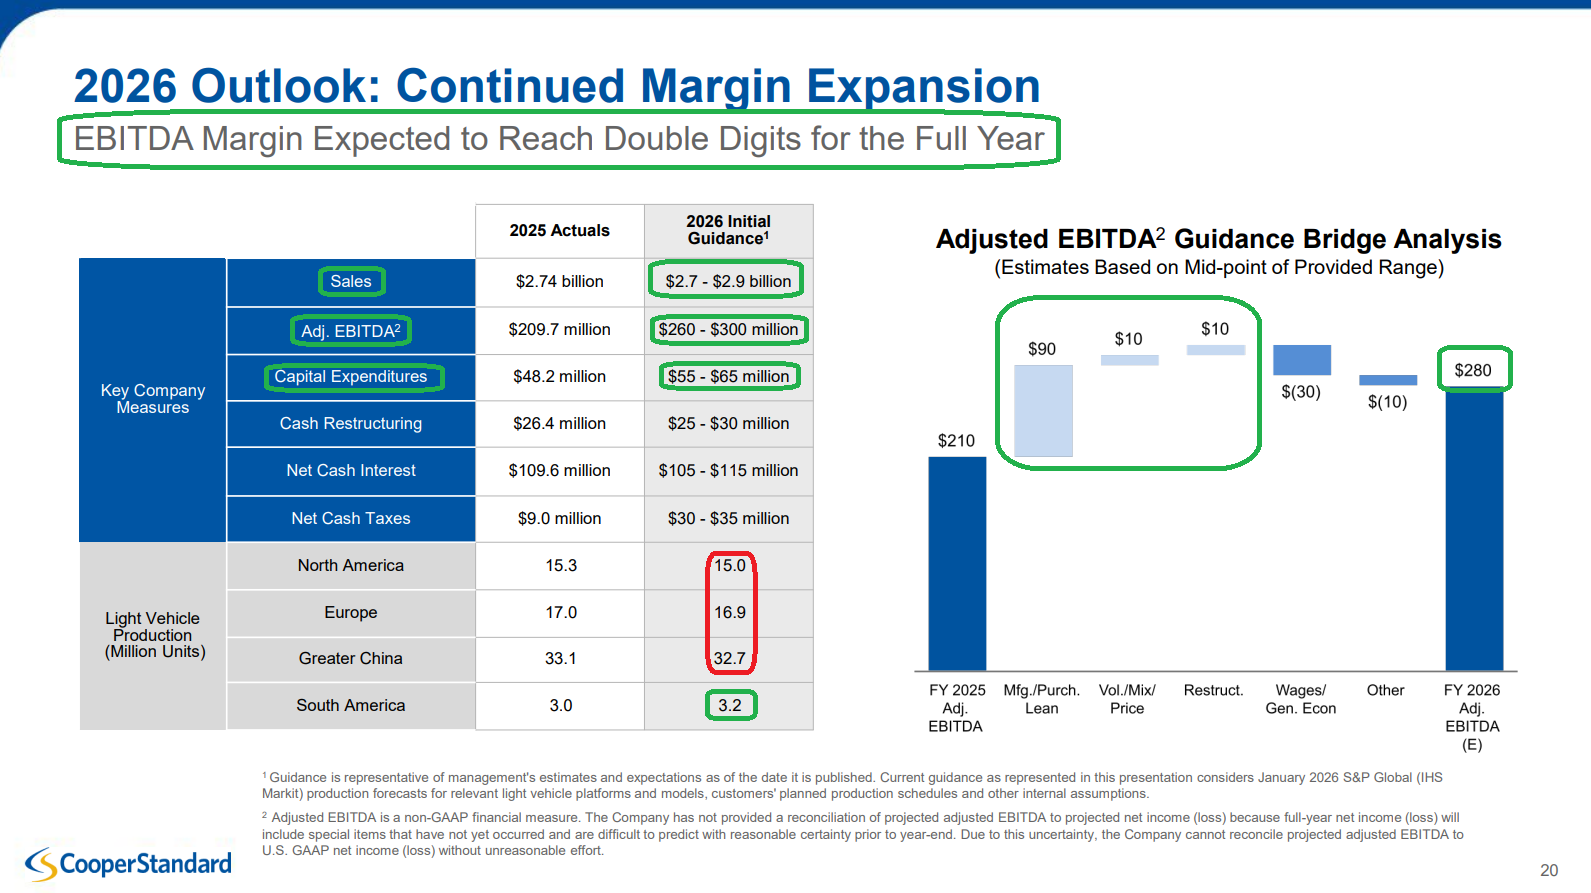
Adjusted EBITDA is expected at $260M to $300M (+33.5% at the midpoint), with margins reaching the long-awaited 10% threshold.
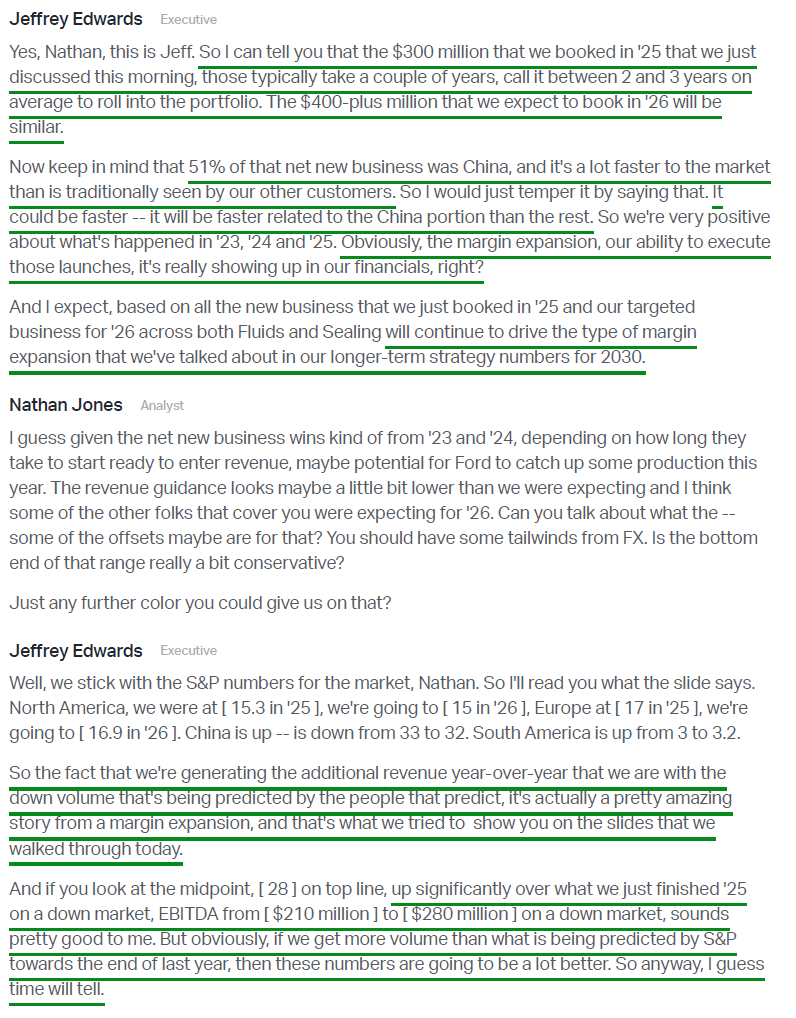
New business awards are expected to exceed $400M (+34% Y/Y), with many already in hand.
Free cash flow is expected to reach ~$50M at the midpoint, more than tripling 2025 levels.
What makes this even more impressive is that the entire outlook is once again predicated on the mortician’s forecast for production volumes. Guidance assumes North America production declines to ~15M units and global production falls by 0.6M units (-0.9%).
The fact that CPS can expand margins at that rate and deliver improved results in a flat-to-down production environment, despite being a leveraged supplier, speaks volumes about the heavy lifting management has already done and the groundwork laid over the past several years.
And when, not if, volumes normalize, Cooper Standard will be in the strongest position it has ever been in to capitalize and deliver.
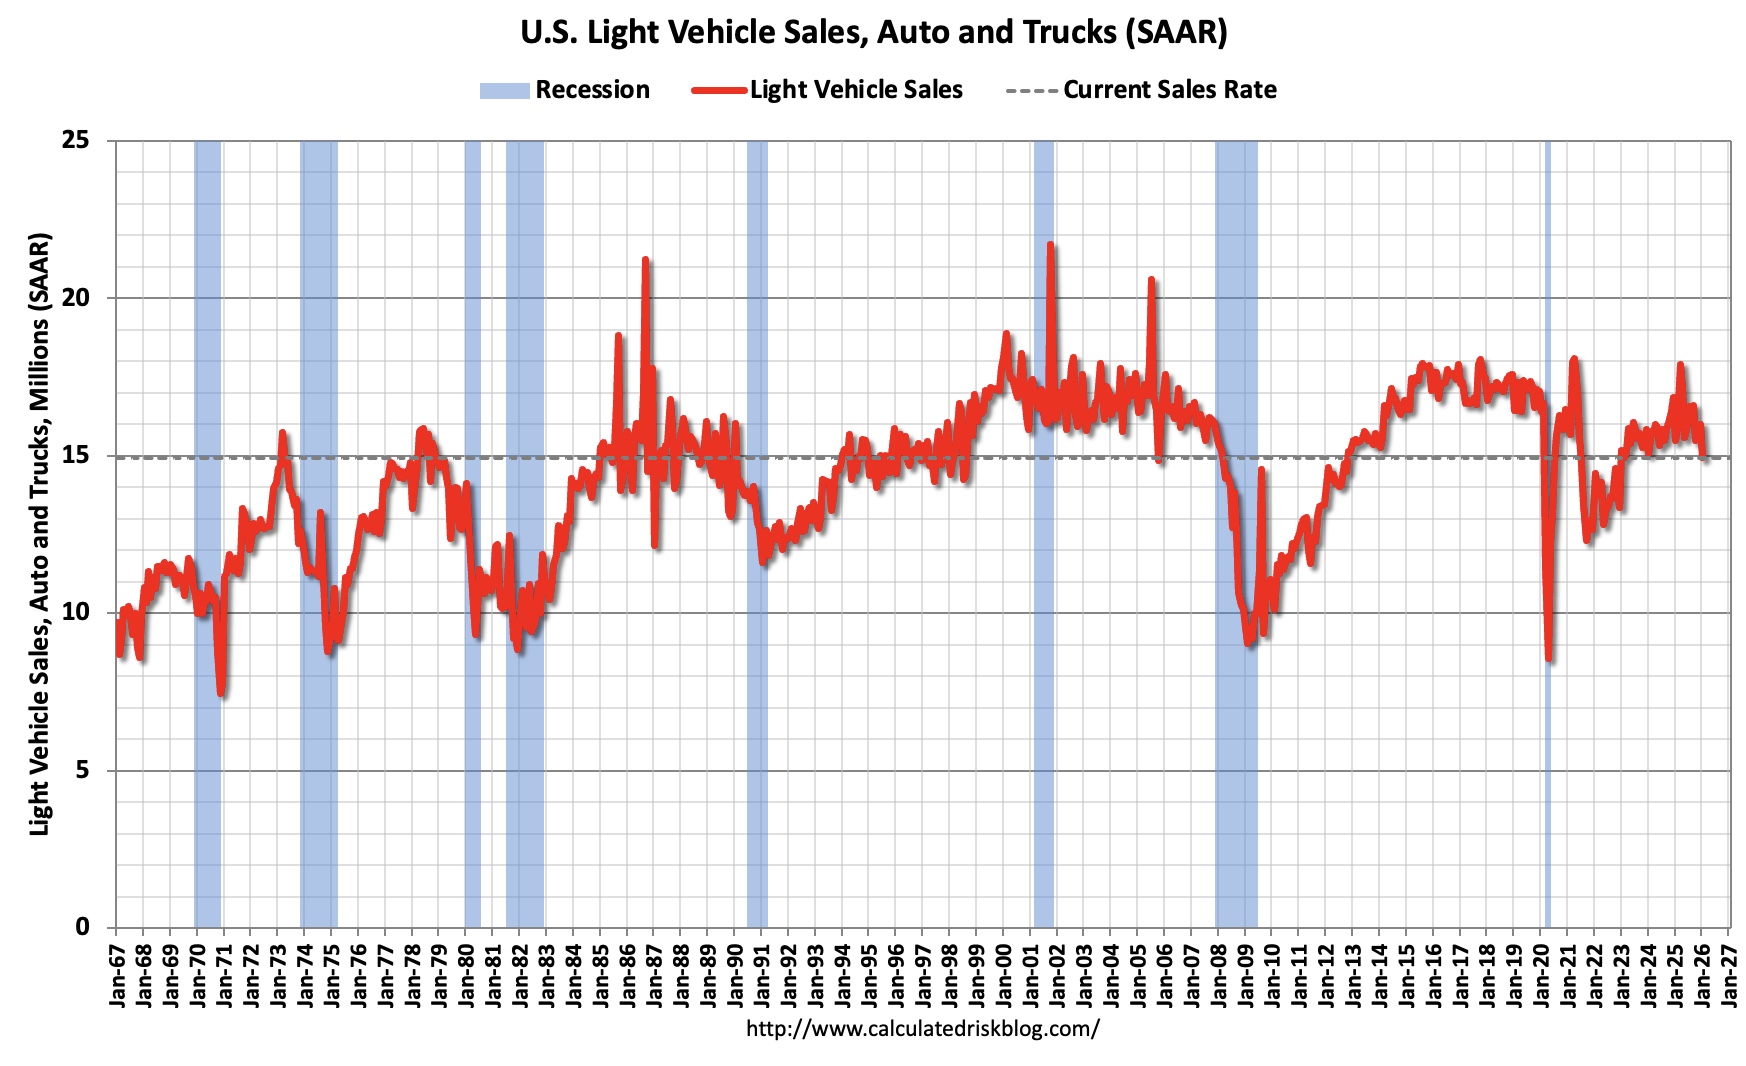
The fact of the matter is that every US auto cycle over the past 40 years has peaked between 17M and 18M SAAR. Today’s mortician’s production forecast sits at just 15M units.
That is despite:
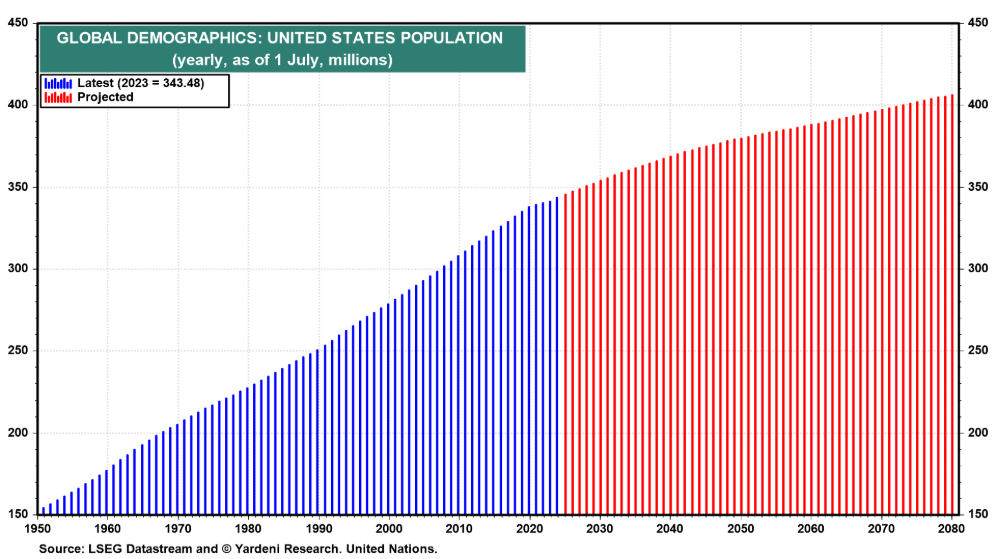
US population more than 30% higher than prior cycle peaks, with over 70M millennials entering prime vehicle ownership years
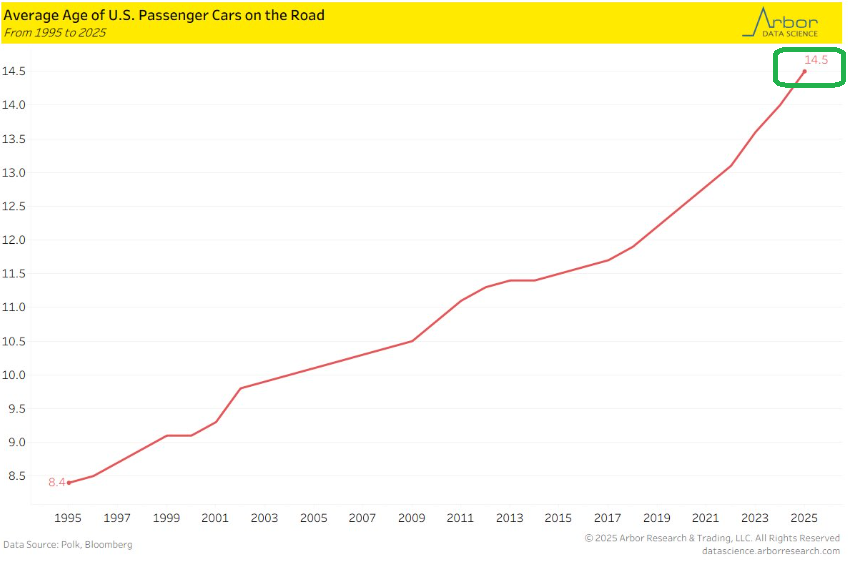
Record high average vehicle age of 14.5 years
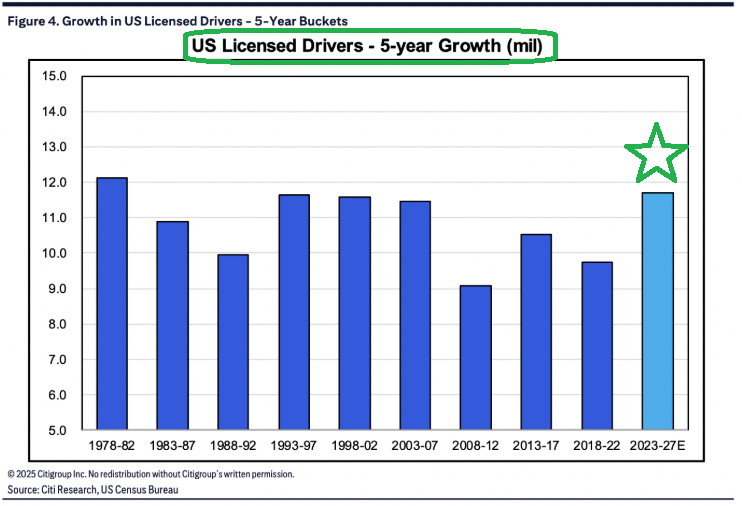
Strongest growth in licensed drivers in more than four decades
Unless one is willing to ignore these structural demand drivers and what history has shown in EVERY prior cycle, mean reversion is inevitable. The beach ball of demand can only be held under for so long.
Keep in mind, our original thesis on Cooper Standard was a recovery in North American ICE production volumes. Since then, we have picked up the added bonus of two structural tailwinds that were never part of the original underwriting: hybrids and aggressive global expansion by Chinese OEMs.
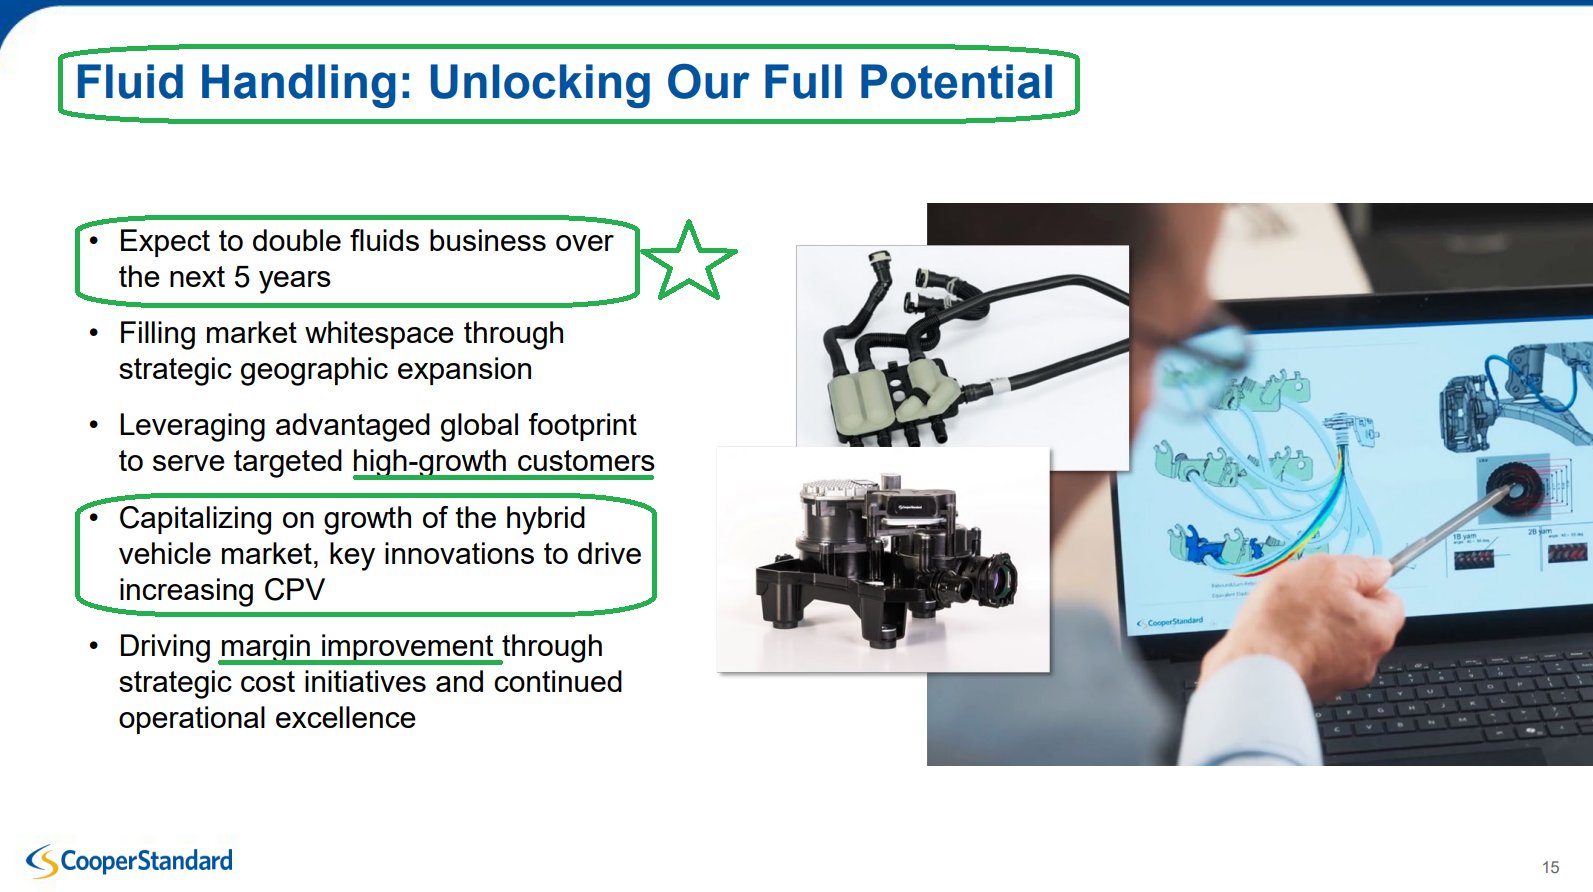
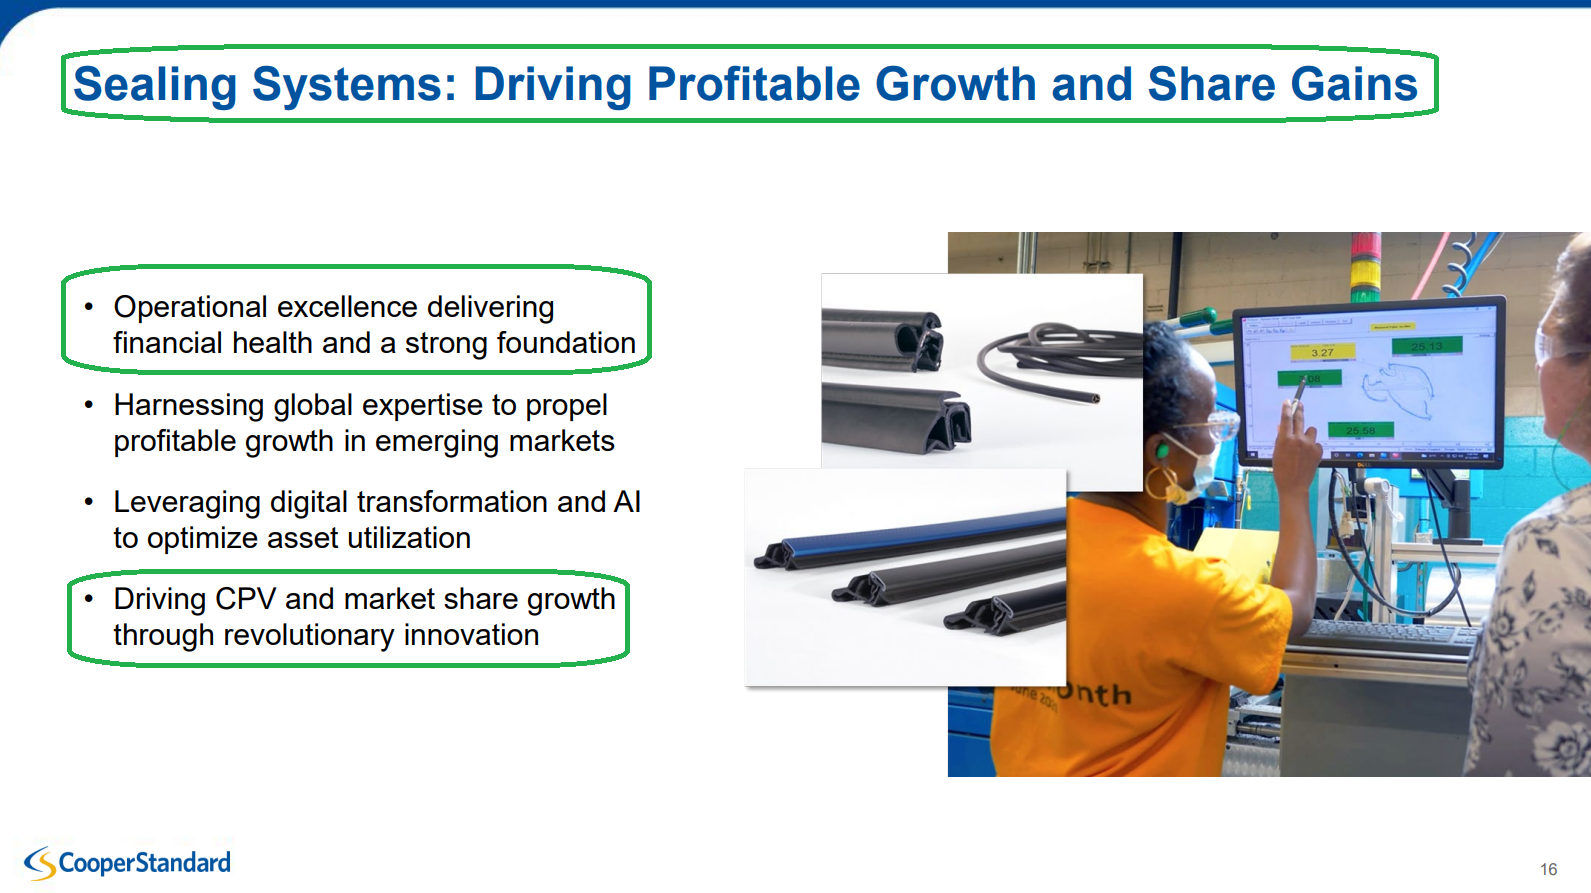
Consumers are voting with their wallets, and the shift toward hybrids over EVs is abundantly clear. Hybrids happen to be Cooper Standard’s sweet spot, requiring roughly +80% more content per vehicle and delivering structurally higher margins.
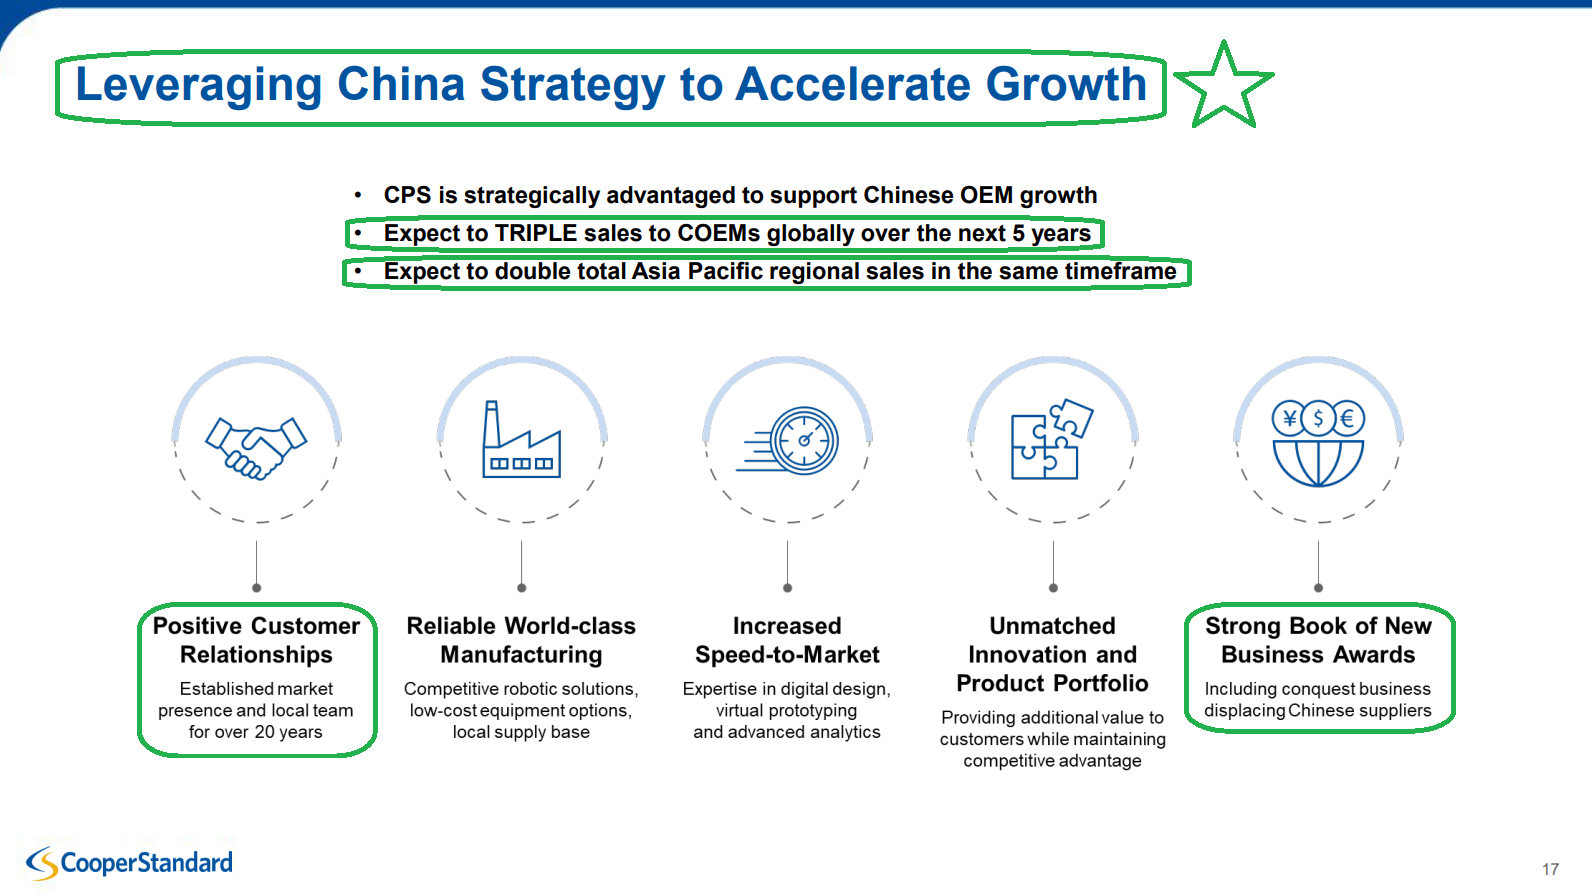
At the same time, Chinese OEMs are launching aggressive global expansion plans and winning massive market share in the process. CPS expects this to translate into a TRIPLING of sales to Chinese OEMs over the next five years, at attractive margins and with little to no incremental capacity investment required.
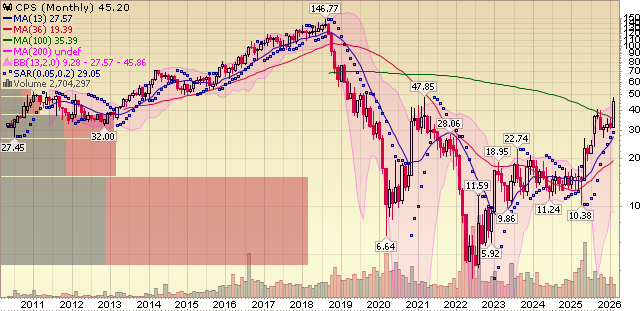
This unexpected twofer of demand drivers was never embedded in our original model, which makes our estimate of CPS returning to its 2018 peak price of $146 look increasingly conservative.
While volumes catch up, the near-term catalyst and next leg higher will be driven by a global refi. We estimate a successful refi could generate $34M+ of annual interest expense savings, or roughly $1.90 per share. Applying conservative 10x (trough) to 20x (peak) multiples to those savings alone implies $19 to $38 per share of incremental value, or 42% to 84% of today’s price.
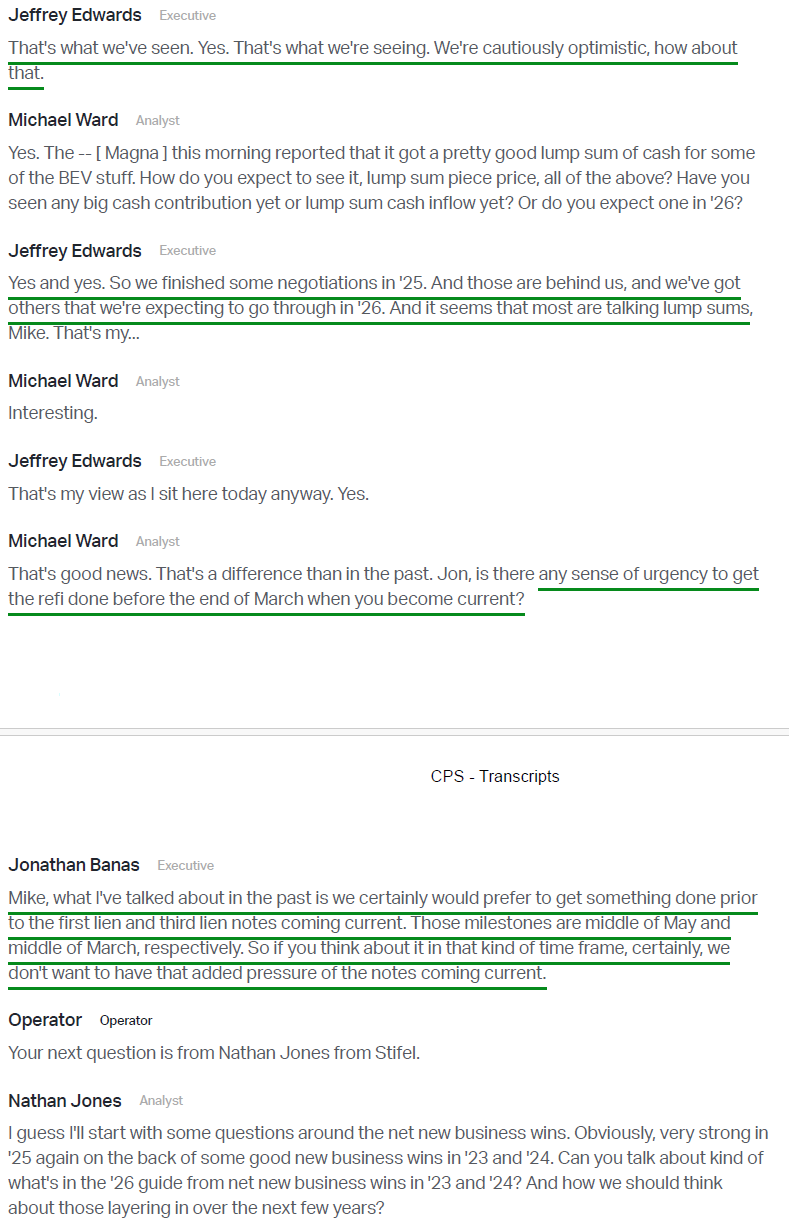
Here’s what management had to say regarding the timing of a refi during the earnings call:
“We certainly would prefer to get something done prior to the first lien and third lien notes coming current. Those milestones are middle of May and middle of March, respectively. So if you think about it in that kind of time frame, certainly, we don’t want to have that added pressure of the notes coming current.”
Based on that commentary, and assuming they are successful, we could see news on the refi in the COMING WEEKS…
So despite being a major winner from our initial cost basis, our confidence in CPS continues to move higher, as the secular drivers remind us that this story remains in its early innings.
Q4 Earnings Breakdown

10 Key Points
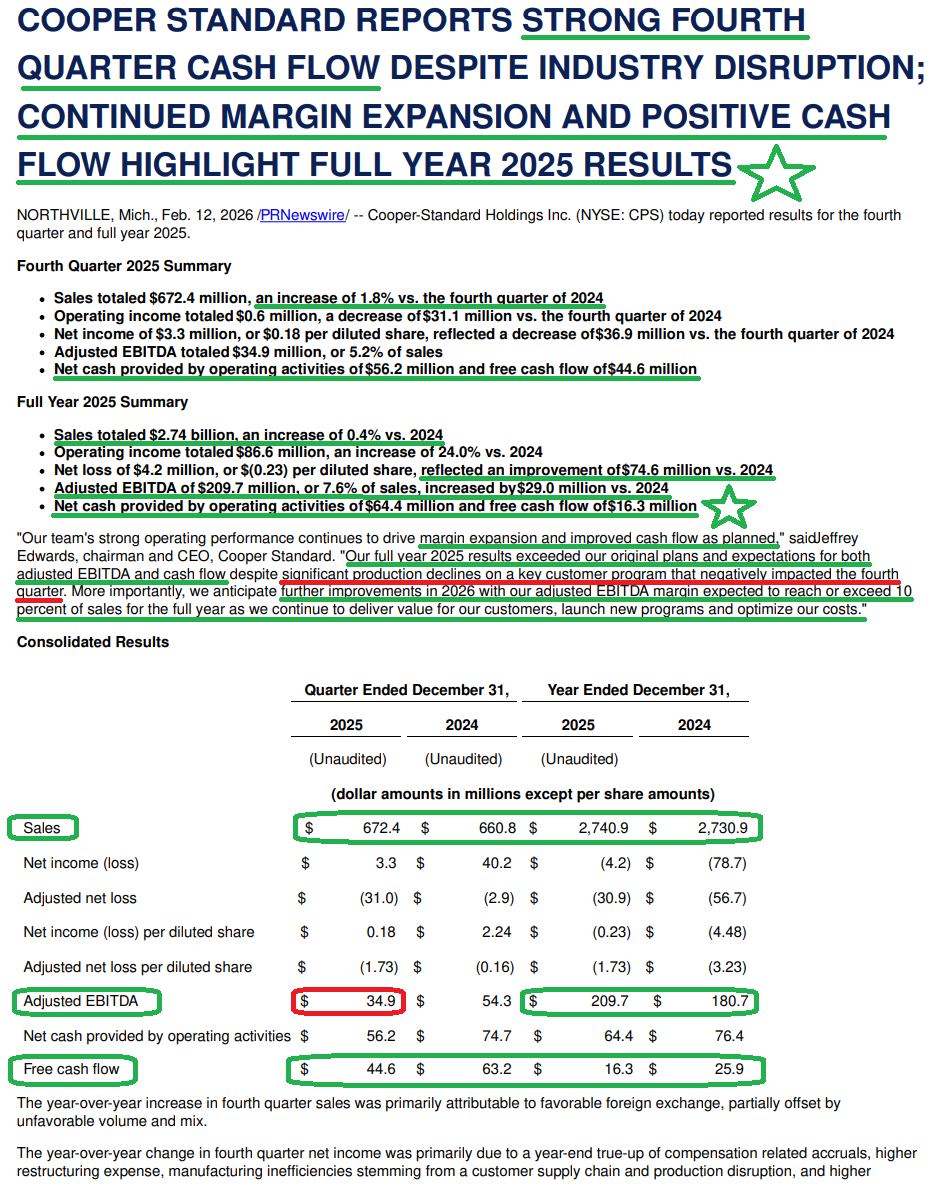
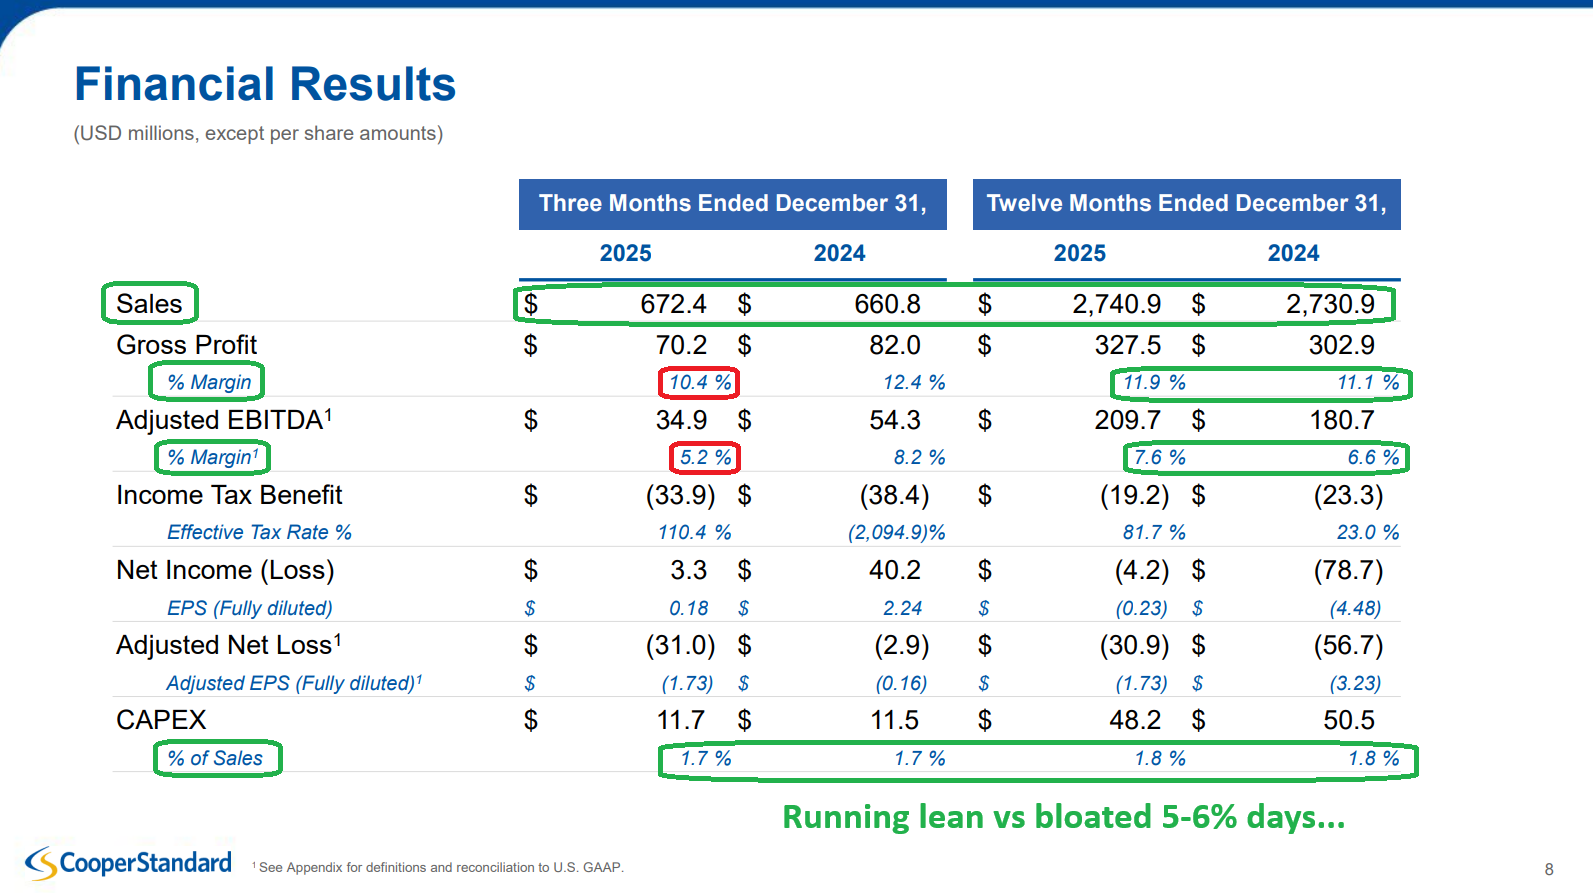
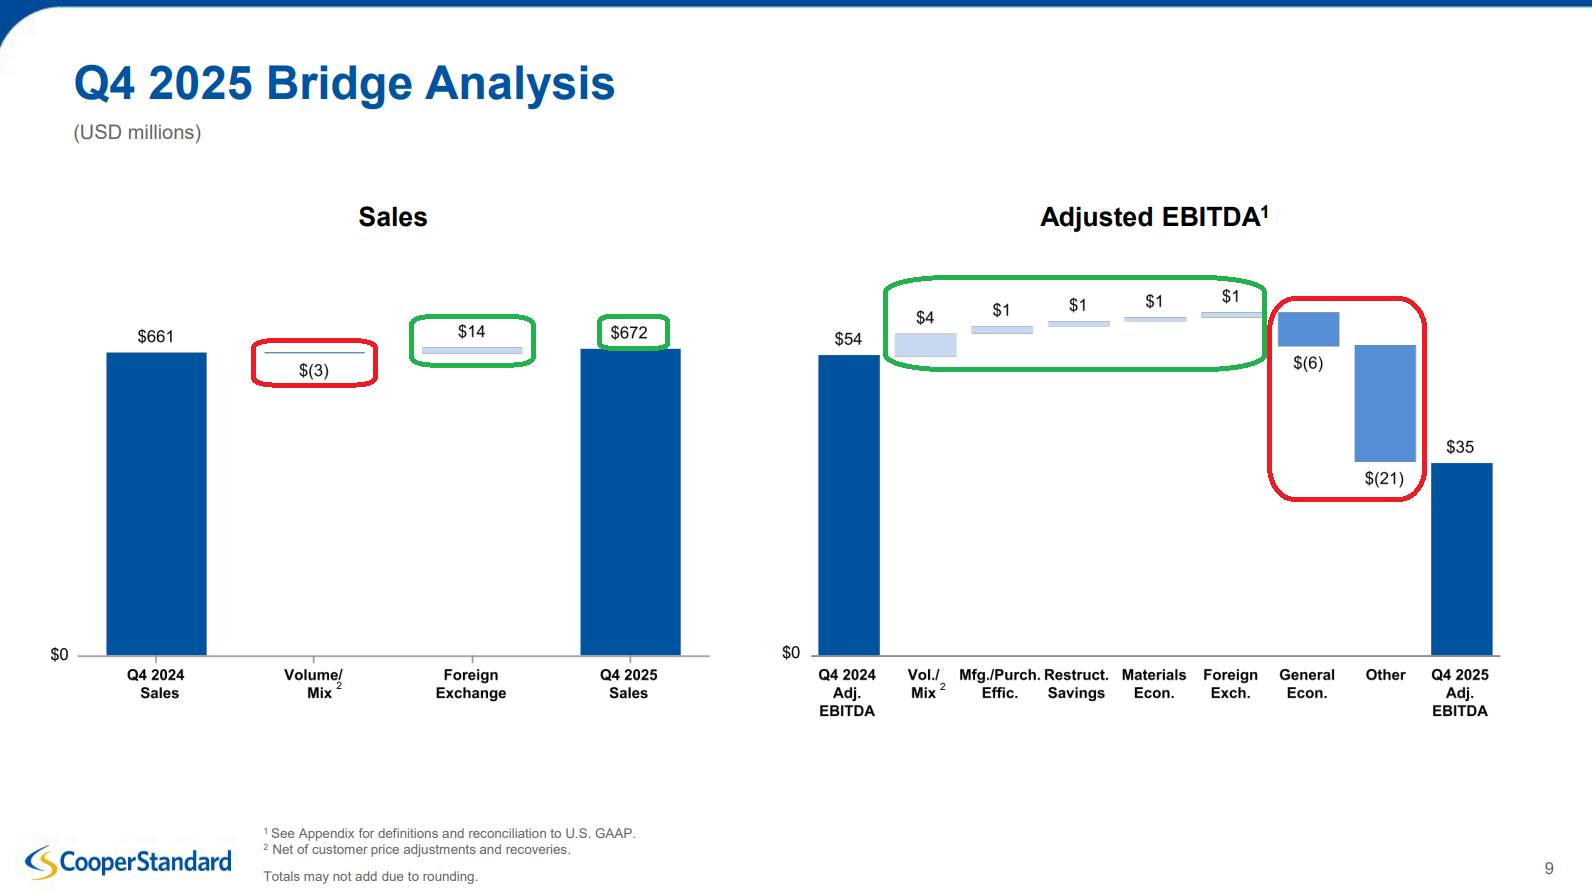
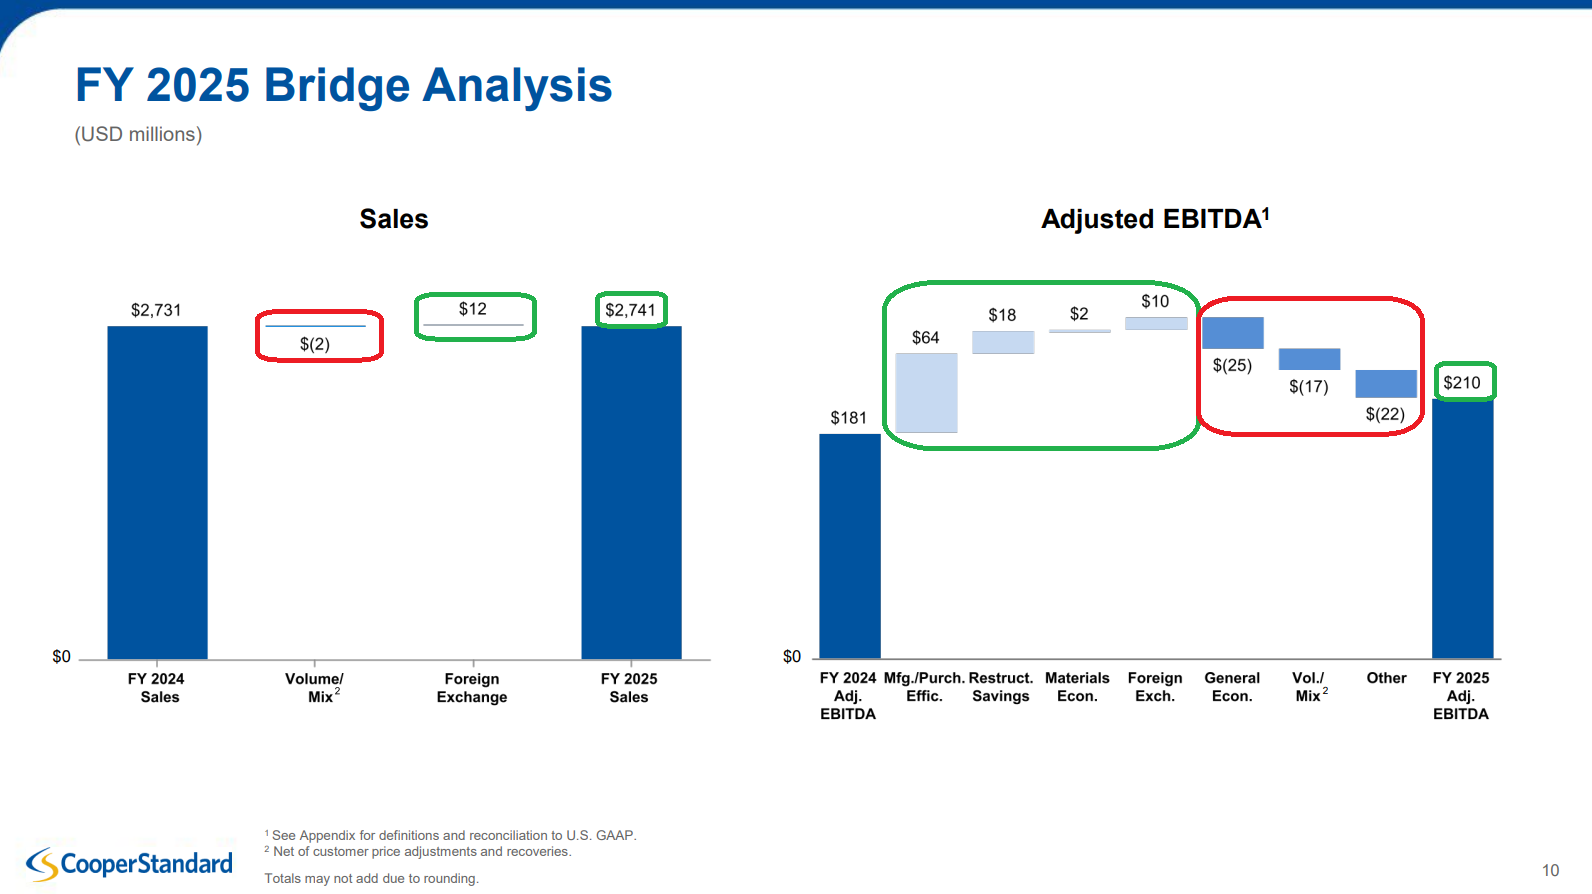
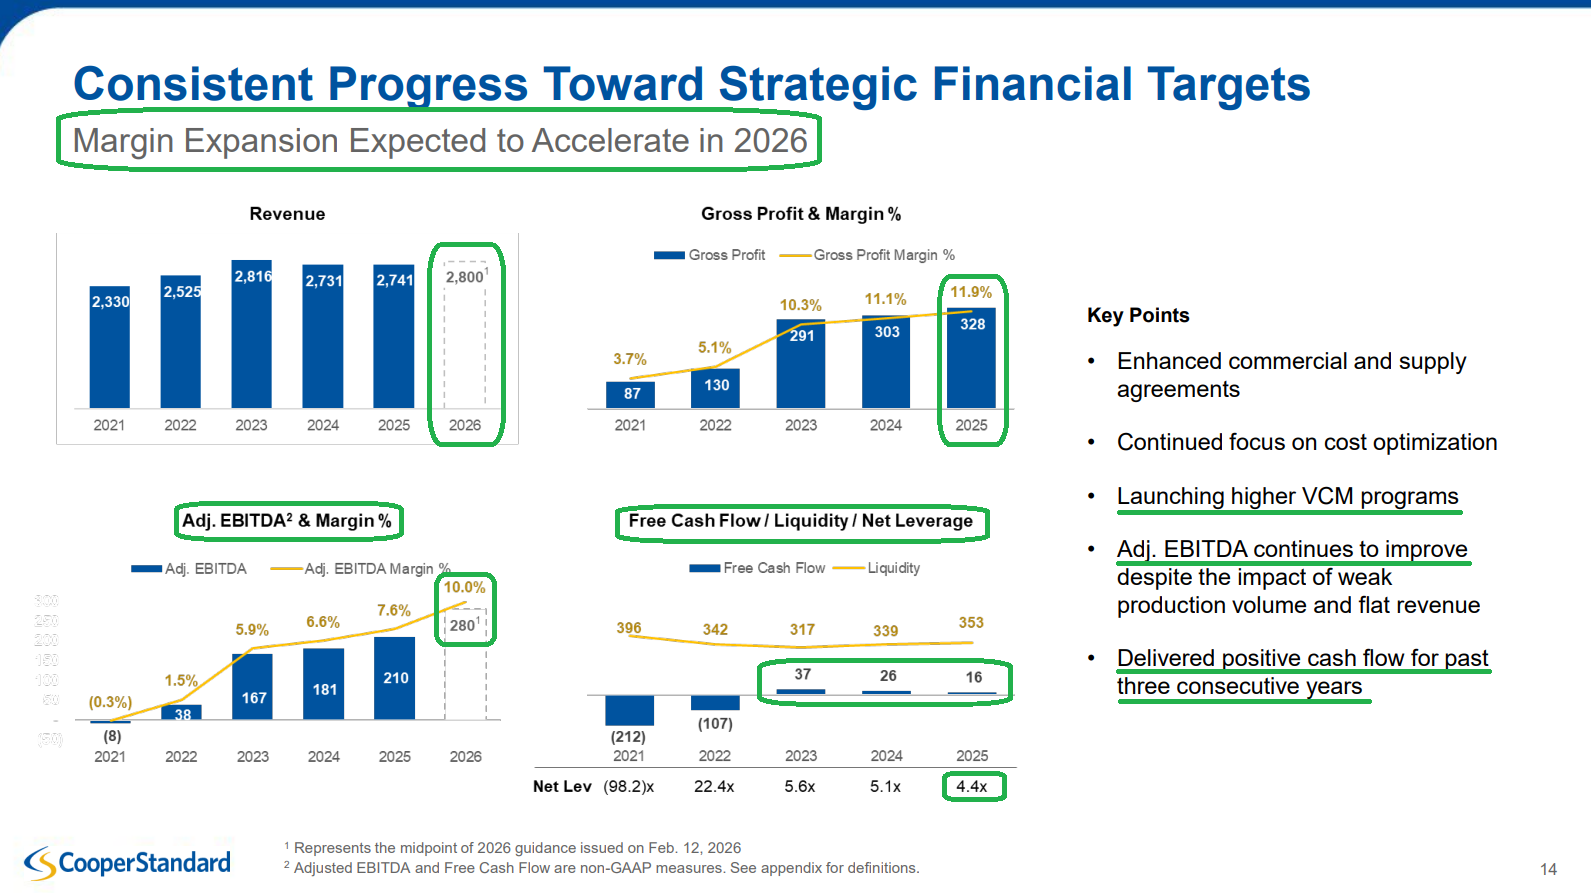
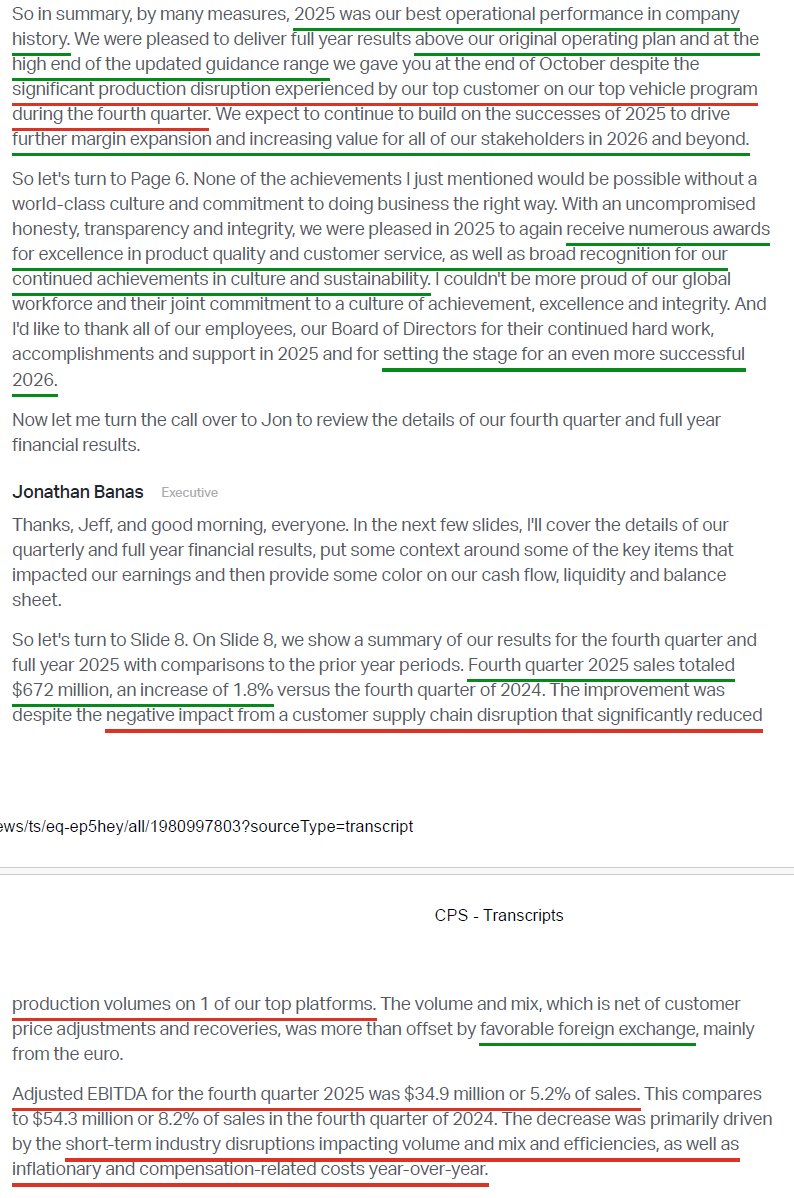
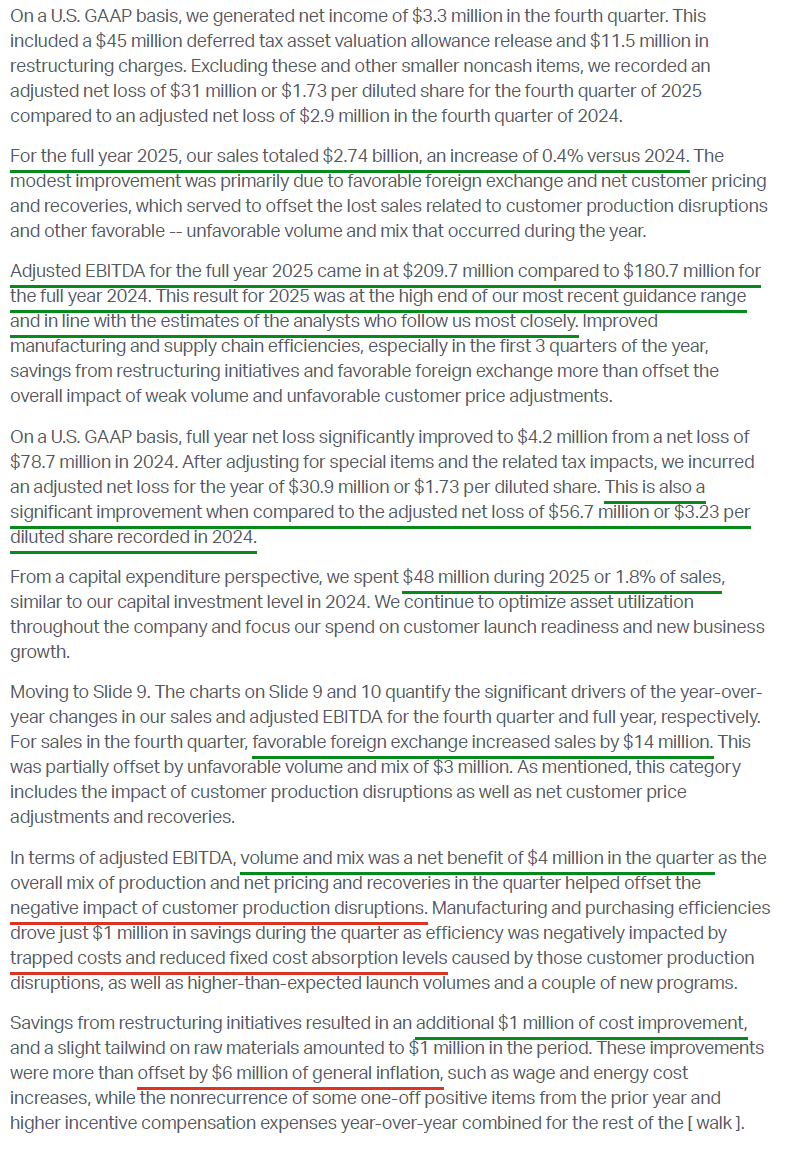
1) Revenue totaled $672.4M (+1.8% Y/Y) in Q4, driven by a $14M FX tailwind that more than offset a $3M volume and mix headwind. This brought FY25 revenue to $2.74B (+0.4%), ahead of prior guidance of $2.68B to $2.72B, driven by a $12M FX tailwind and a $2M volume and mix headwind.
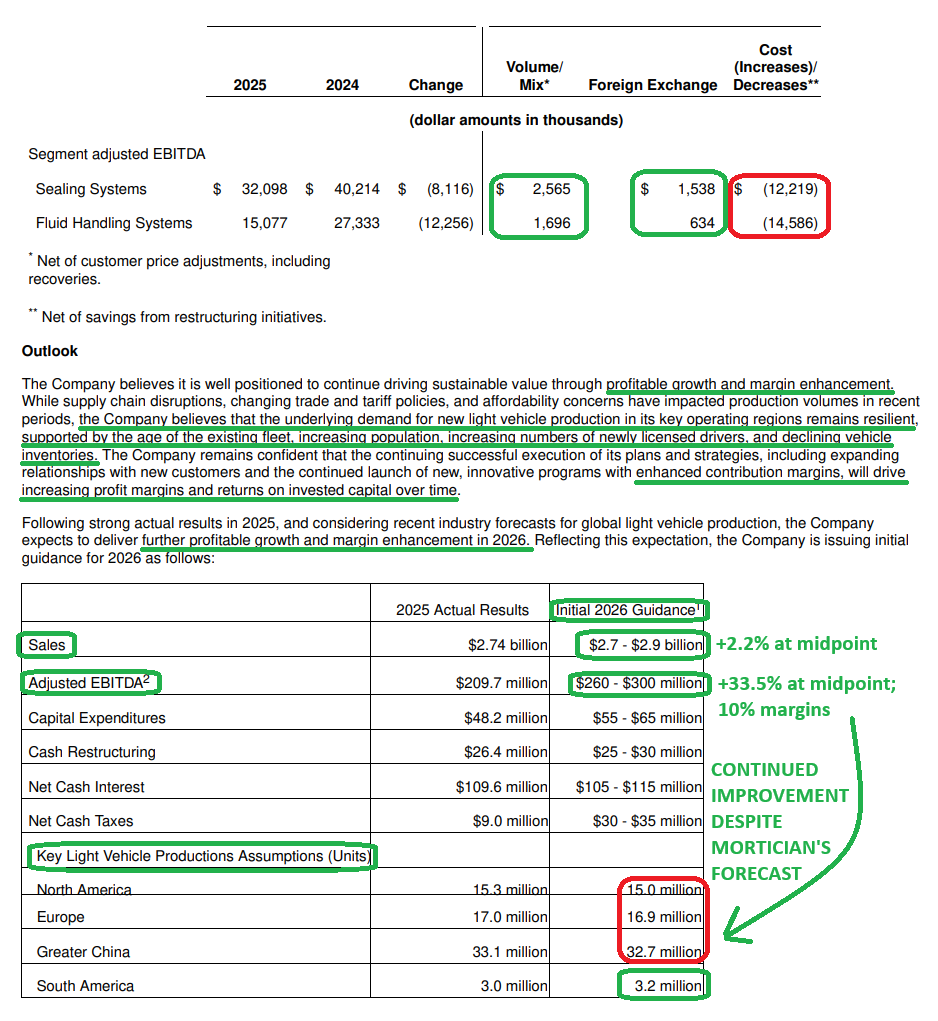
2) Gross margins in the quarter were 10.4% (-200 bps Y/Y), pressured by significant production disruptions on CPS’s largest platform (Ford F-150 and the Novelis fire). For FY25, gross margins still expanded 80 bps to 11.9%. Adjusted EBITDA totaled $34.9M (5.2% margins, -300 bps Y/Y), bringing FY25 adjusted EBITDA to $209.7M (7.6% margins, +100 bps Y/Y), reaching the high end of prior guidance of $200M to $210M. Management expects FY26 adjusted EBITDA of $260M to $300M (+33.5% at the midpoint), which translates to adjusted EBITDA margins reaching or exceeding the all important 10% level. Keep in mind, this margin expansion is based on an overall DECLINE in volumes, setting a low bar for potential upside surprises.
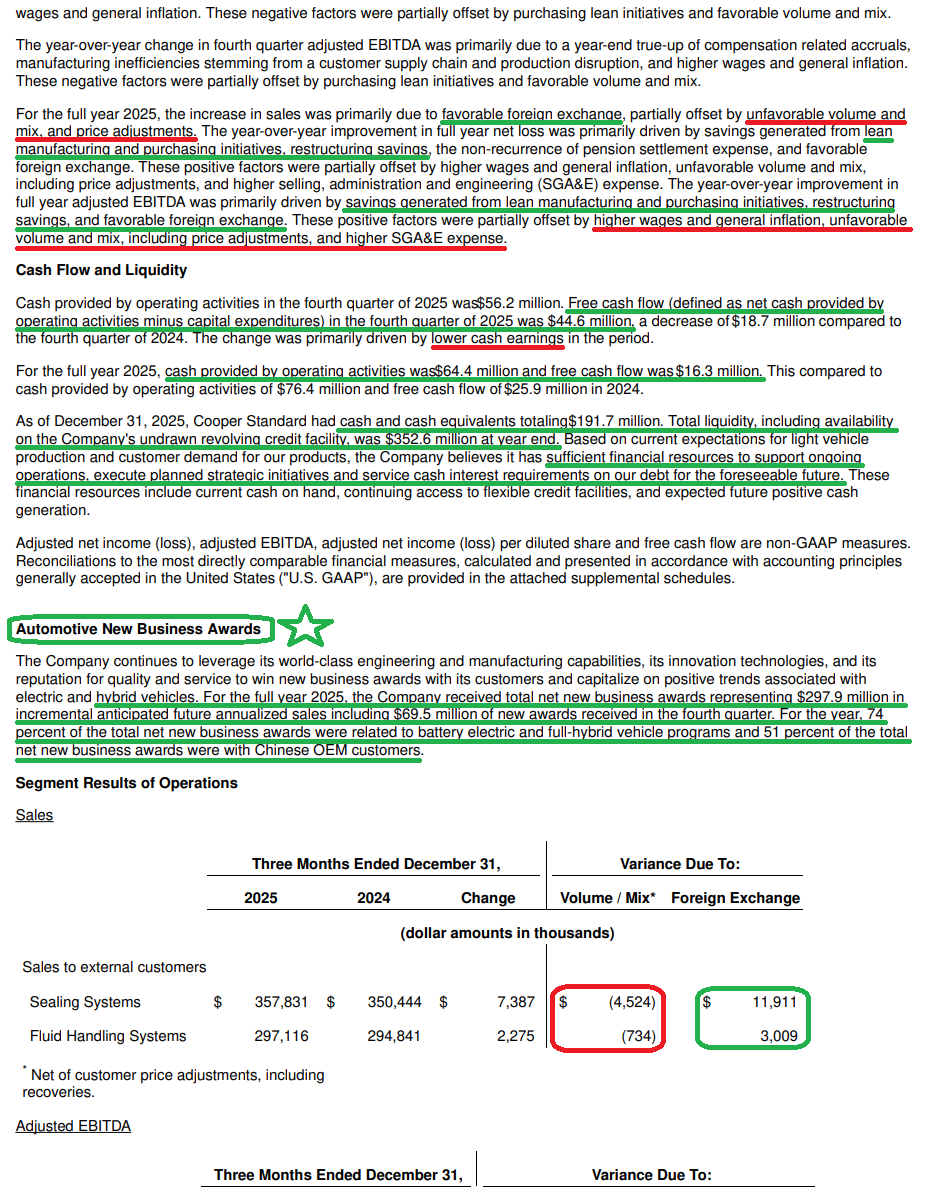
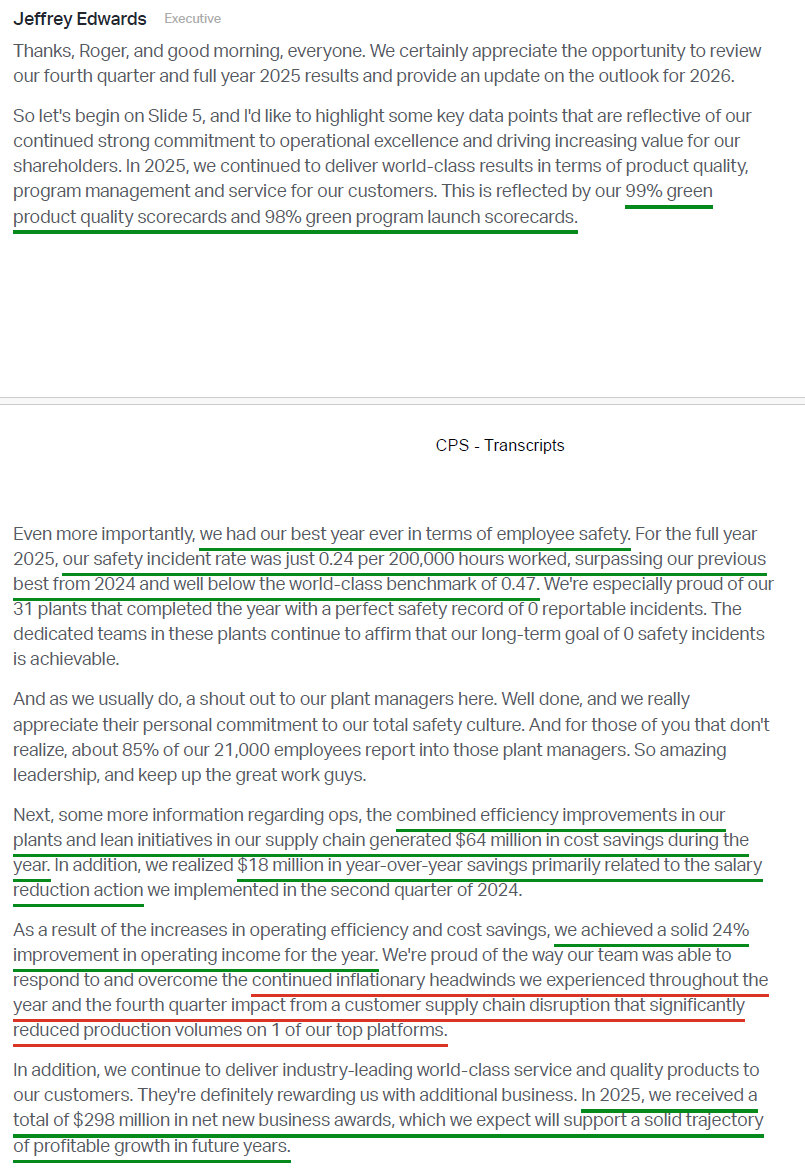
3) CPS won $69.5M of net new awards during Q4, bringing FY25 new business awards to $297.9M (vs $181.4M in FY24, +65% Y/Y). ~74% of total new awards during the year were tied to battery electric (+20% CPV) and full hybrid (+80% CPV) platforms, with 51% of total awards attributable to Chinese OEM platforms. Management expects to win $400M+ in net new awards in FY26 (+34% Y/Y). With many of these awards already in hand and a higher mix tied to Chinese OEMs, which typically move faster to production, CPS expects to realize revenue contributions materially quicker than the traditional 2 to 3 year ramp seen with Western OEMs. CPS also secured several significant supplier recognitions during the year, including GM Supplier of the Year, Ford Supplier of the Year, and the key Toyota Excellent Achievement Award (#1 global leader in hybrids with 50% of total sales).
4) Cooper Standard believes it is strategically positioned to support Chinese OEM growth and their aggressive global expansion plans, expecting to grow and gain share alongside them. Management expects to TRIPLE sales to Chinese OEMs globally over the next five years, while doubling overall APAC regional sales over the same timeframe. Chinese OEMs currently represent ~36% of revenue in China, which is expected to grow to >60% by 2030, with total China revenue expanding at a CAGR north of 15%. Management believes this expansion can be achieved with minimal incremental investment, supporting very attractive ROIC and fantastic margins.
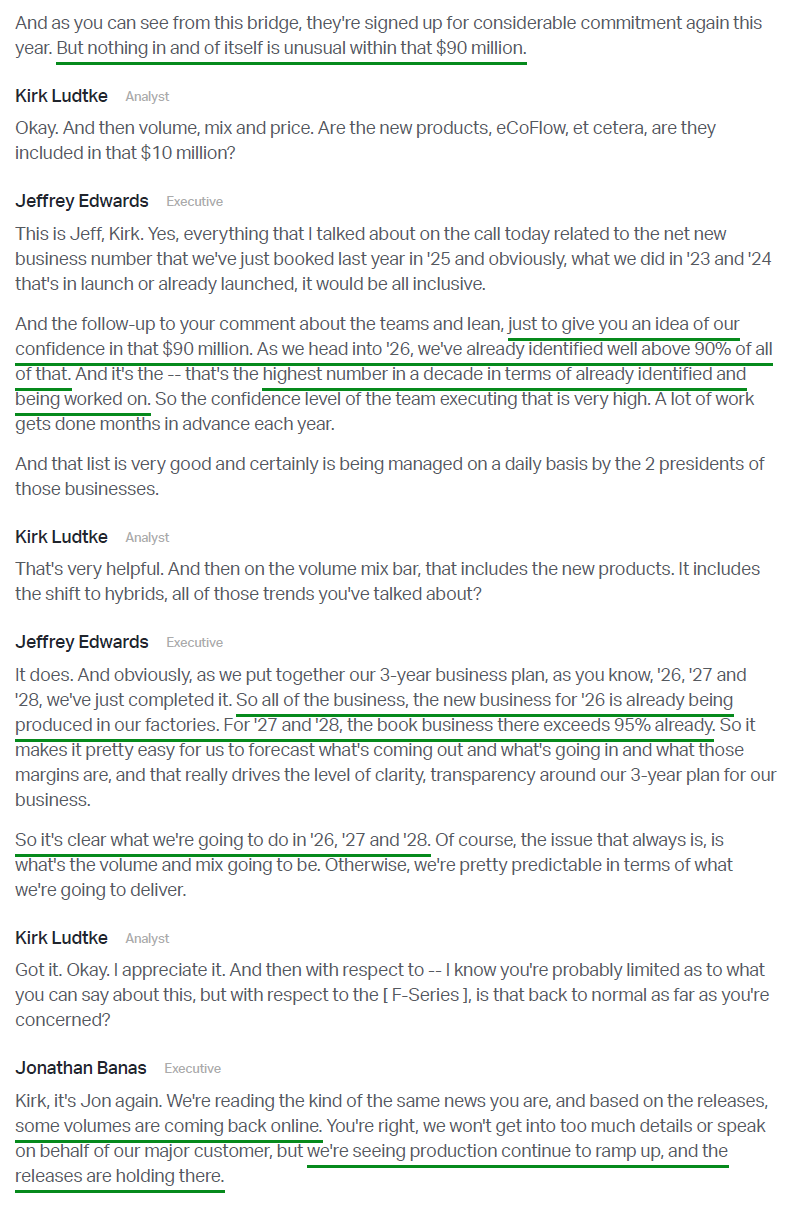
5) Management delivered $64M of manufacturing and purchasing lean savings during FY25, along with $18M of restructuring savings related to the salary reduction implemented in Q2 FY24. This brings total cumulative sustainable cost savings since 2019 to $712M. For FY26, management expects $90M of manufacturing and purchasing lean savings, along with $10M of restructuring savings. Management has already identified well over 90% of these savings, the highest level of visibility in more than a decade in terms of initiatives already identified and in progress.
6) While CPS did not provide concrete updates on the global debt refi (first lien: $613M at 13.5% and third lien: $389M at 10.625%), management indicated the goal and clear preference is to complete the refi before the third lien becomes current in mid March and the first lien in mid May, while highlighting meaningful progress in evaluating potential paths forward. With net cash interest of $105M to $115M expected in FY26, the implications of a refi are massive and could translate to ~$1.90 per share in pre tax savings.
7) Free cash flow during Q4 totaled $44.6M (vs $63.2M last year), bringing FY25 FCF to $16.3M (vs $25.9M last year) and marking the third consecutive year of positive free cash flow. Management expects to remain free cash flow positive in FY26, with the midpoint of guidance implying ~$50M for the full year, more than tripling FY25 levels.
8) Capex during FY25 totaled $48.2M, just 1.8% of net sales, as management continues to operate lean compared to the bloated 5% to 6% of net sales seen historically. Management expects $55M to $65M in capex during FY26 (~2.14% of net sales at the midpoint) and, as they continue focusing on cash preservation and high return opportunities, believe they are on track to TRIPLE ROIC by FY28.
9) Cooper Standard ended the year with cash and cash equivalents of $191.7M. Its revolving credit facility of $160.9M remains undrawn, bringing total liquidity to $352.6M. Net leverage ended the year at 4.4x, with management maintaining its goal of reducing the net leverage ratio to ~2x or lower by 2028 (not assuming a global refi).
10) For FY26, management expects net sales of $2.7B to $2.9B (+2.2% at the midpoint). This growth comes despite mortician forecast assumptions calling for North America production to decline to 15M units (-0.3M), Europe to 16.9M units (-0.1M), and Greater China to 32.7M units (-0.4M), with South America the lone bright spot at 3.2M units (+0.2M), implying a total global production decline of ~0.6M units (-0.9%).
Earnings Call Highlights
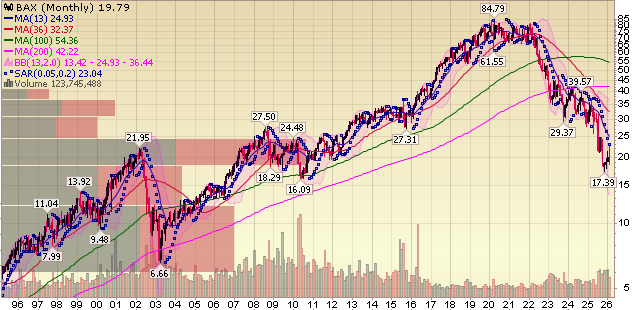
Baxter Update
Q4 Earnings Breakdown

10 Key Points
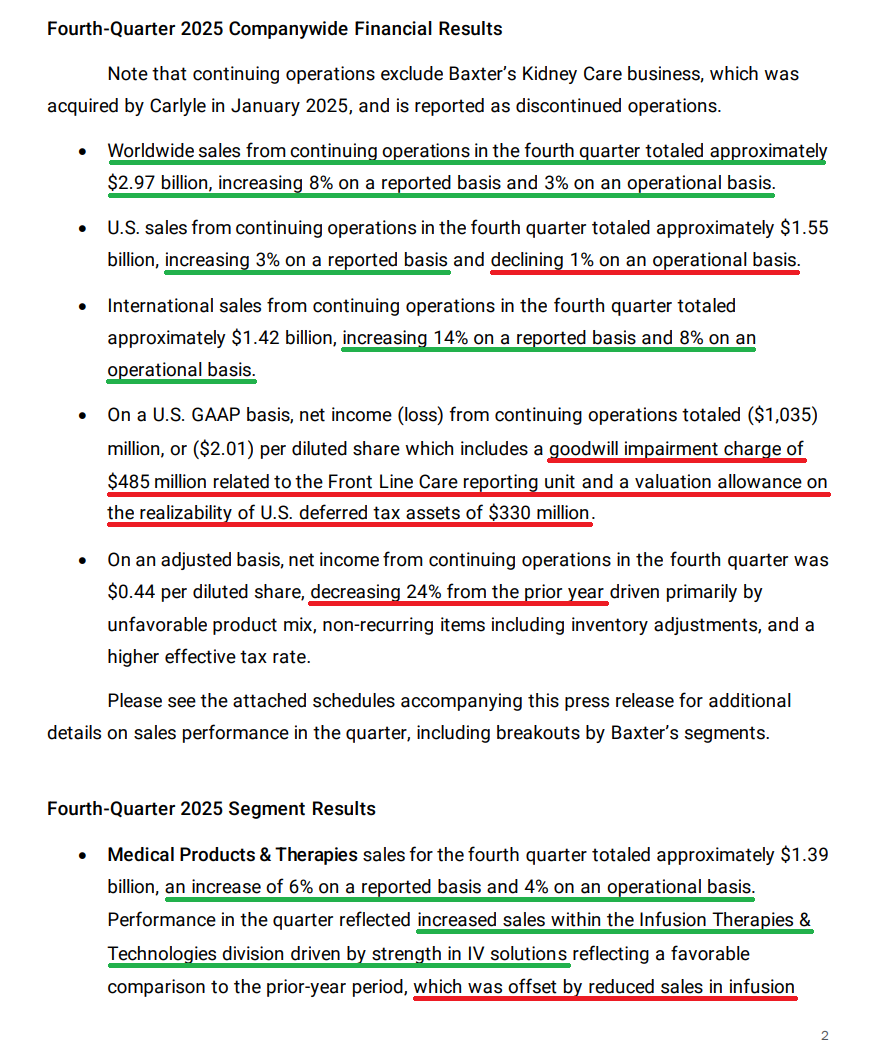
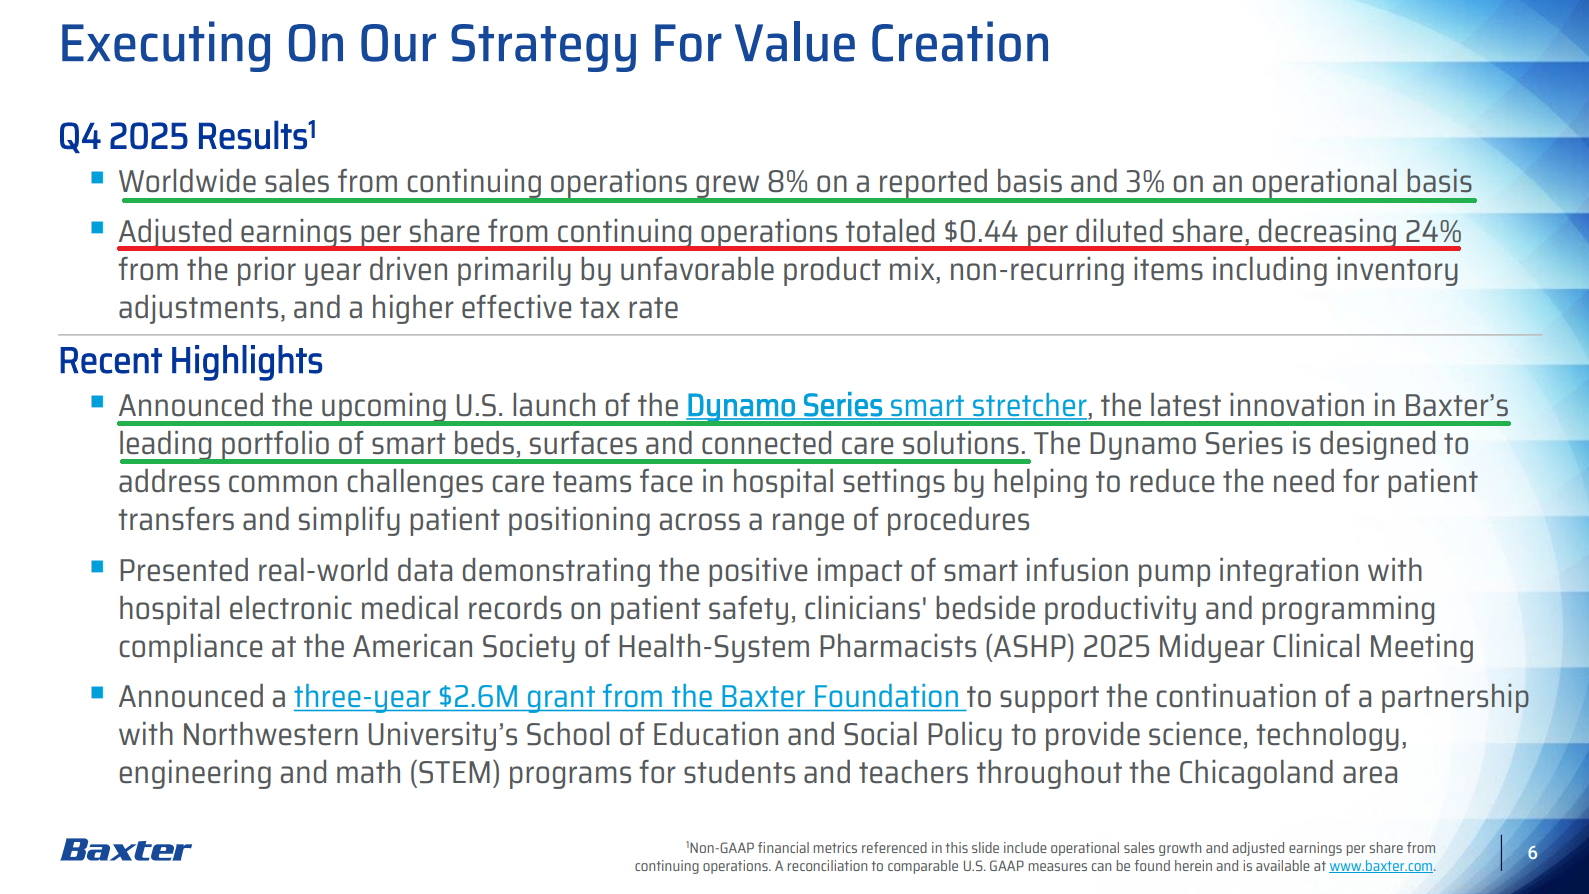
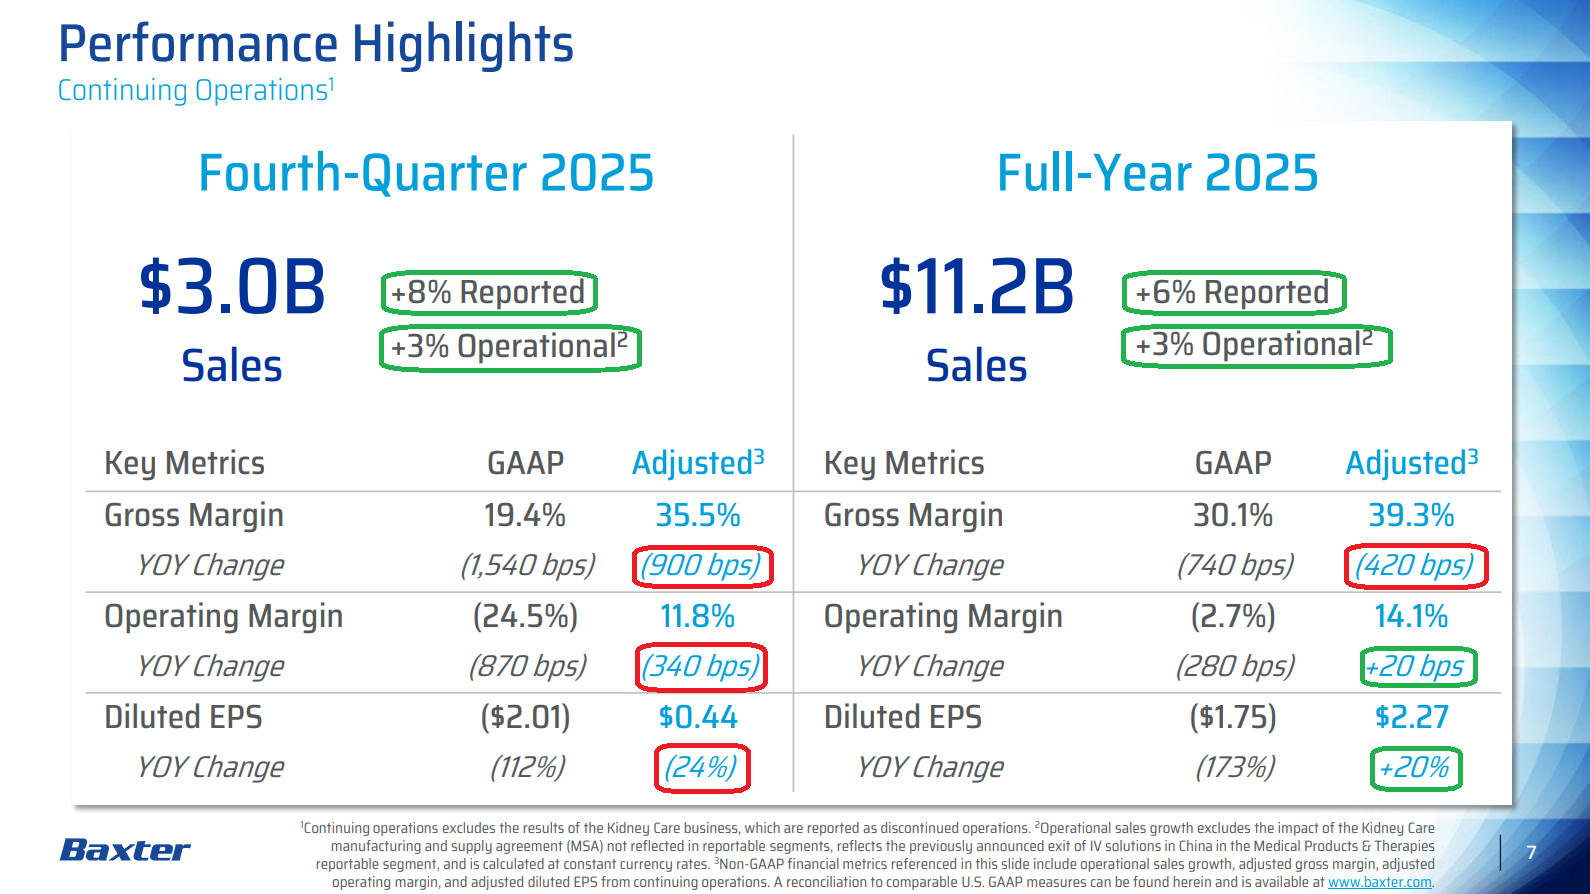
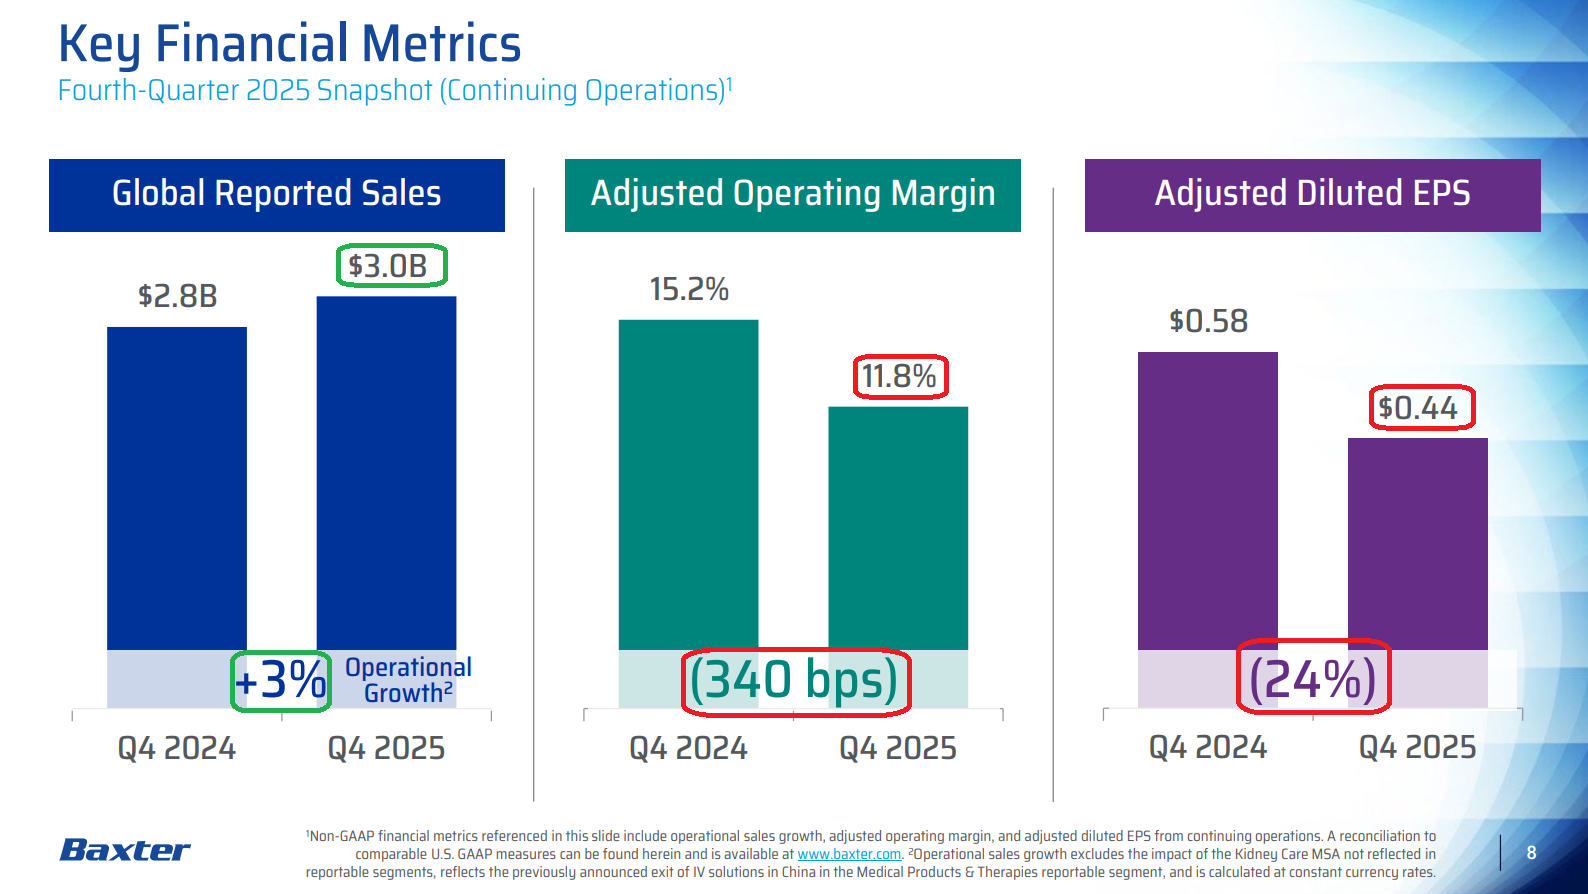
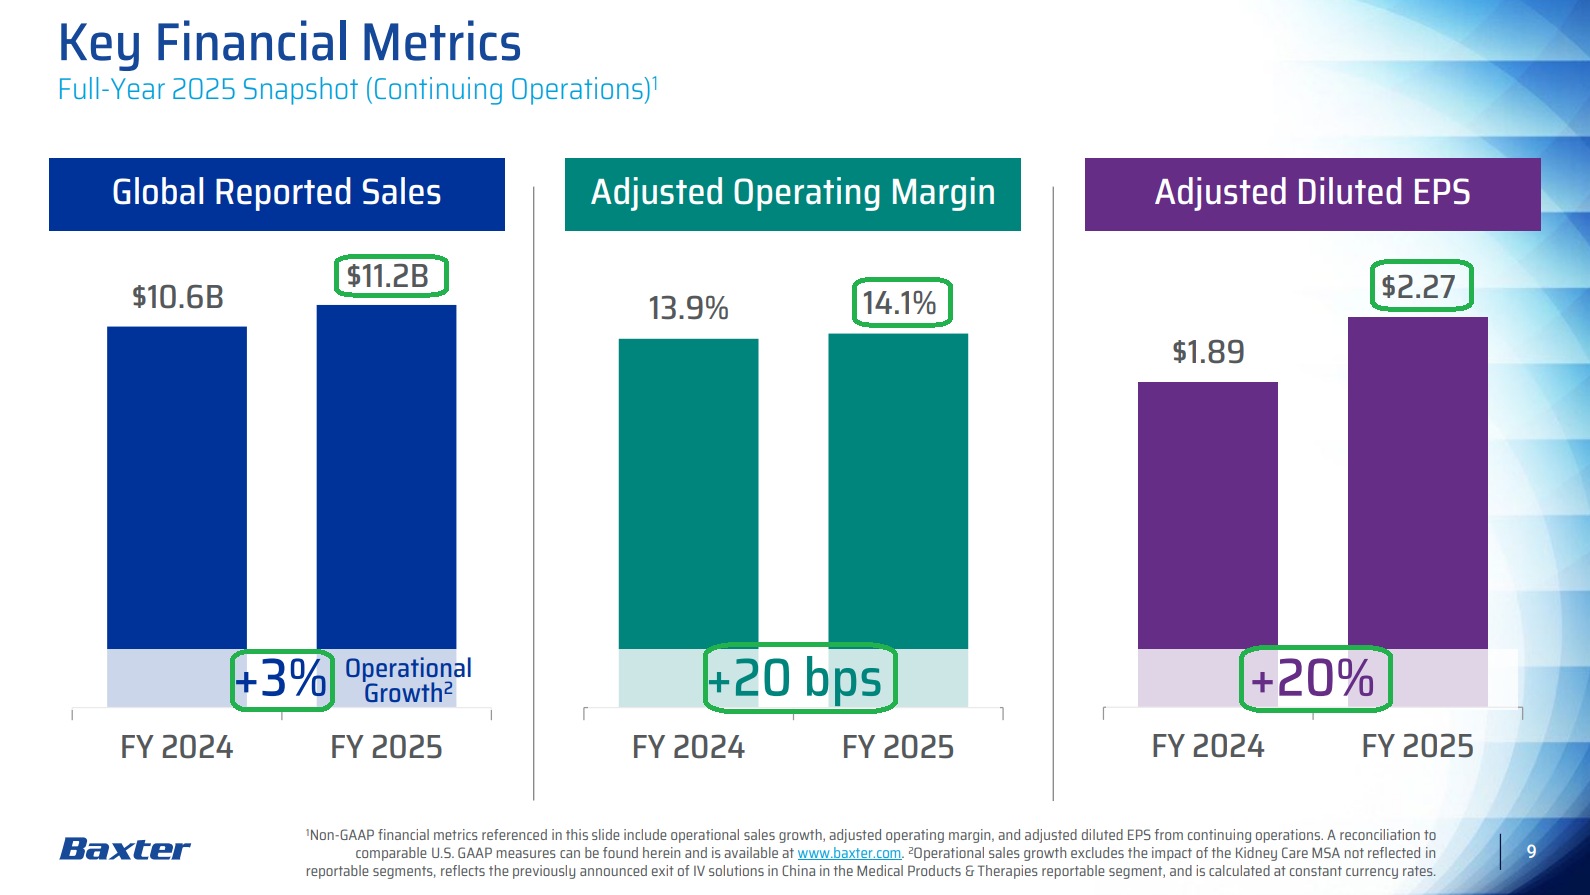
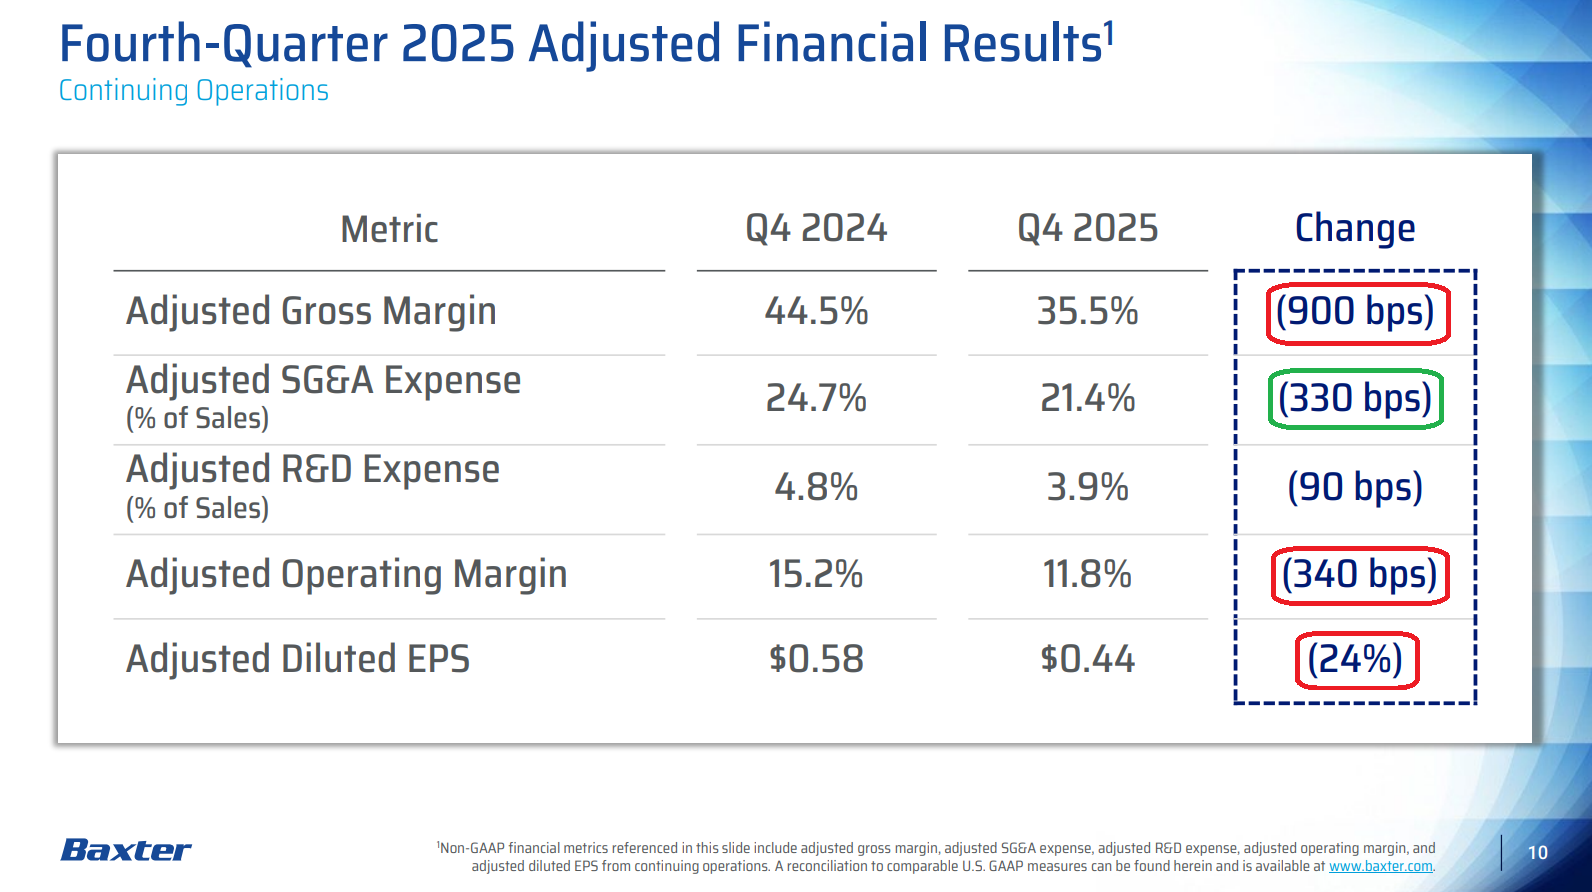
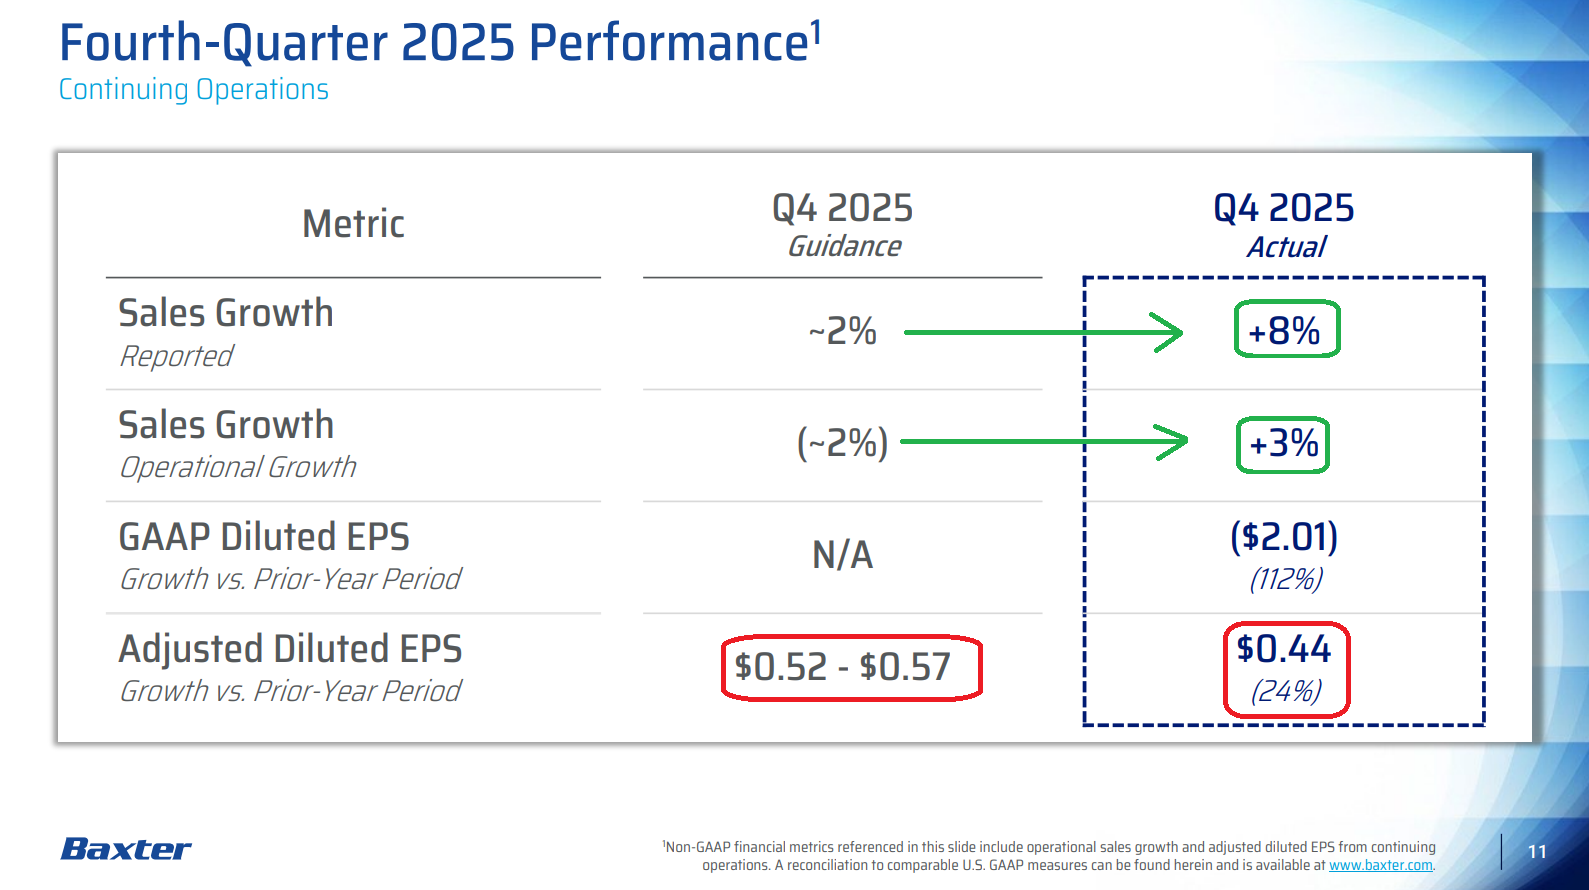
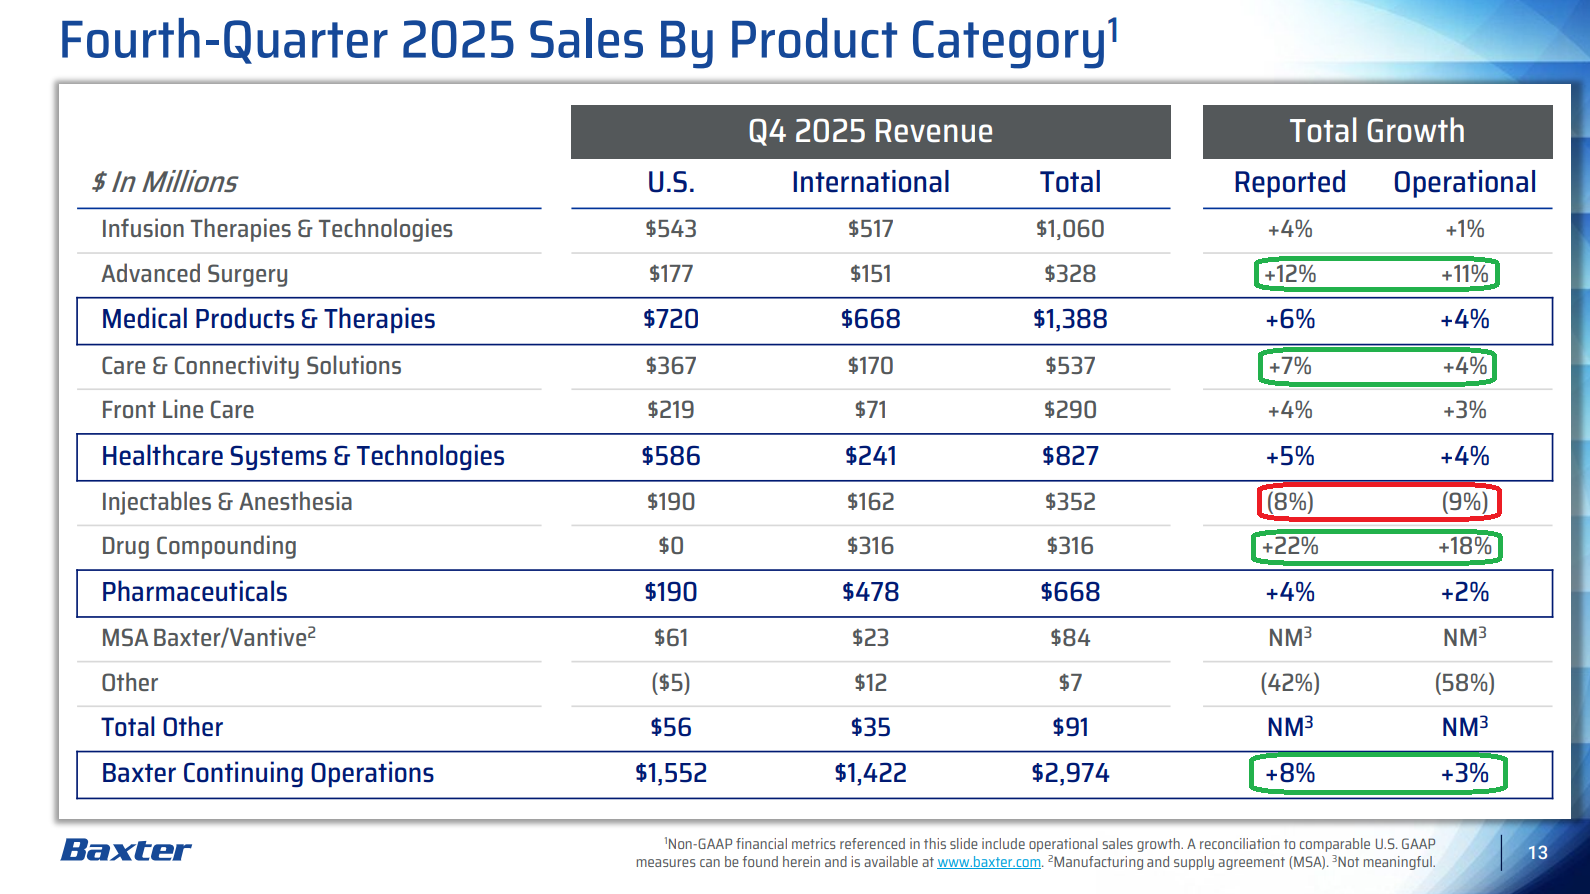
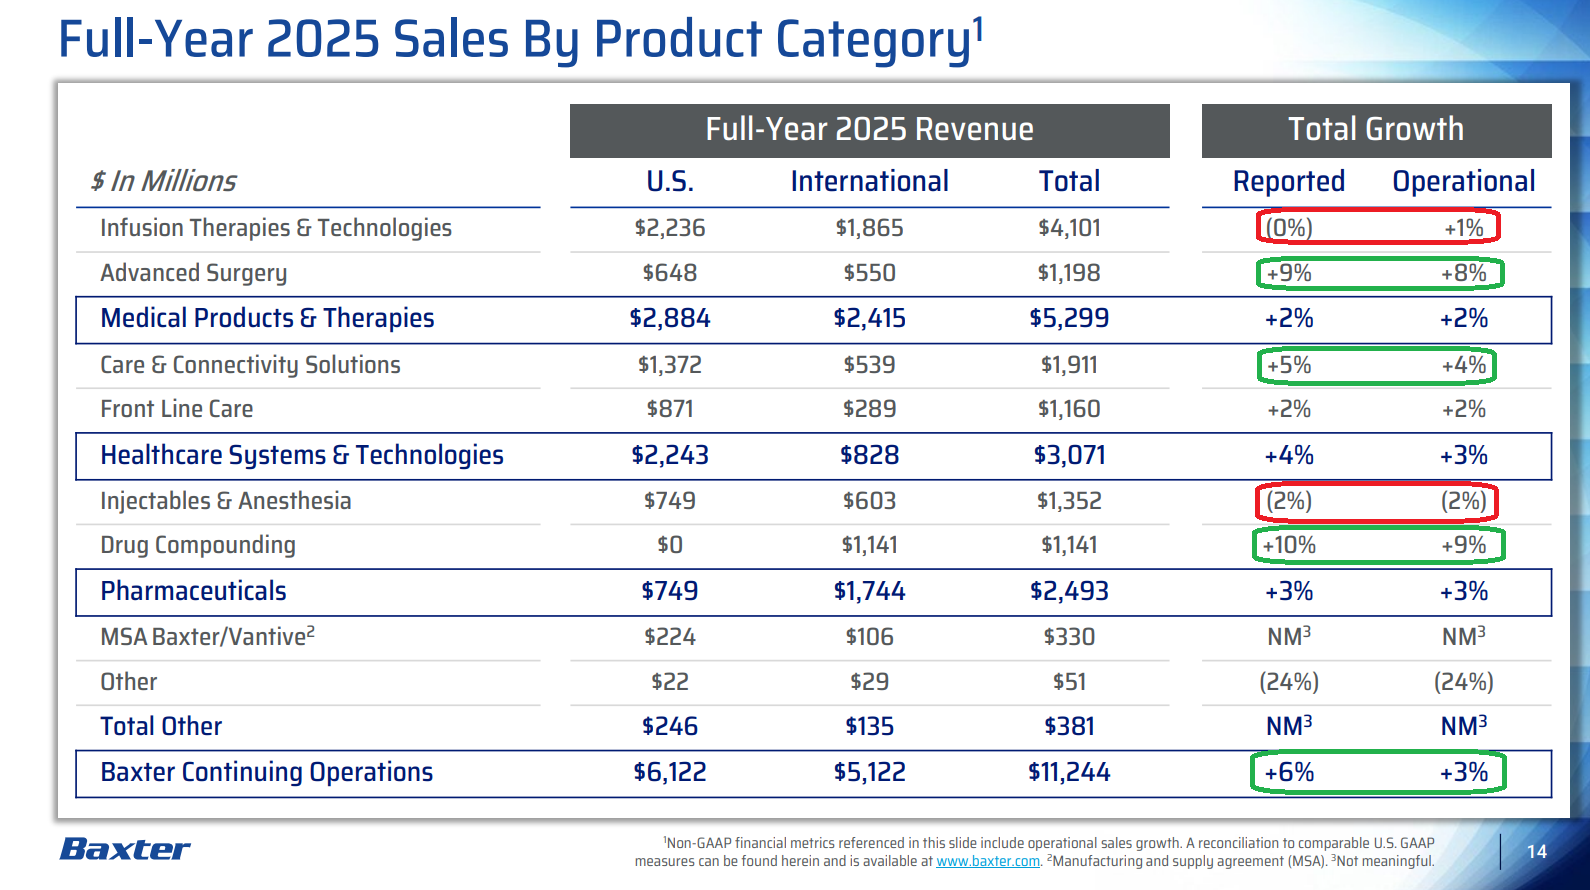
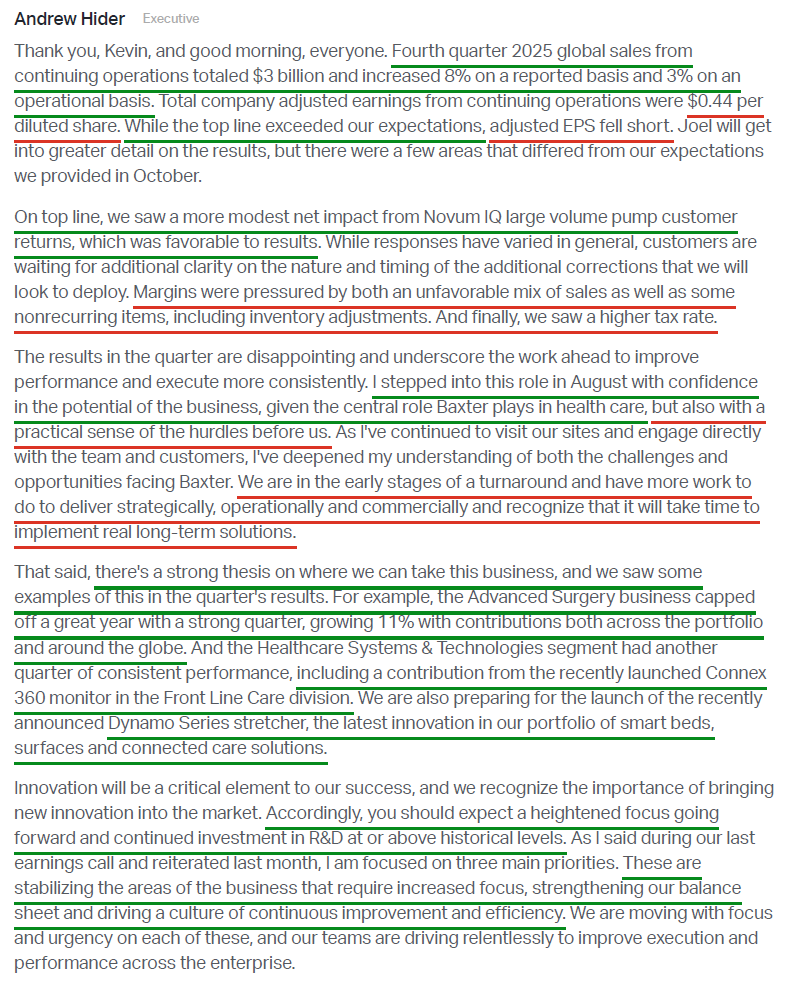
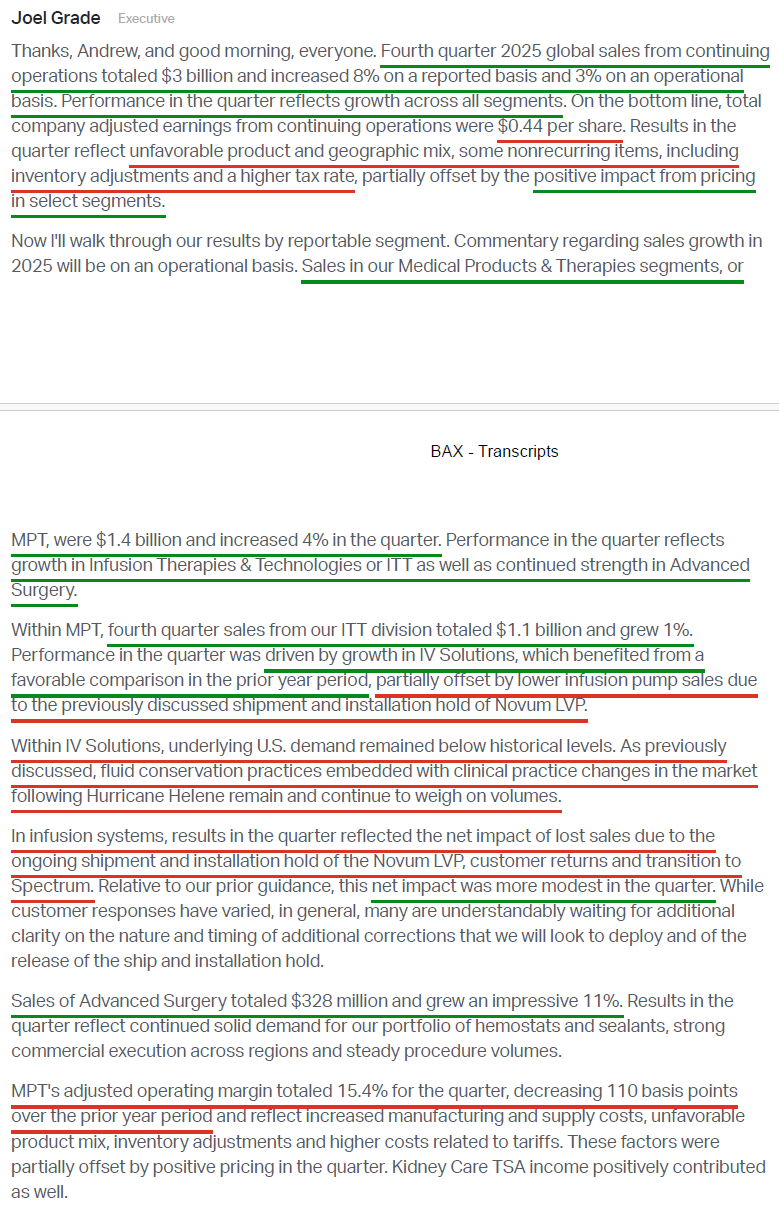
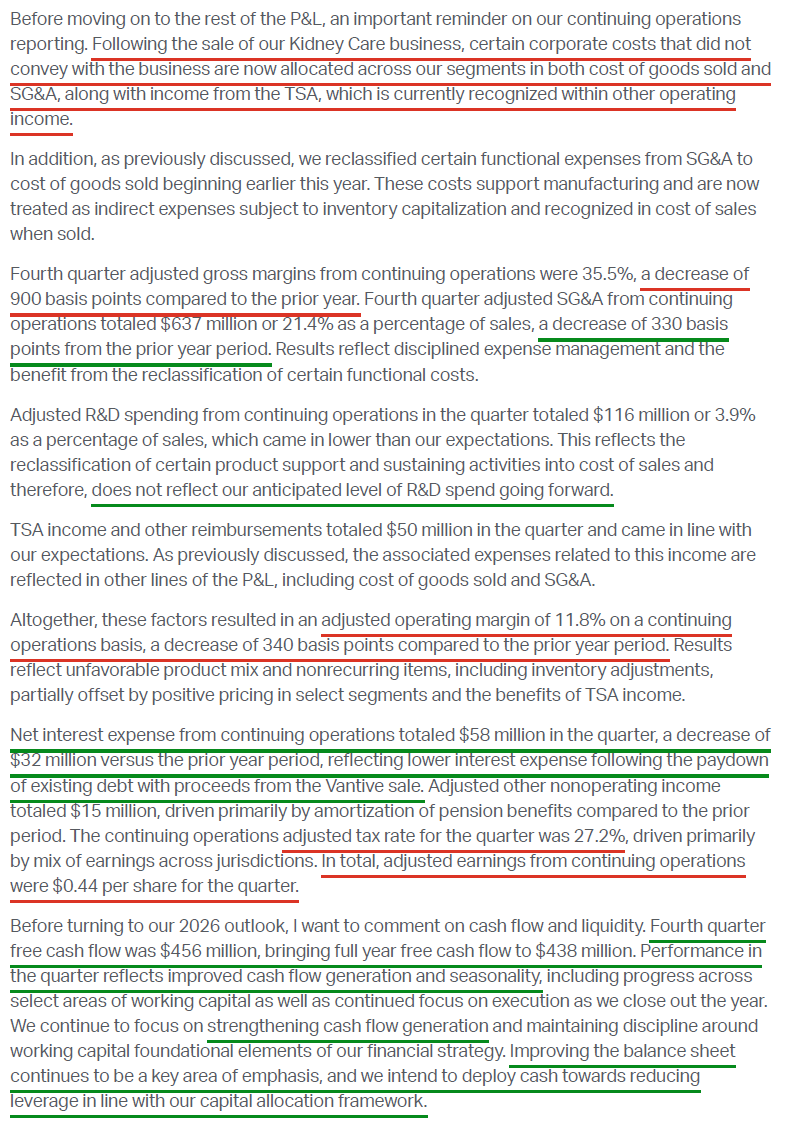
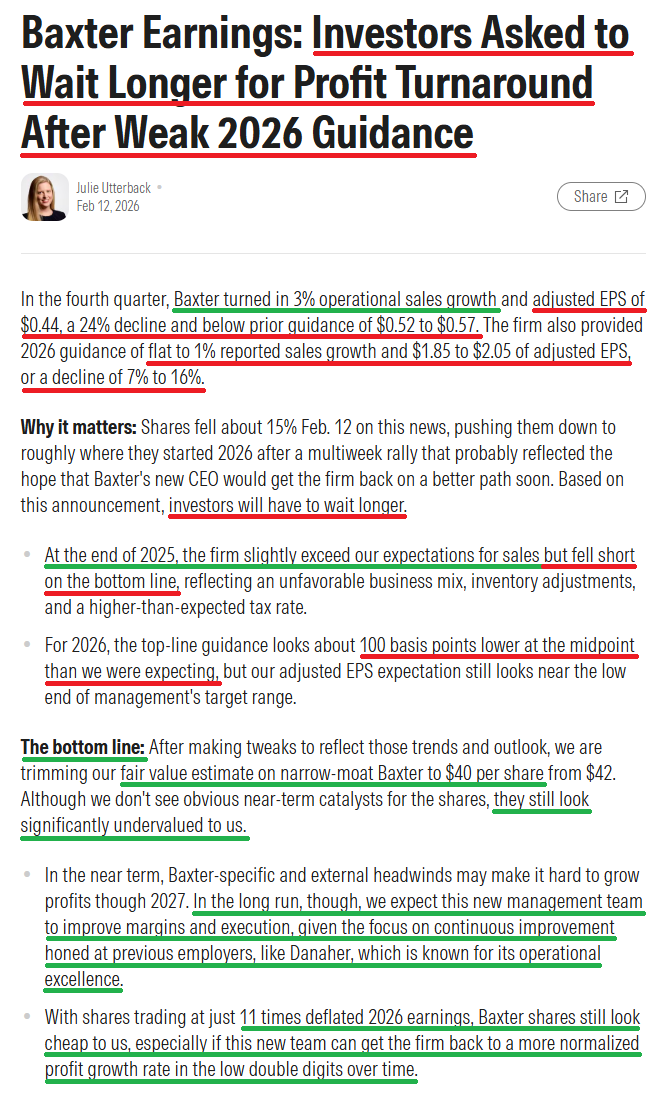
1) Revenue of $2.97B (+8% reported, +3% operational) topped consensus of $2.83B and prior guidance of $2.8B (+2% reported, -2% operational), with growth across all three segments. This brings FY25 revenue to $11.24B (+6% reported, +3% operational). Adjusted EPS of $0.44 (-24% Y/Y) missed consensus of $0.52 and prior guidance of $0.52 to $0.57, with the shortfall driven by unfavorable product mix and certain nonrecurring items. For FY25, adjusted EPS totaled $2.27 (+20% Y/Y).
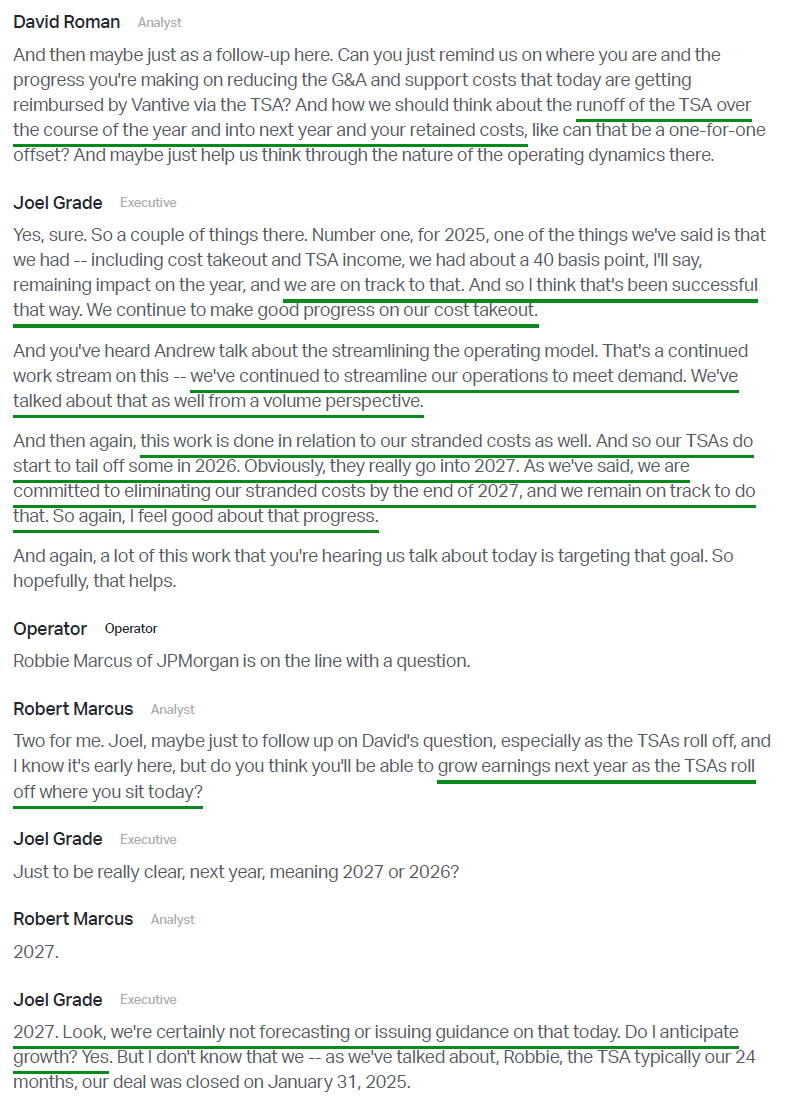
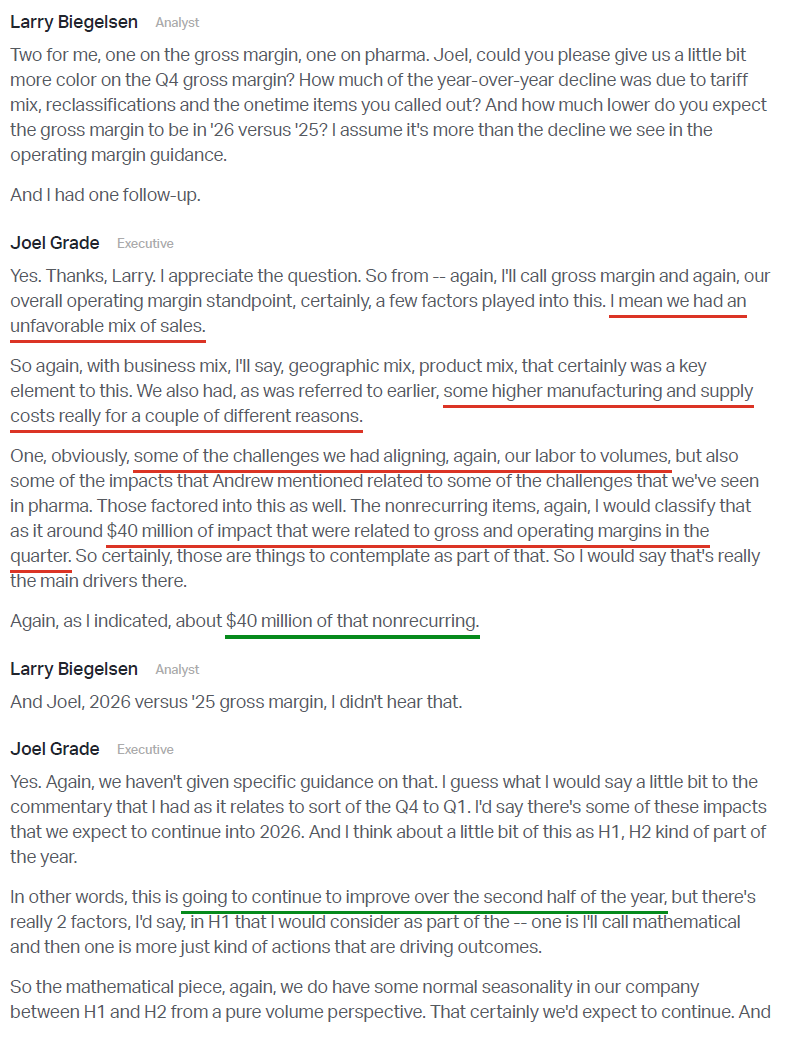
2) Adjusted operating margins came in at 11.8% (-340 bps), bringing FY25 margins to 14.1% (+20 bps). This fell below expectations of 14.5% to 15%, driven by unfavorable mix and certain nonrecurring items, including inventory adjustments. Management expects FY26 adjusted operating margins to land between 13% and 14%, below consensus estimates of 14.7%. The most important driver of margin expansion going forward remains the stranded costs associated with the Vantive deal, which management expects to begin tapering in 2026 and fully eliminate by the end of 2027.
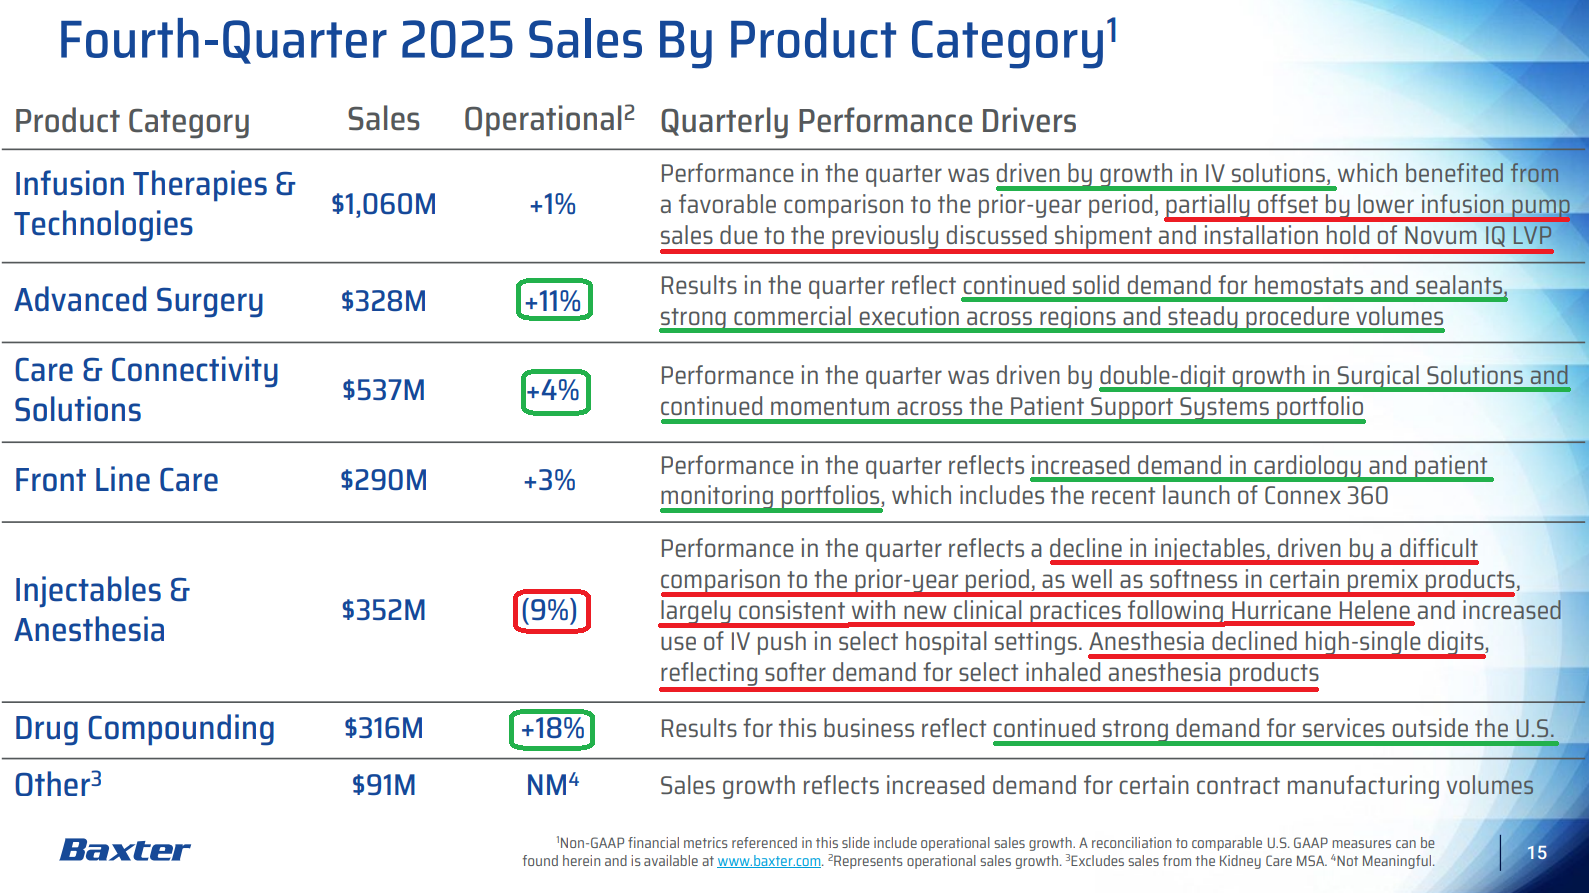
3) The IV Solutions segment delivered solid growth in Q4, largely driven by favorable comps from the prior year’s Hurricane Helene impact. Management noted that underlying U.S. demand remains ~10% to 15% below historical levels, which they now view as the effective new baseline. To reflect the lower demand environment, the company has taken steps to right-size its support footprint and align labor with current volumes. While the recovery is taking longer than initially expected, Baxter experienced a similar dynamic following Hurricane Maria in 2017, which took ~2 years for volumes to normalize.
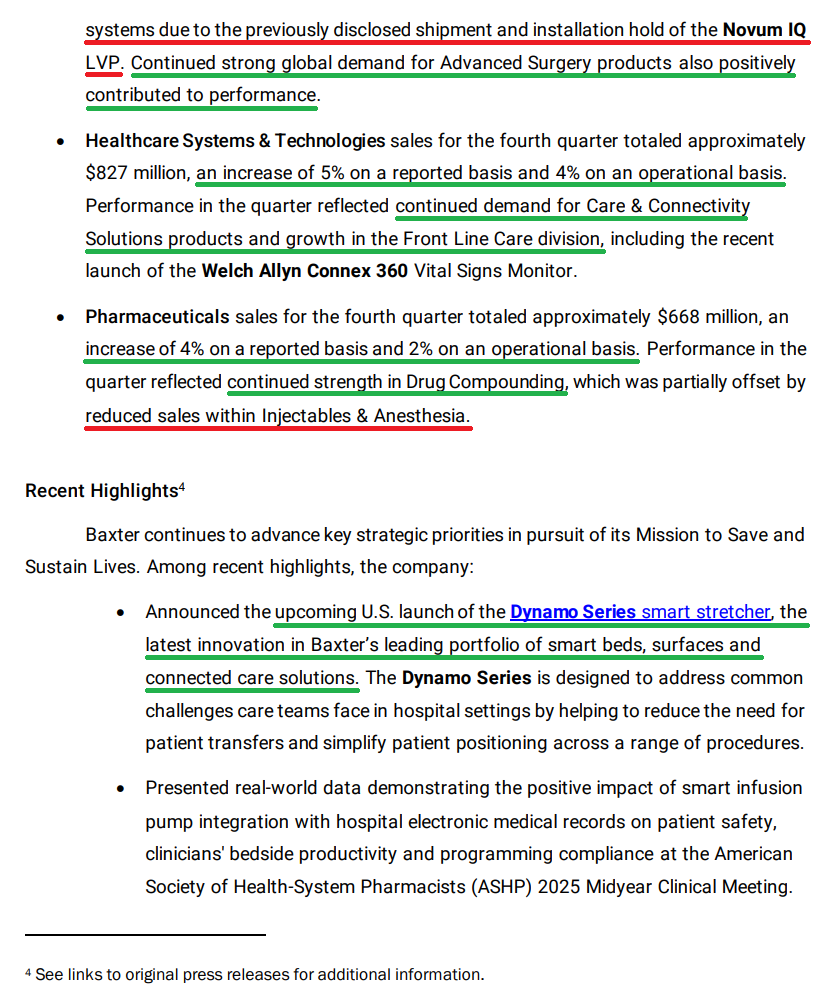
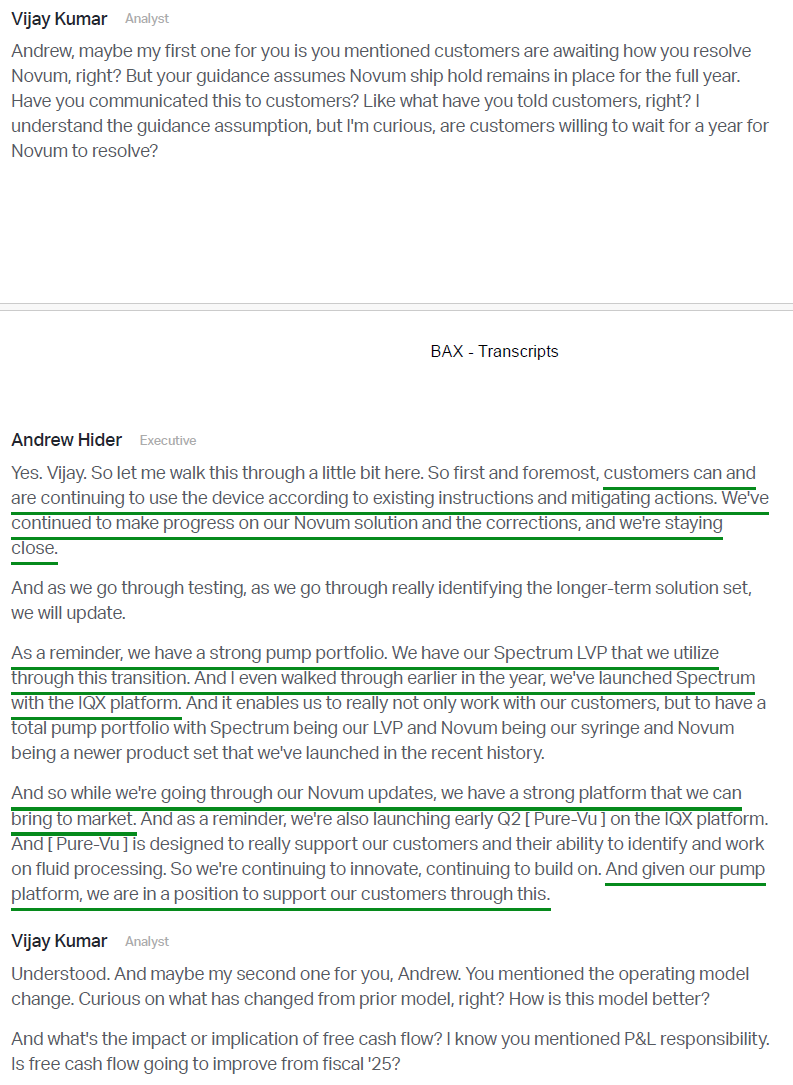
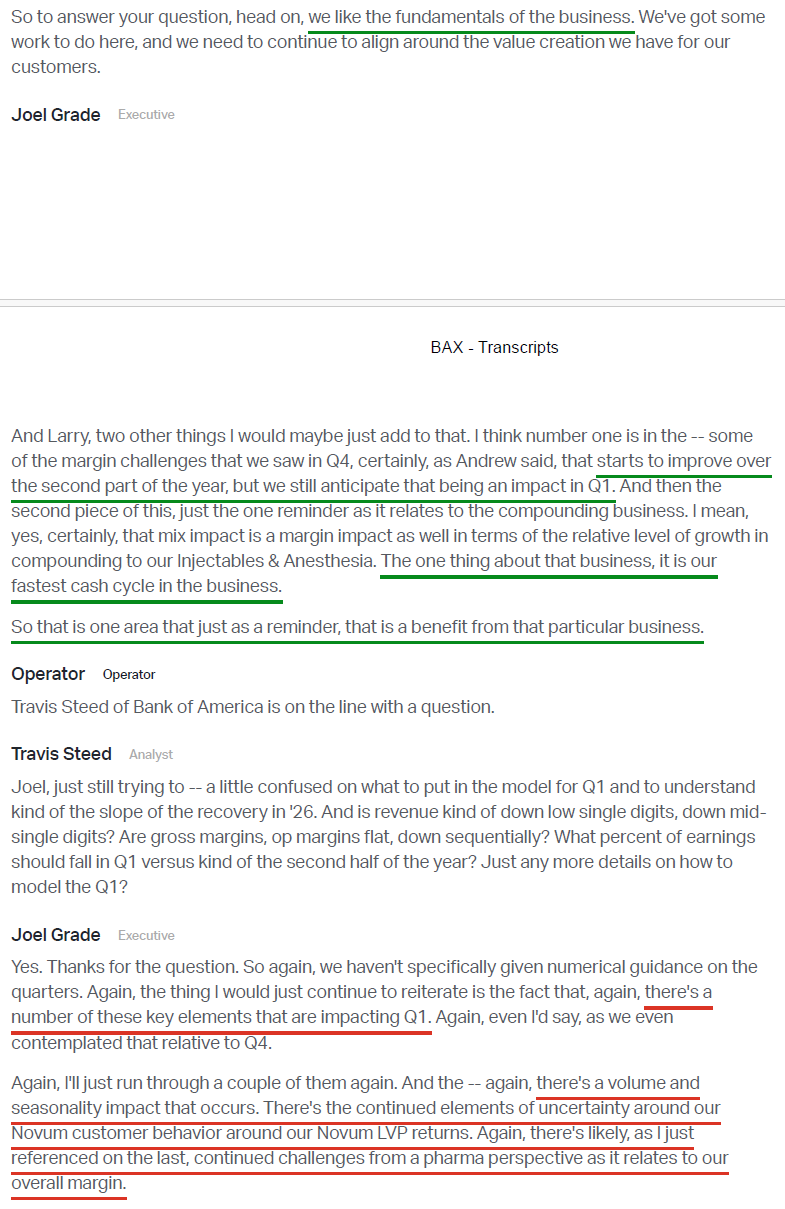
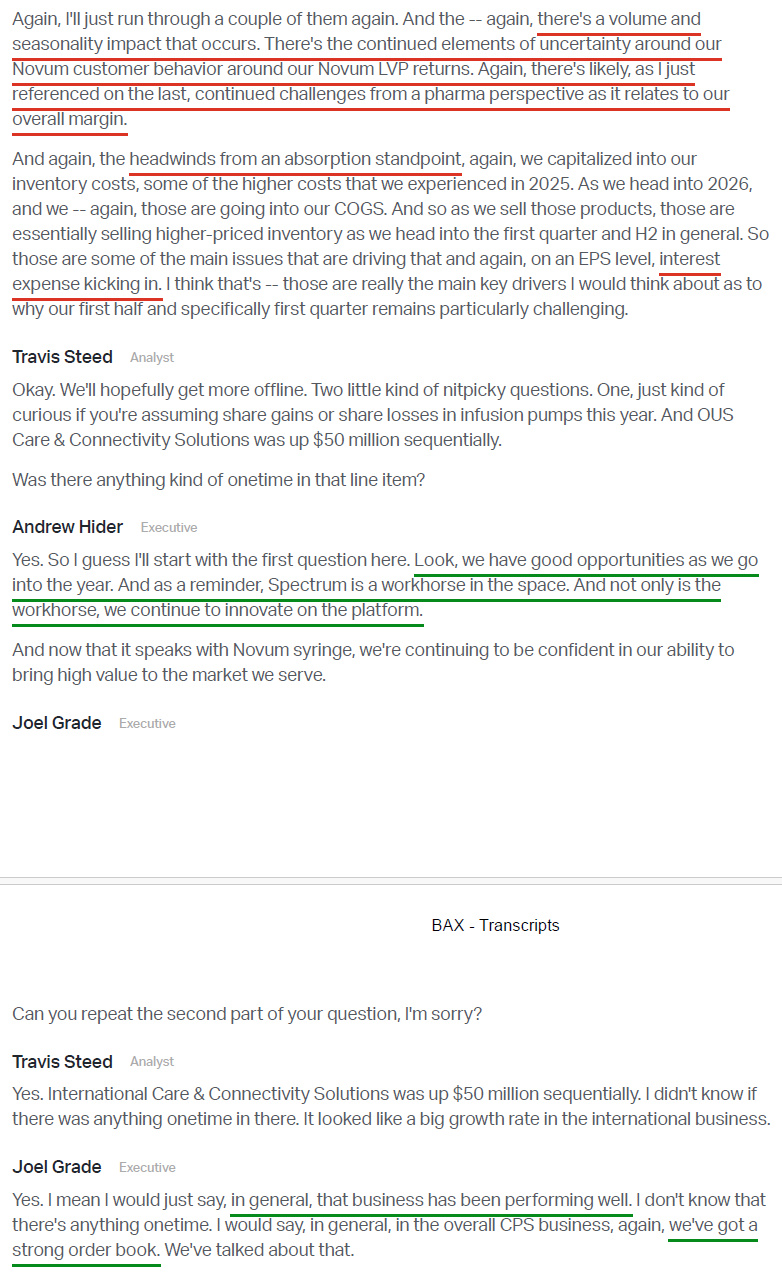
4) While the quarter’s top-line performance benefited from a more modest net impact from Novum IQ large volume pump customer returns, management now expects the ship and installation hold to remain in place through FY26. While disappointing, it is important to remember the product represents ~2% of total revenue, and the prior-generation Spectrum platform remains a strong alternative with solid demand. Management noted continued progress on the Novum solution and corrective actions but felt it was prudent, given uncertainty around customer responses and timing, to assume the ship and installation hold remains in place for the full year.
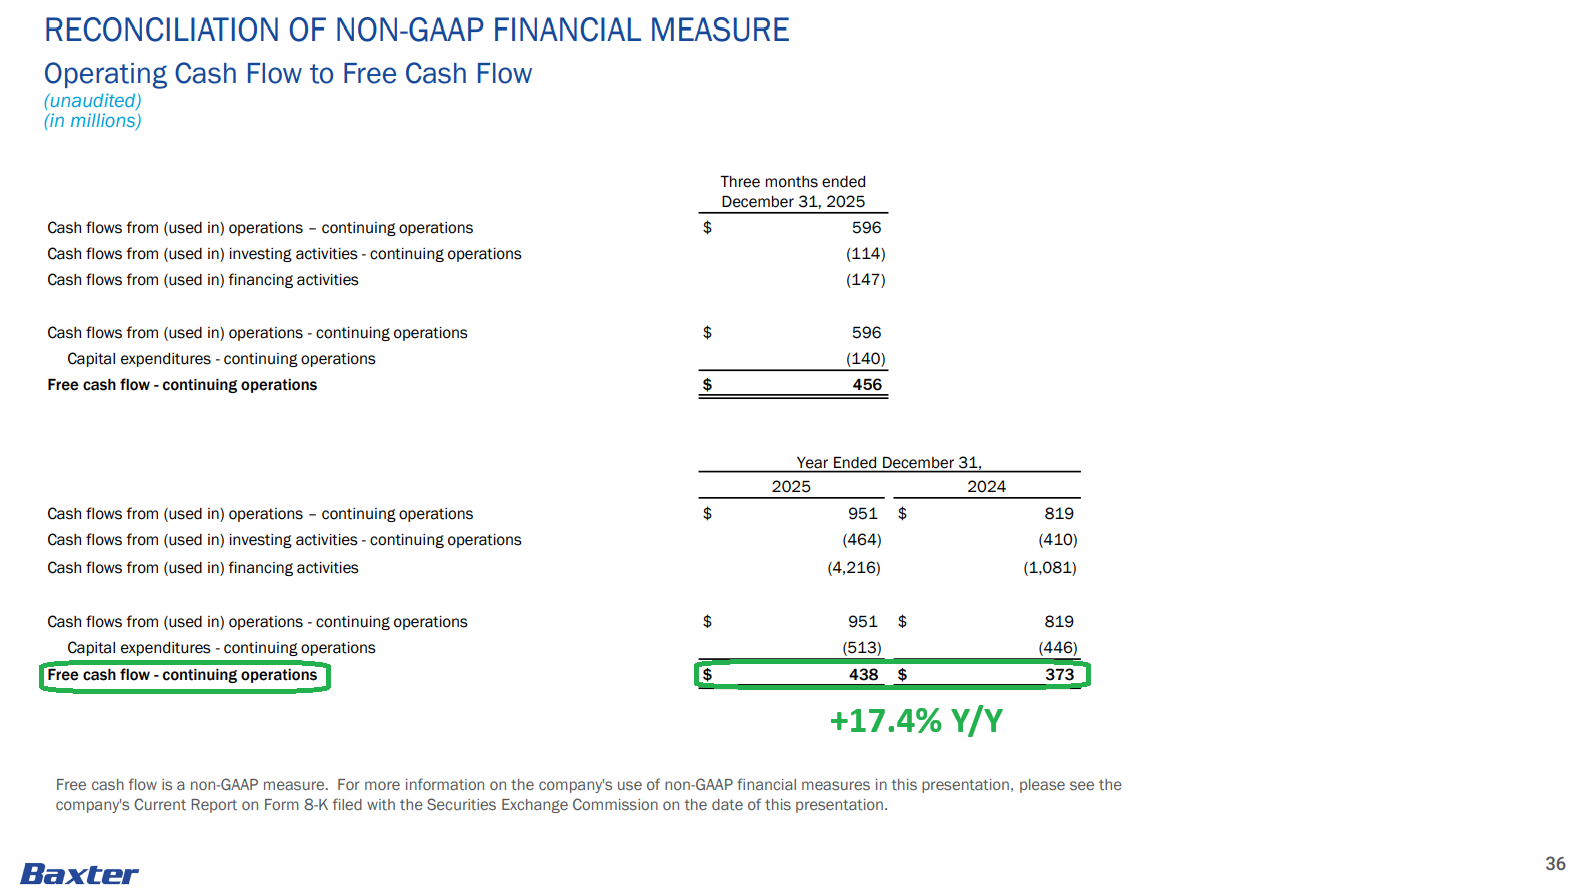
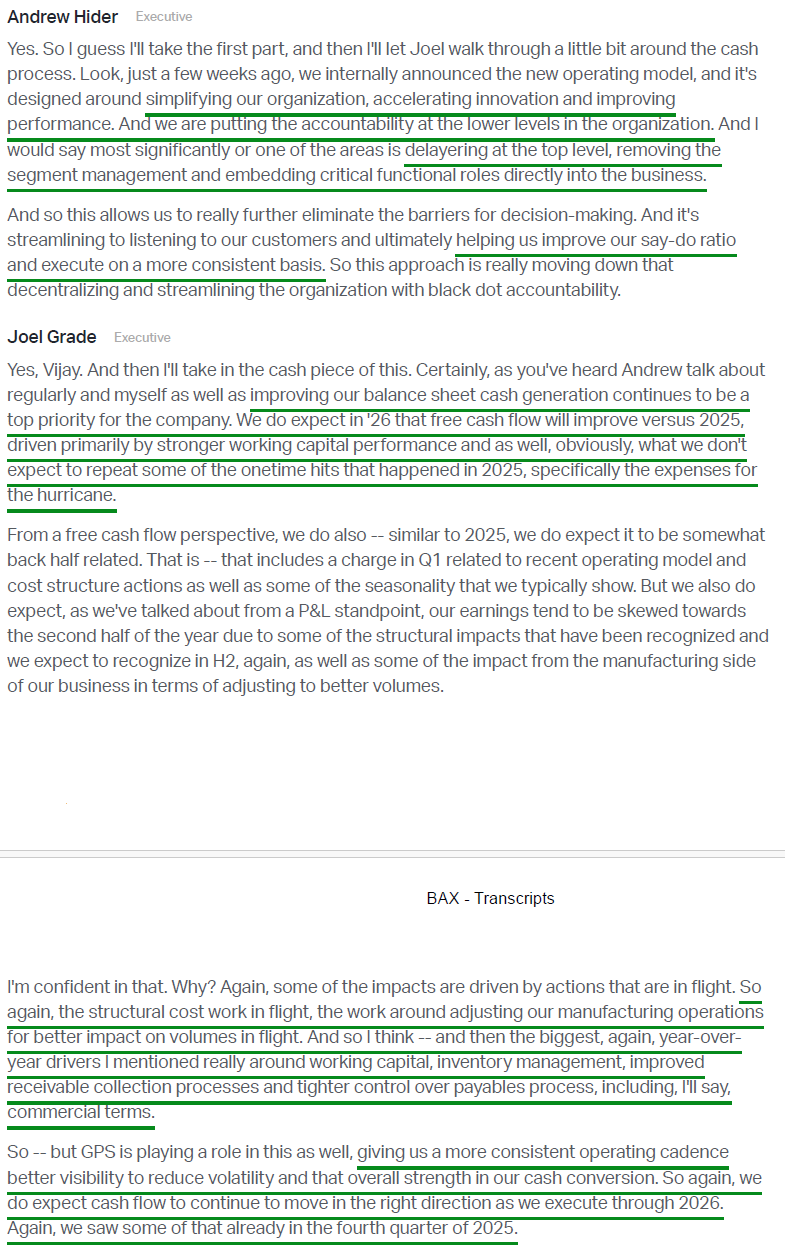
5) Free cash flow accelerated to $456M in Q4, bringing full-year FCF to $438M (+17.4% Y/Y). Management expects further improvement in FY26, driven by stronger working capital performance and the absence of certain one-time hurricane-related costs. Cash generation remains a top priority for BAX as it works back toward its historical ~80% conversion levels, providing the runway needed for near-term temporary headwinds to resolve.
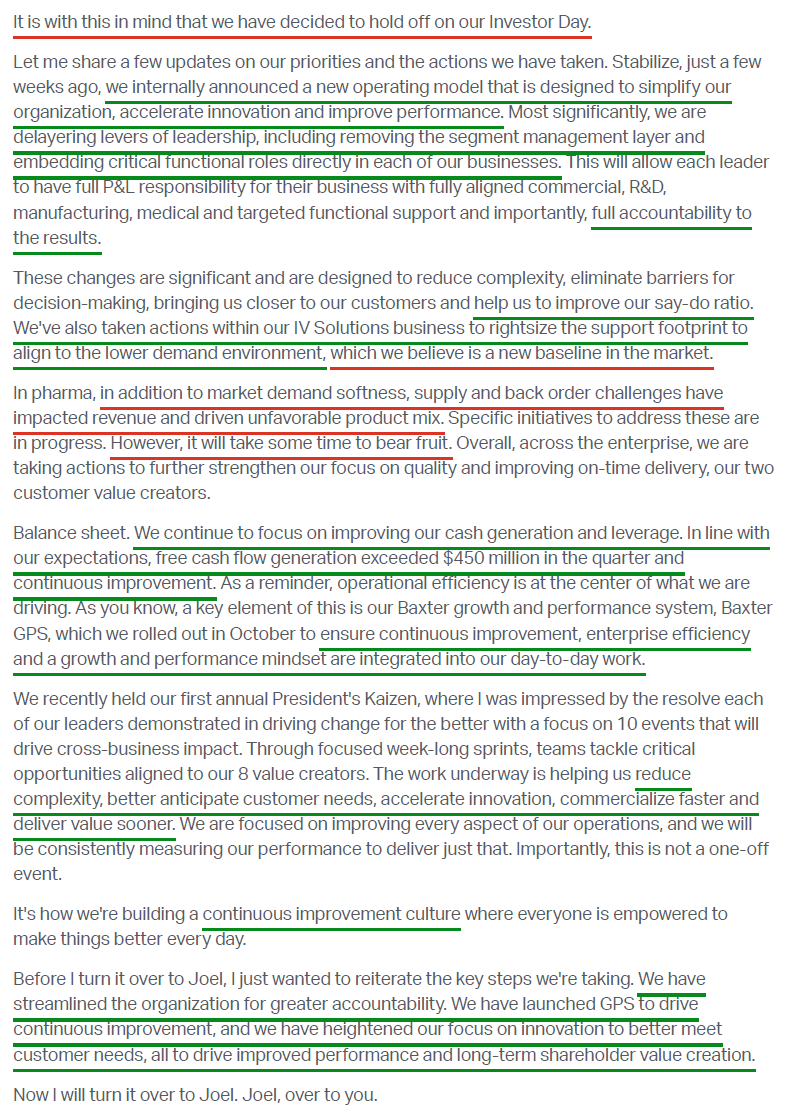
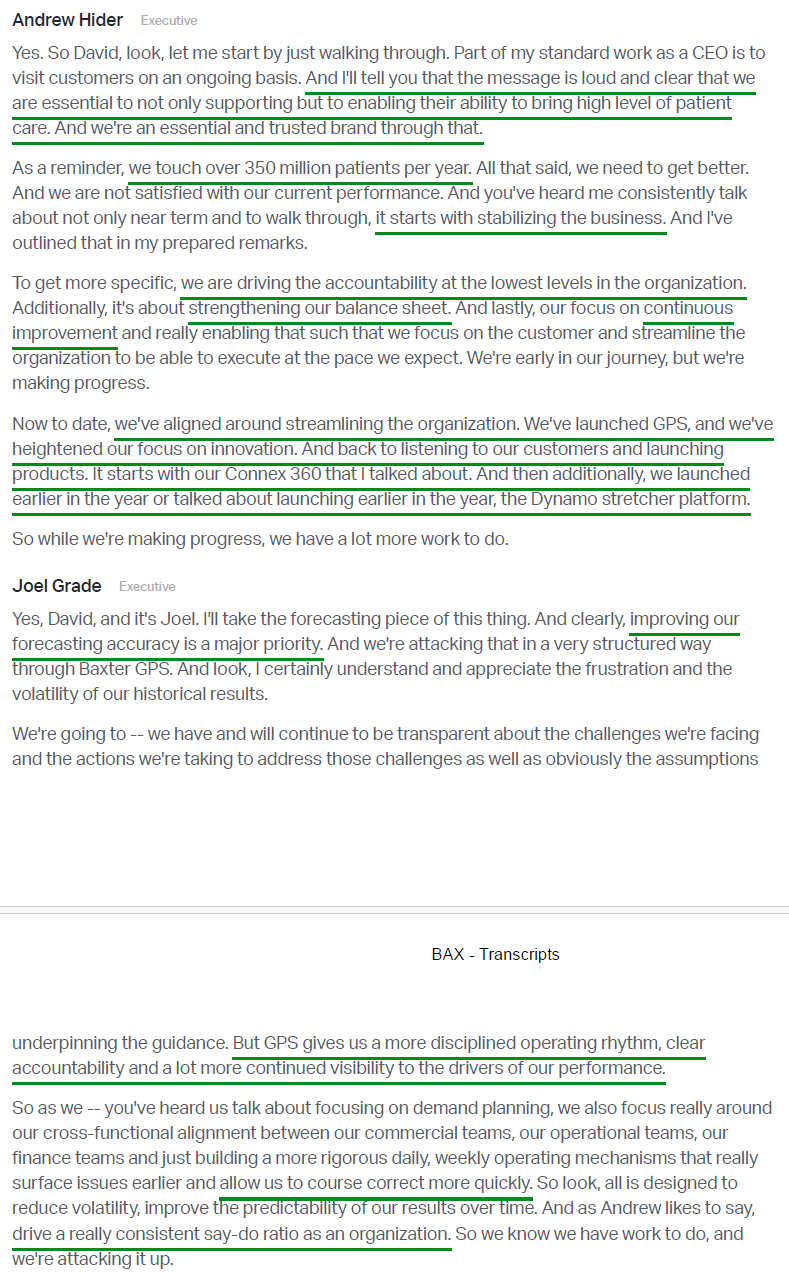
6) Baxter’s new operating model, the Growth and Performance System (GPS), has been rolled out and is designed to simplify the organization and improve the say-do ratio. The model removes layers of leadership and embeds critical functional roles directly within each business segment, giving segment leaders full P&L responsibility and accountability. The system is aimed at driving continuous improvement, taking a page from CEO Andrew Hider’s more than 10 years at Danaher.
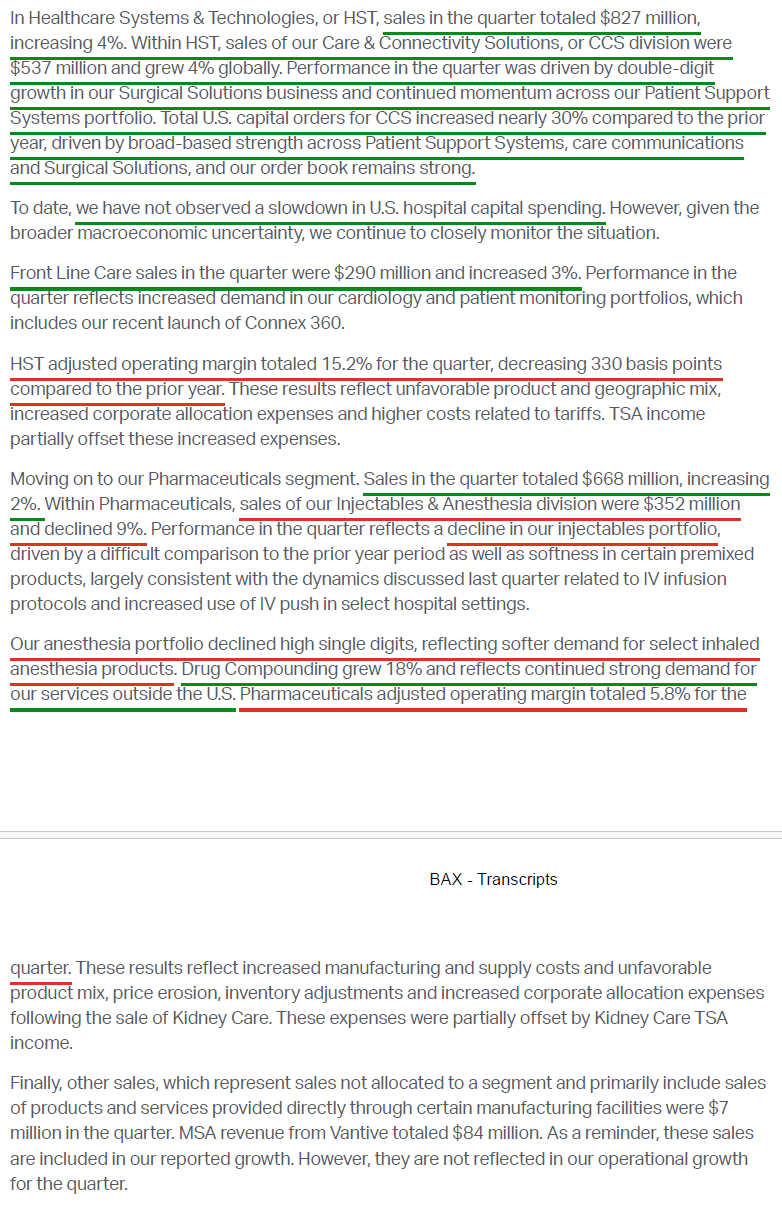
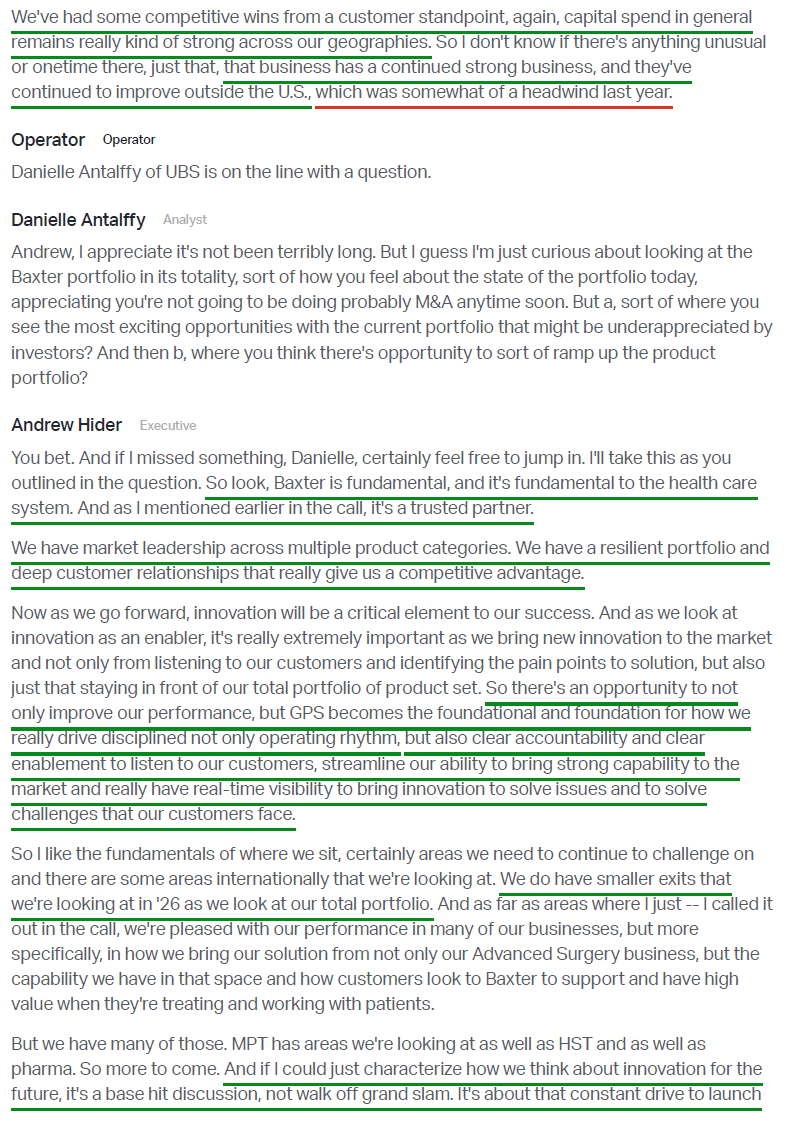
7) Despite concerns around a potential slowdown in U.S. hospital capital spending, management has not observed any signs of weakness. In fact, total U.S. capital orders for the Care and Connectivity Solutions segment increased nearly 30% Y/Y, driving +4% global growth in the segment. Management noted that the order book remains strong, with capital spending trends holding up across all geographies.
8) Management made it clear that accelerating innovation is a top priority, with plans to ramp R&D spending above historical levels of ~5% of sales. In Q4, R&D expense totaled $116M, or 3.9% of sales, below expectations due to certain cost reclassifications and not reflective of the anticipated run-rate level of R&D investment going forward.
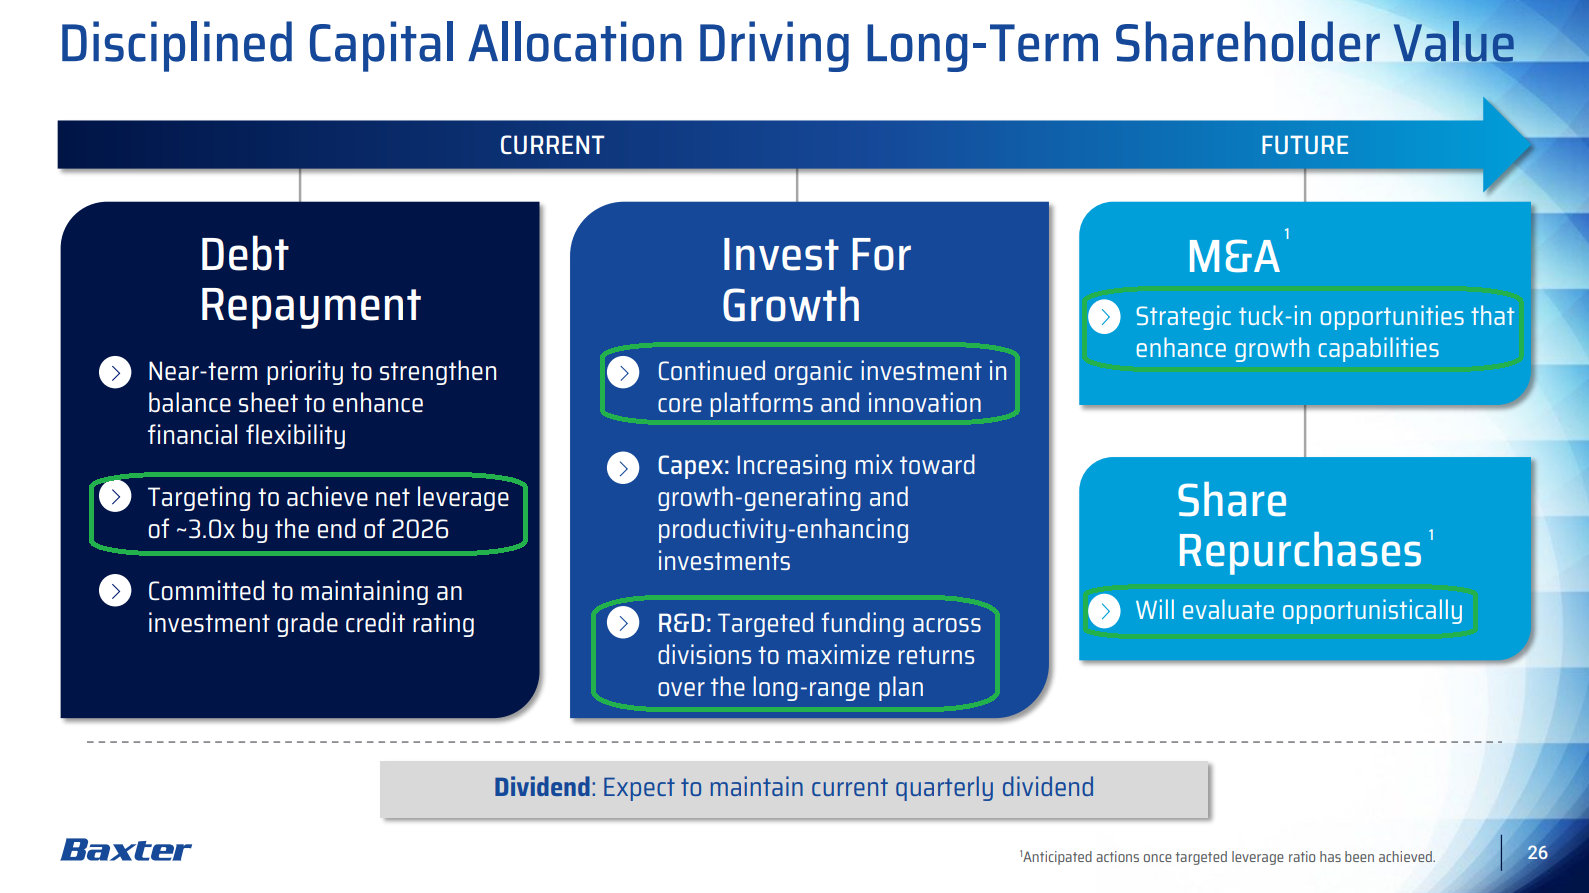
9) Deleveraging remains a top priority for BAX, with a target of reaching 3x net leverage by the end of 2026. At quarter end, BAX held $1.97B of cash and cash equivalents against $9.5B of long-term debt, with potential smaller divestitures and portfolio pruning in 2026 expected to support further deleveraging.
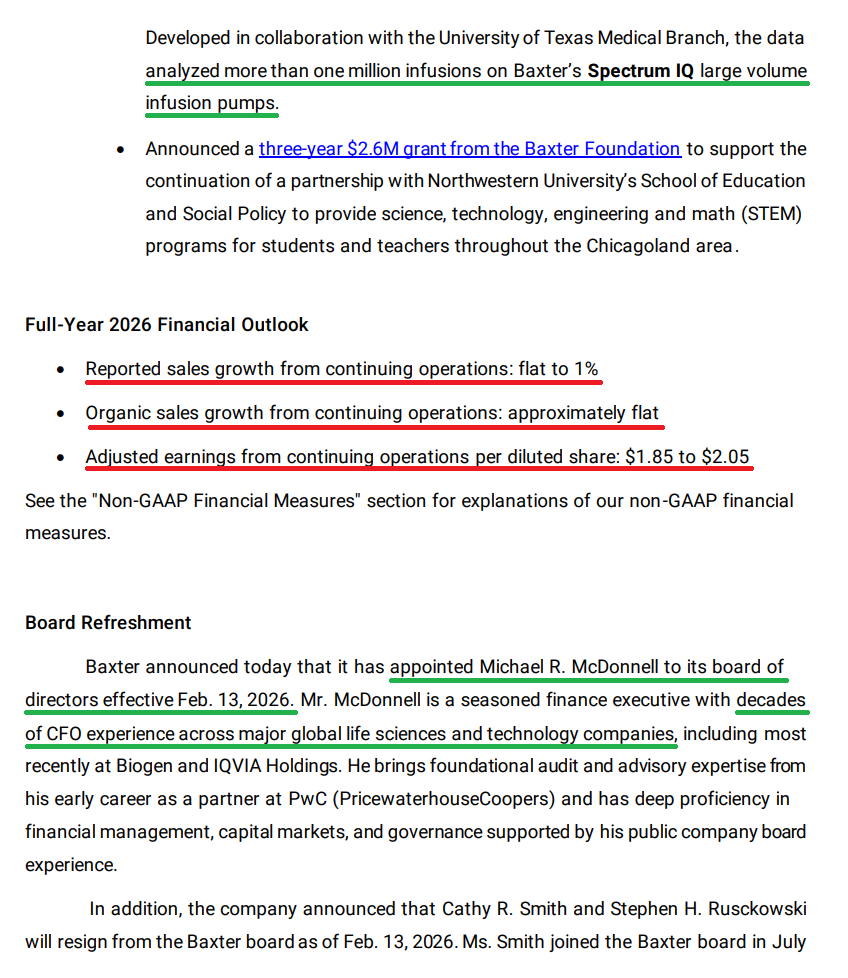
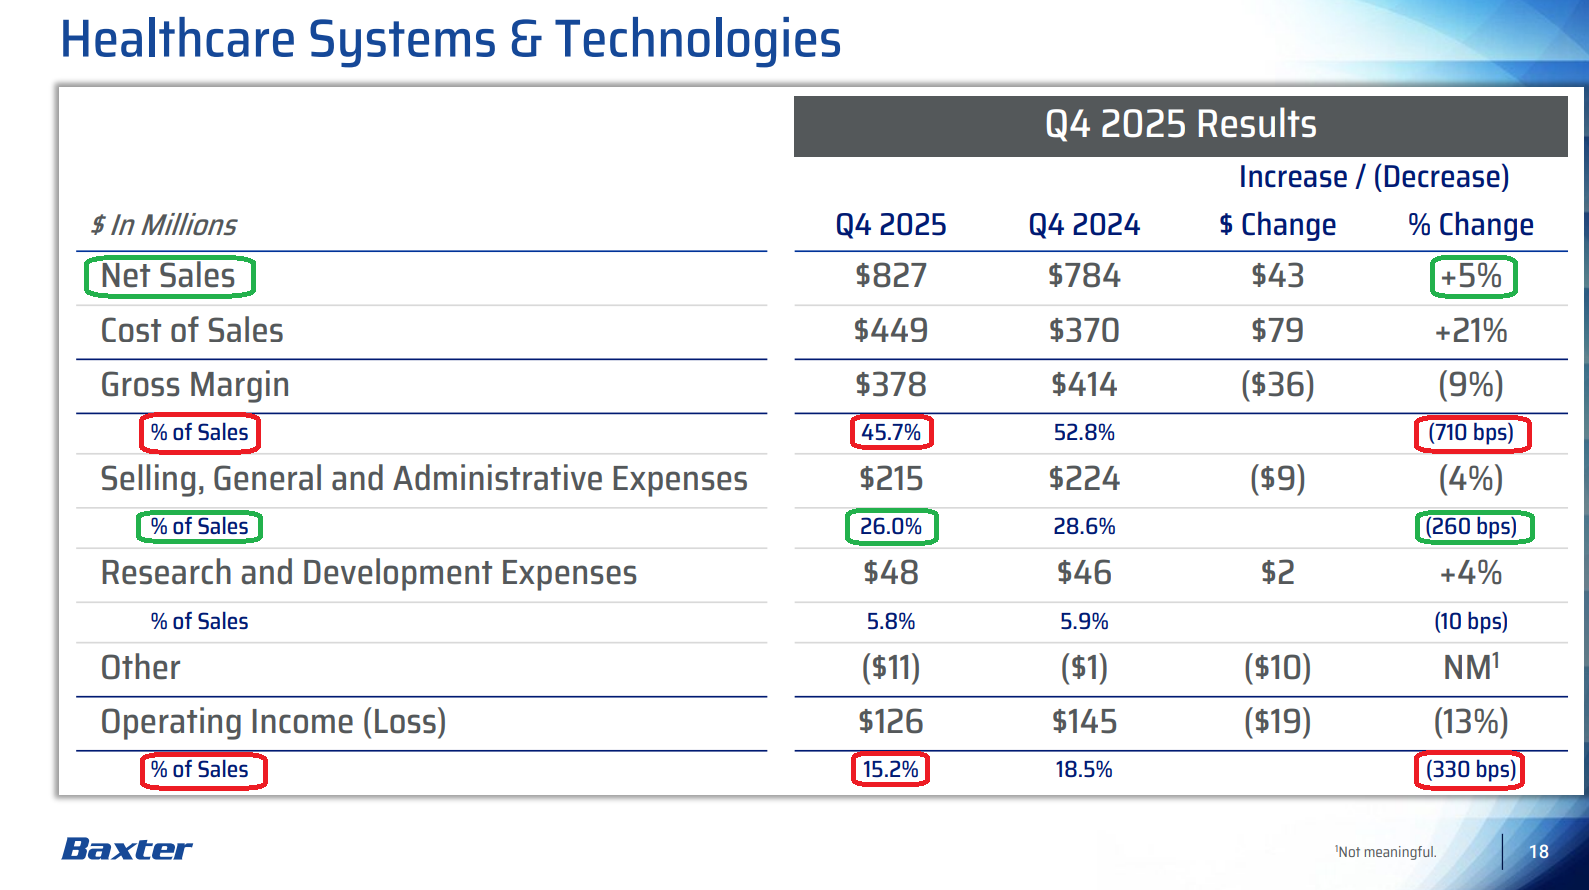
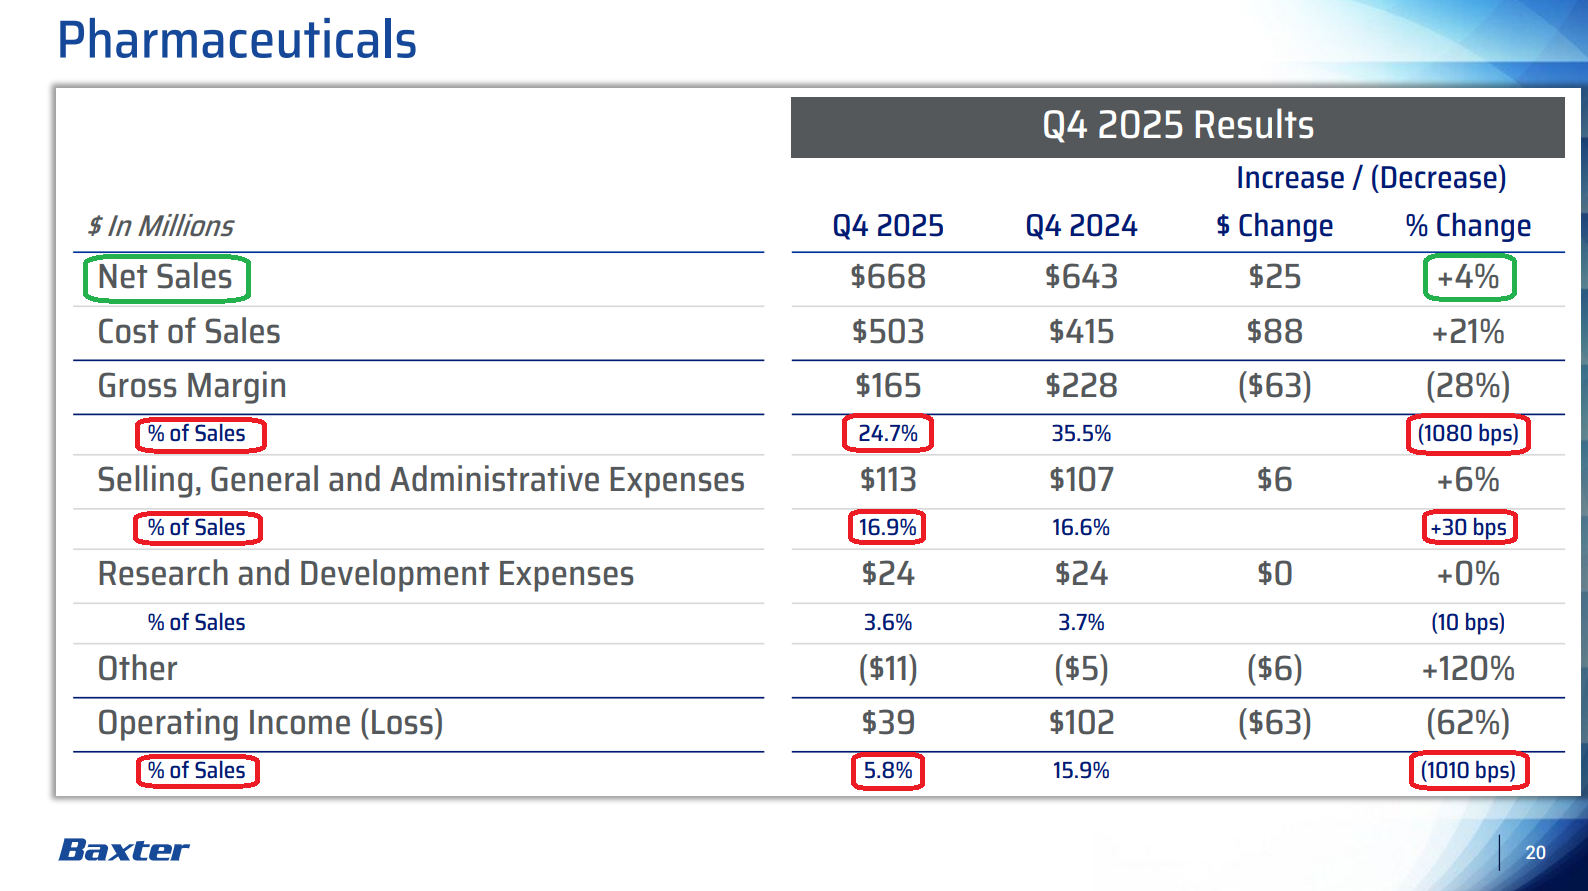
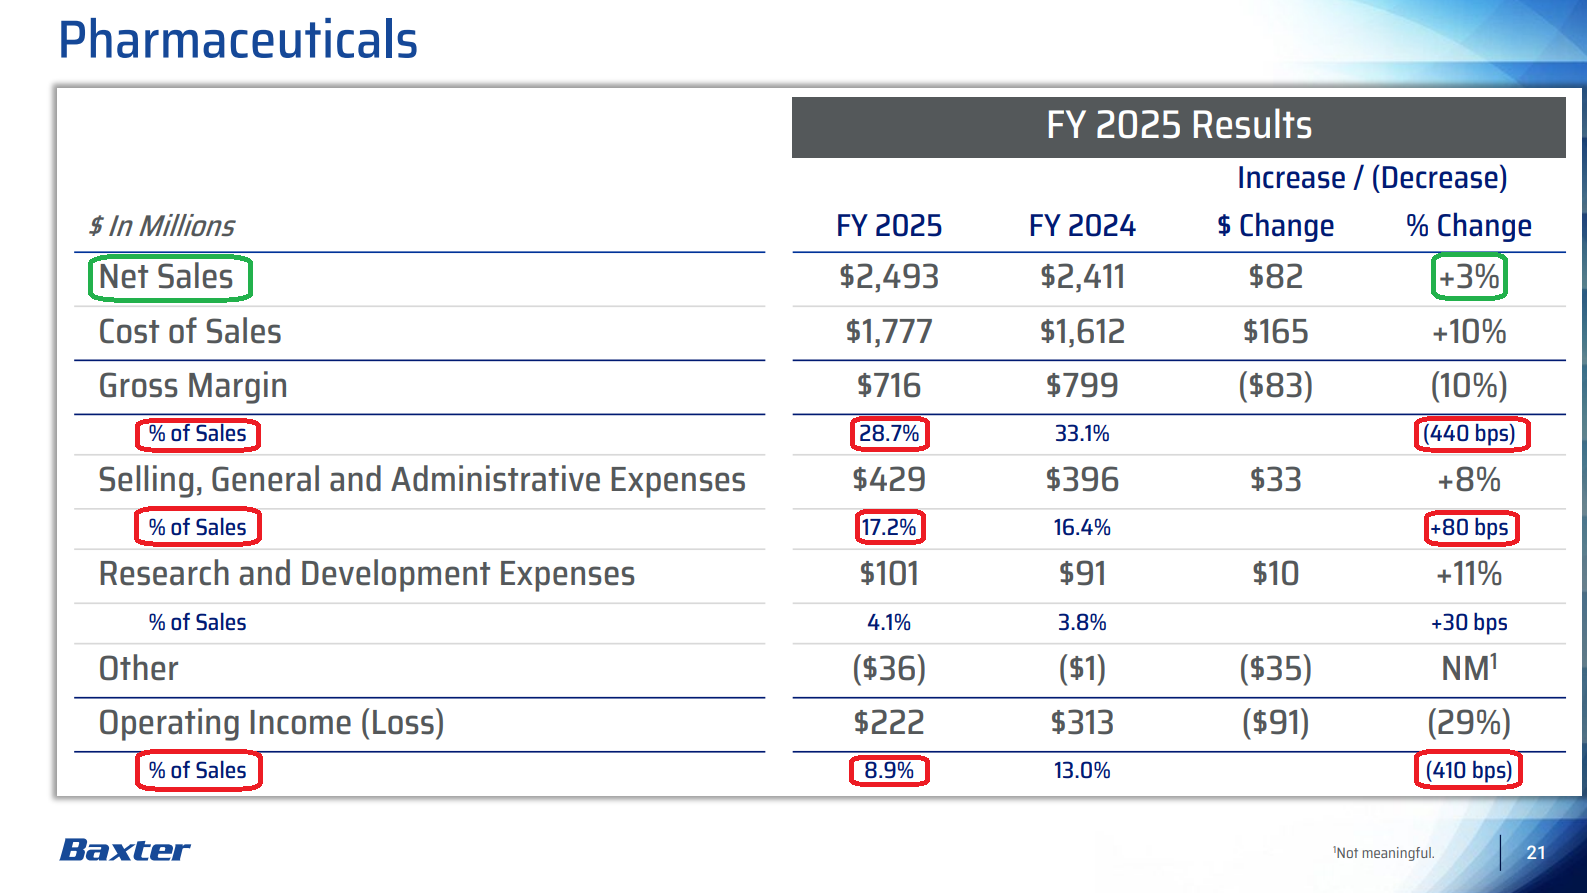
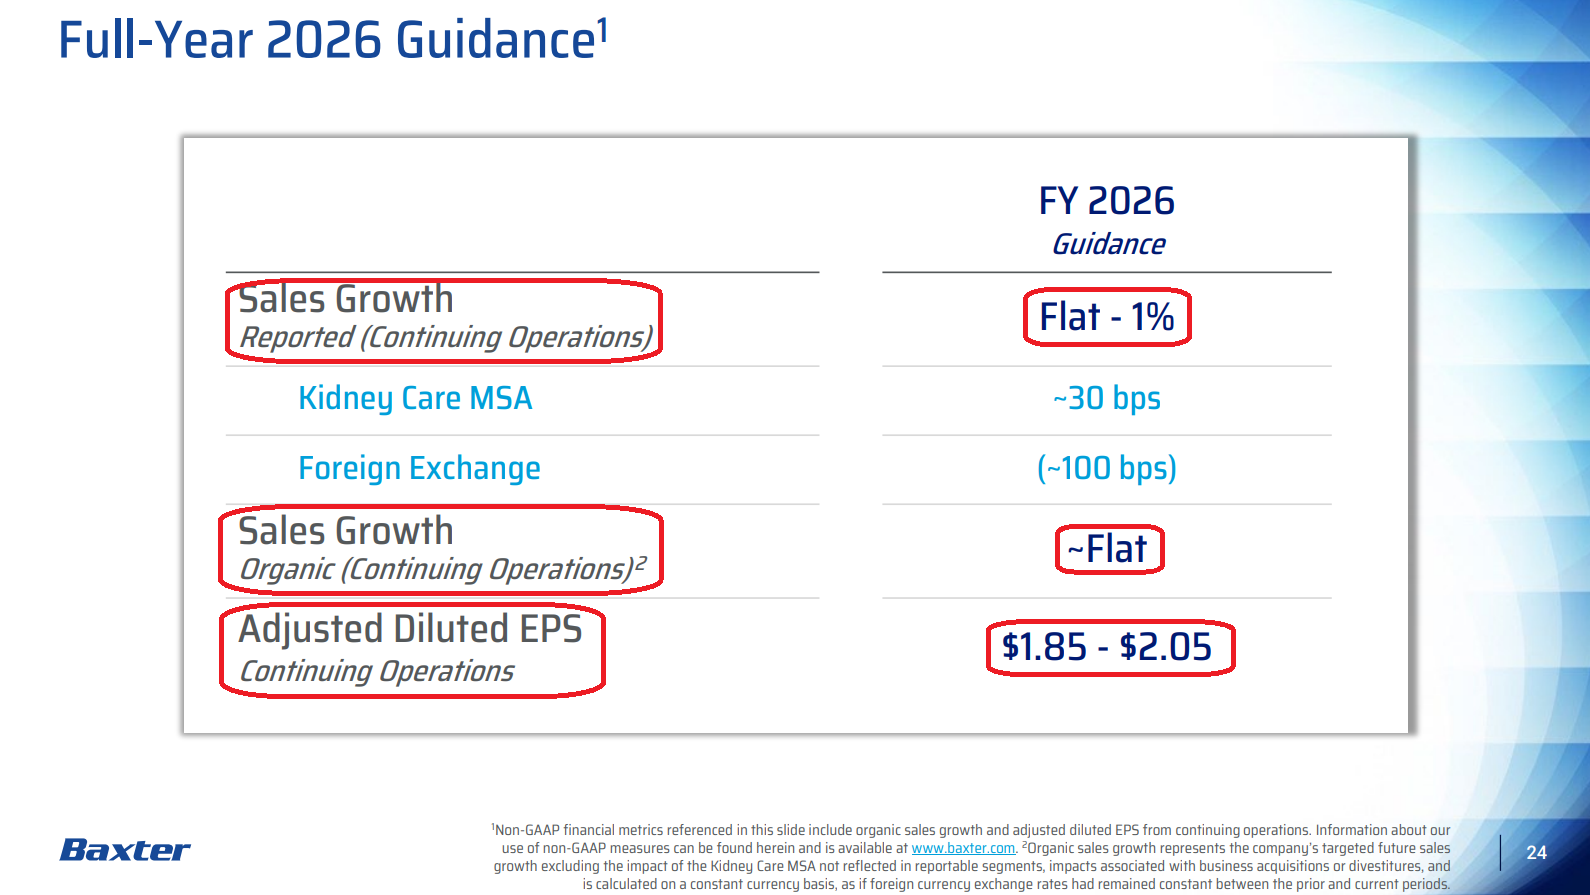
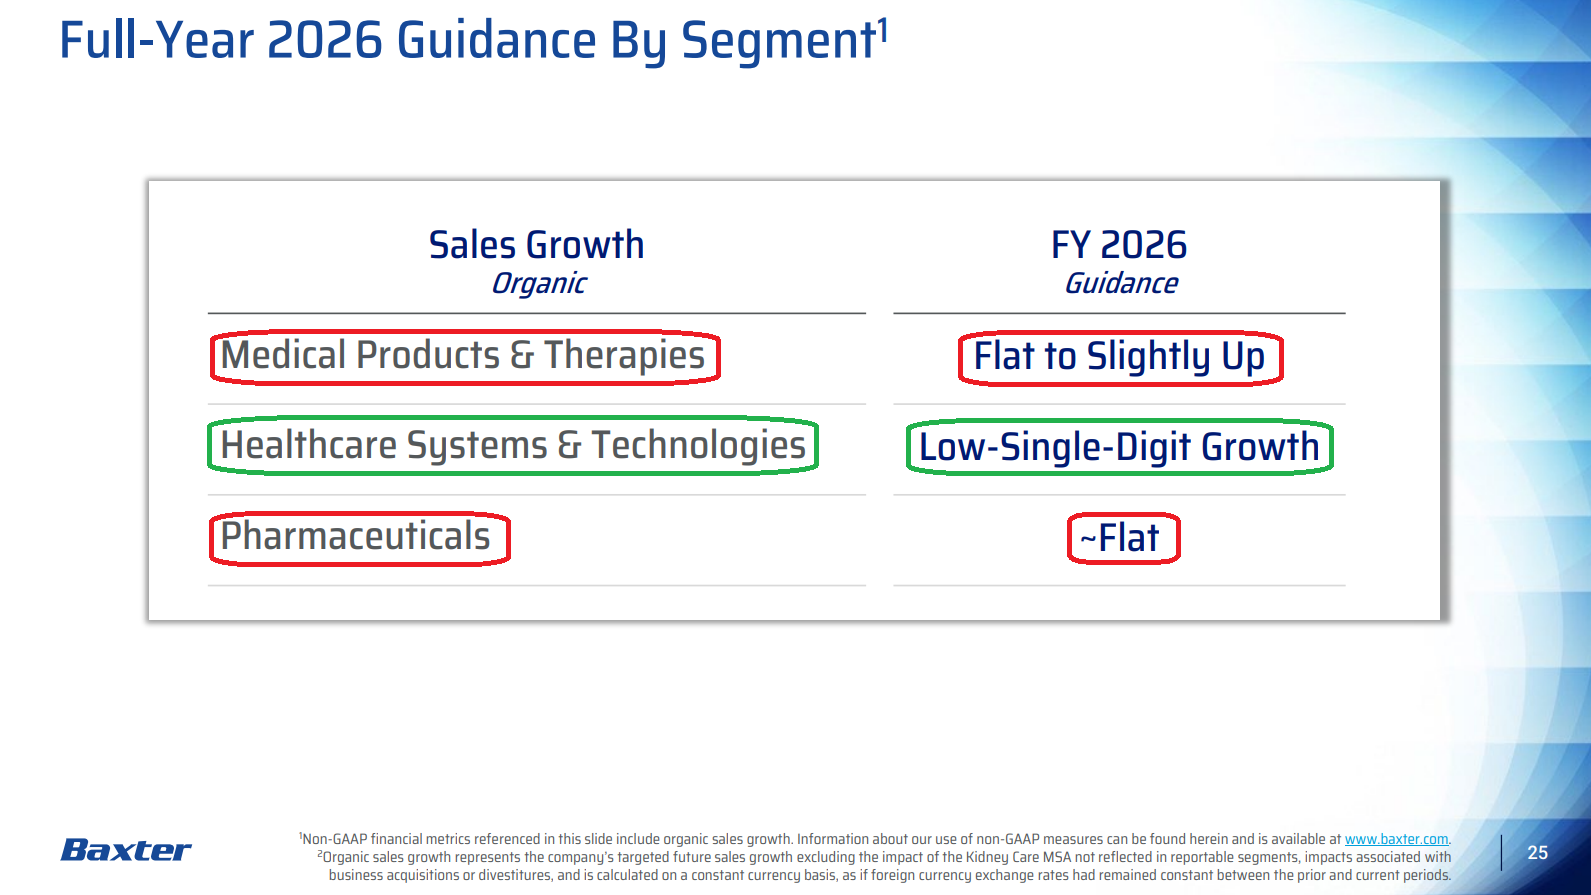
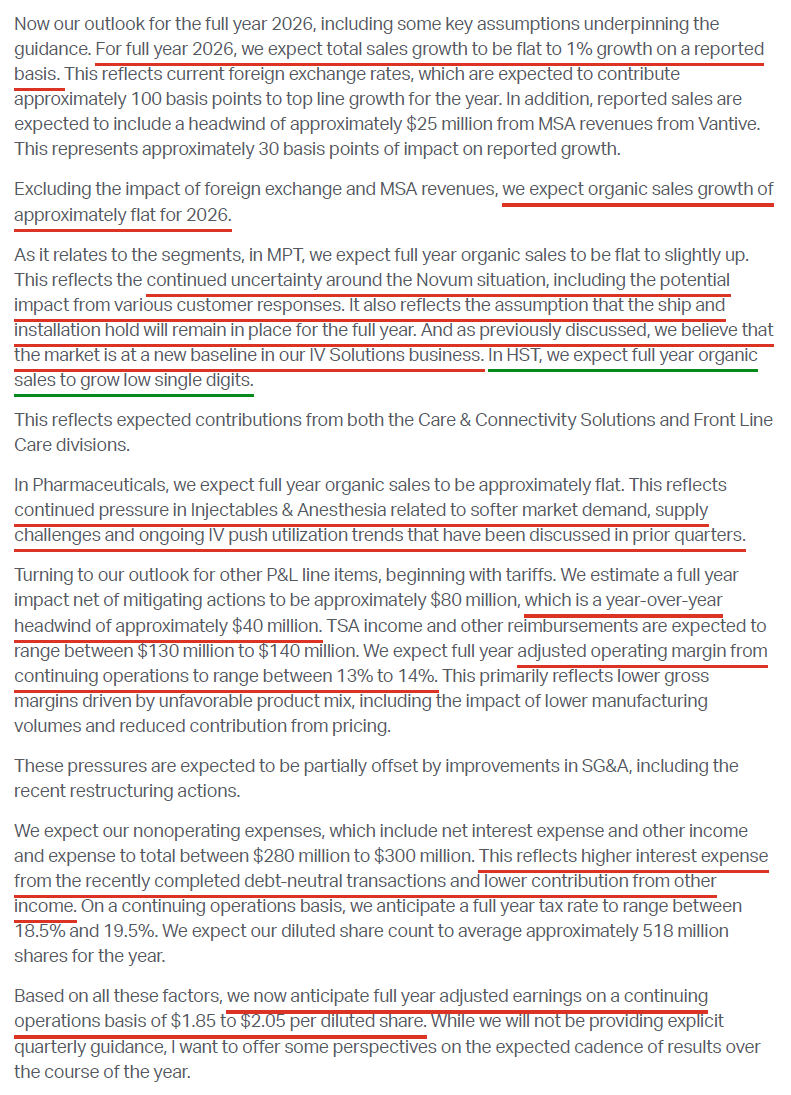
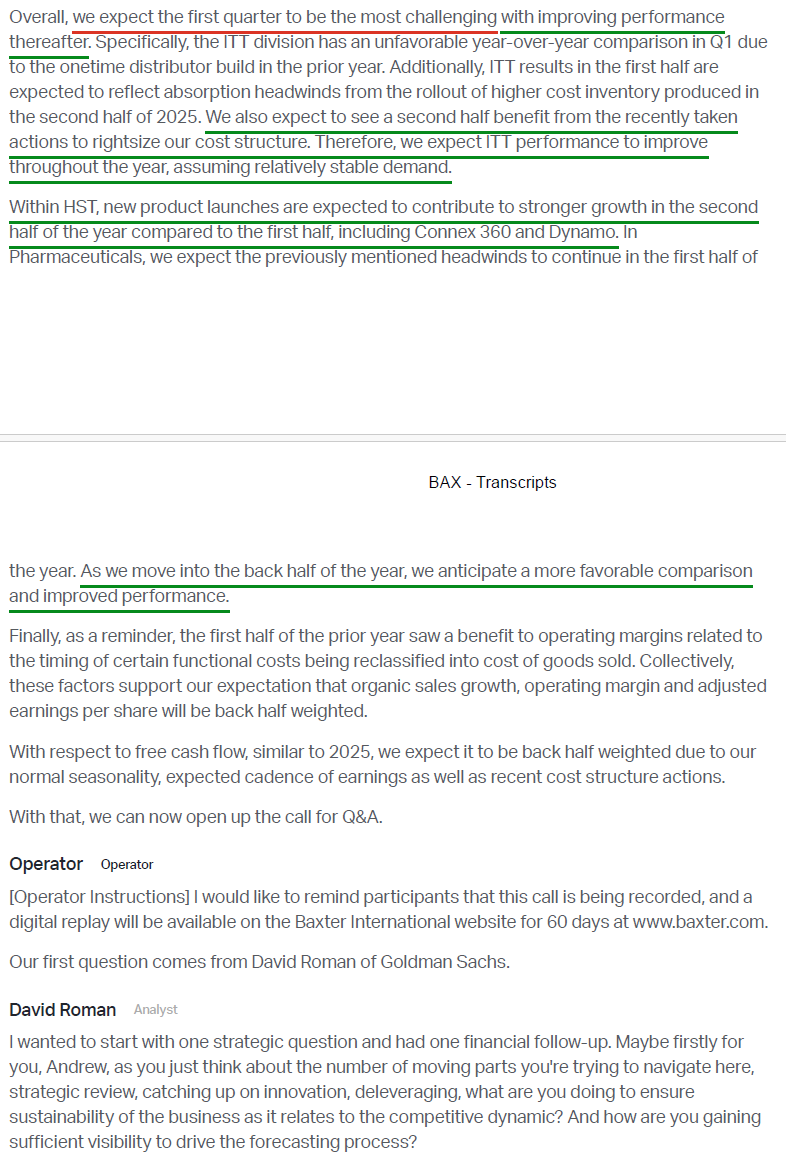
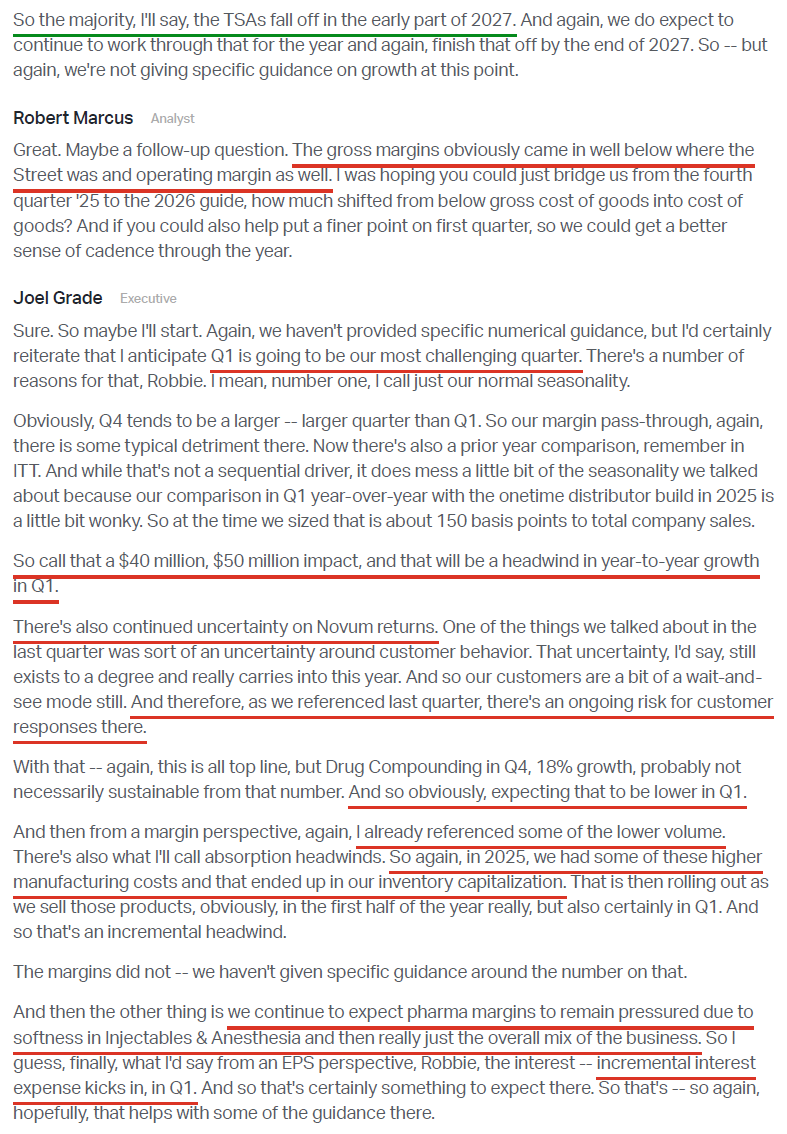
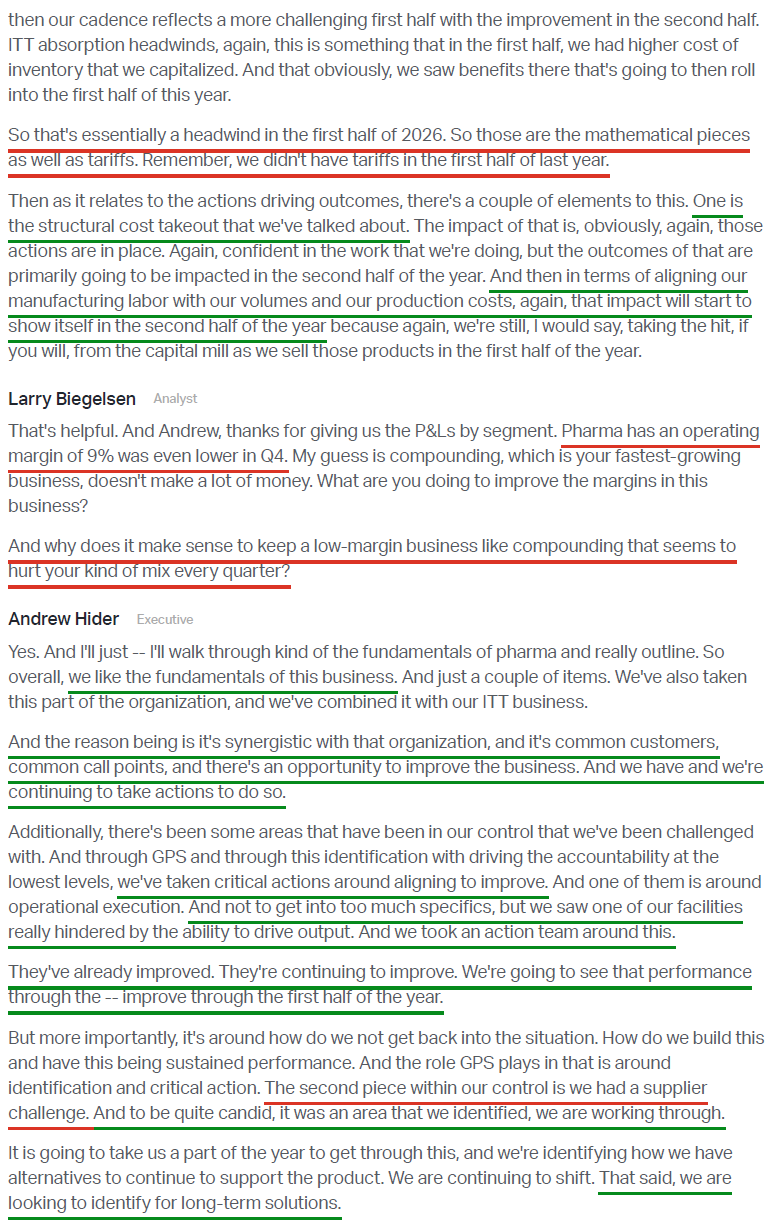
10) Management expects FY26 reported sales growth of flat to +1%, with organic sales also flat (below consensus +1.94%). By segment, Medical Products & Therapies is expected to be flat to slightly up, Healthcare Systems & Technologies to deliver low single-digit growth, and Pharmaceuticals to remain flat. Adjusted EPS is guided to $1.85 to $2.05 (below consensus of $2.24), with Q1 expected to be the most challenging before improving throughout the year as the bottom line begins to benefit from recently implemented cost-rightsizing actions. Importantly, this guidance assumes a worst-case scenario in which the Novum ship and installation hold remains in place for the full year and IV Solutions weakness persists, potentially setting the bar for upside if these near-term headwinds resolve earlier than currently embedded in expectations.
Earnings Call Highlights
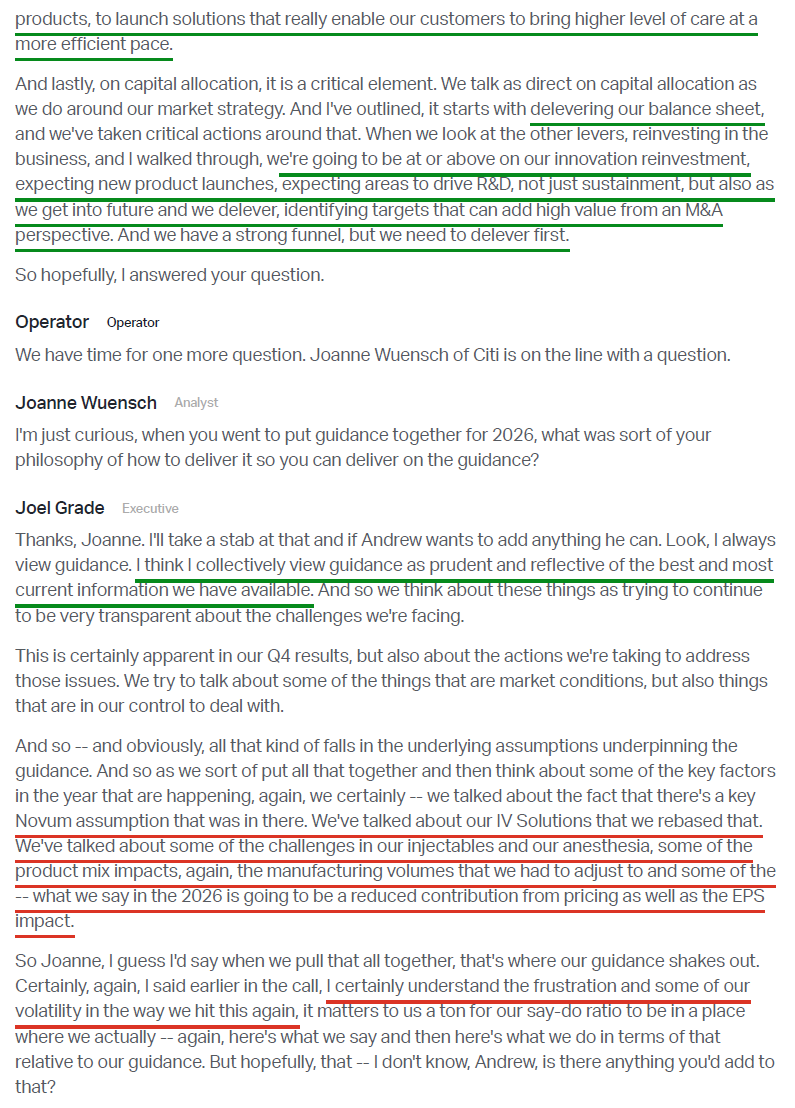
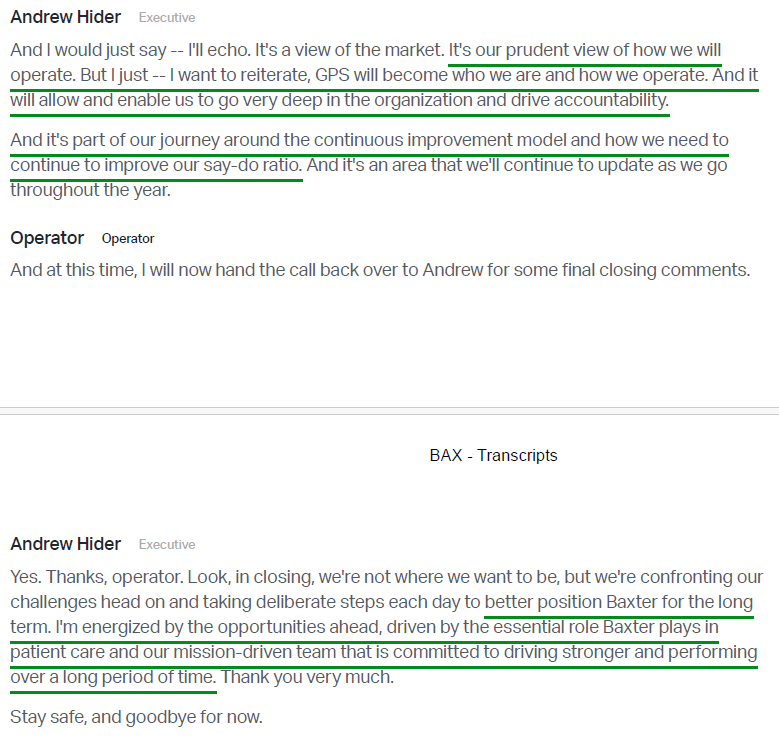
Morningstar Analyst Note
General Market
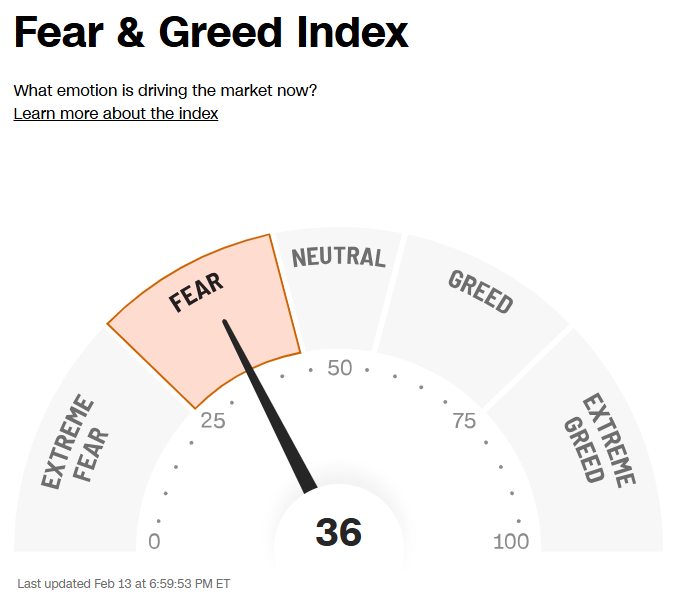
The CNN “Fear and Greed Index” ticked down to 36 this week from 48 last week. You can learn how this indicator is calculated and how it works here: (Video Explanation)
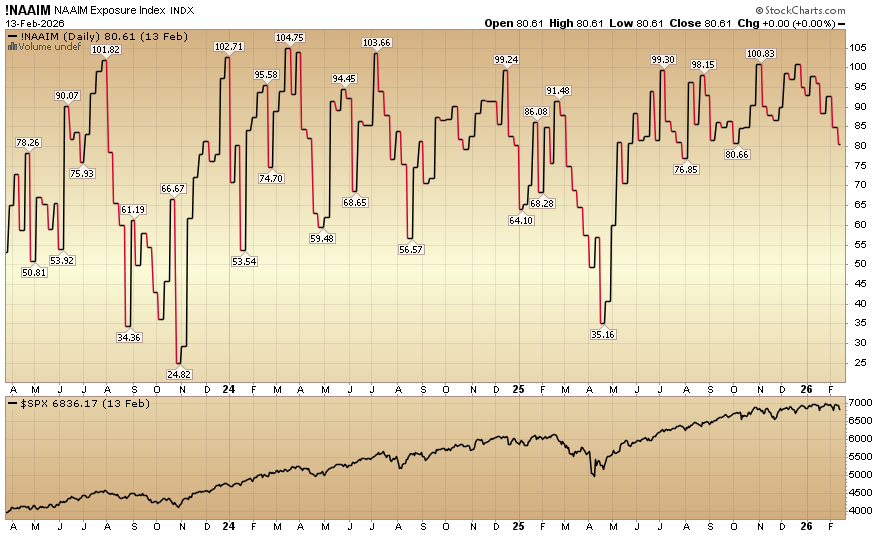
The NAAIM (National Association of Active Investment Managers Index) (Video Explanation) fell to 80.61% equity exposure this week from last week’s 84.93%.
Our podcast|videocast will be out sometime today. We have a lot of great data to cover this week. Each week, we have a segment called “Ask Me Anything (AMA)” where we answer questions sent in by our audience. If you have a question for this week’s episode, please send it in at the contact form here.
Larger accounts $5-10M+ can access bespoke service anytime here.
Not a solicitation.


