
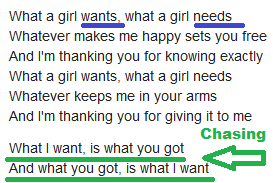
Okay, okay I know I’m going to get some pushback for choosing Christina Aguilera’s hit song for the article of the week, but hear me out…
If you recall from our podcast|videocast, last December AFTER the energy sector was up was up 376% off the covid lows ALL of the commentators who HATED energy in 2020 couldn’t get enough December of 2022 – because TECH was “dead.” The energy sector has made ~ZERO progress since. In the first few months of this year when it failed to perform – the same commentators couldn’t sell out fast enough. As we approach Dec 2022 levels once again, they’re back tripping over themselves to chase up.
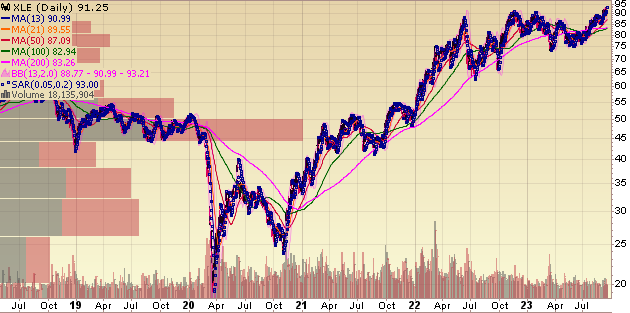
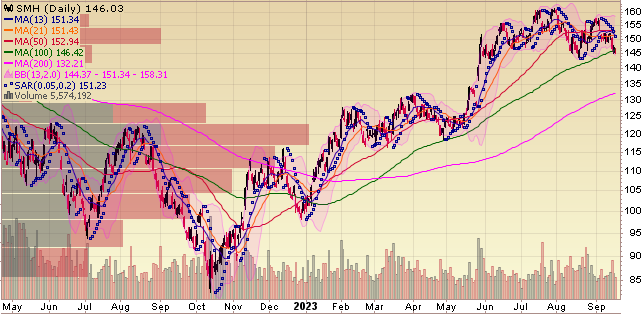
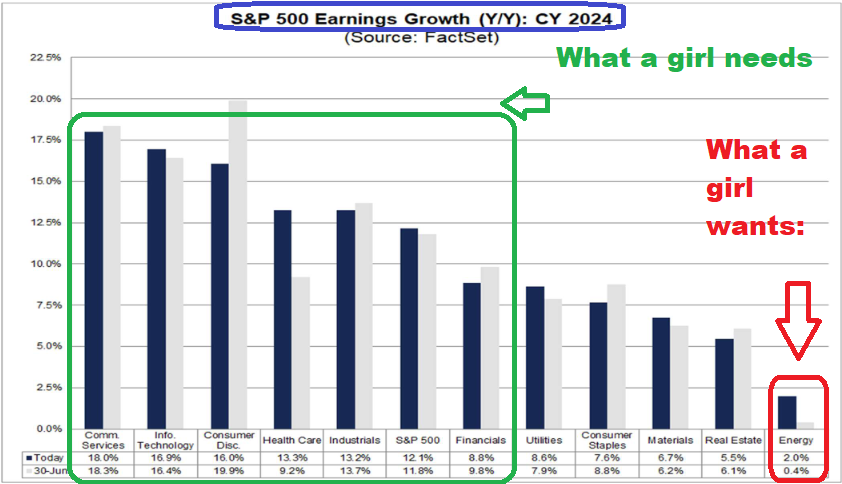
One of the reasons we suggested taking a pass on energy at the highs last December was that the sectors that everyone hated were poised to have the highest earnings growth in 2023 (Tech, Semi’s, Etc), while the sectors that everyone loved (Energy, Utilities, Staples) were set to have the worst. People bought what was up in PRICE, with no regard for what they were getting in VALUE (fundamentals).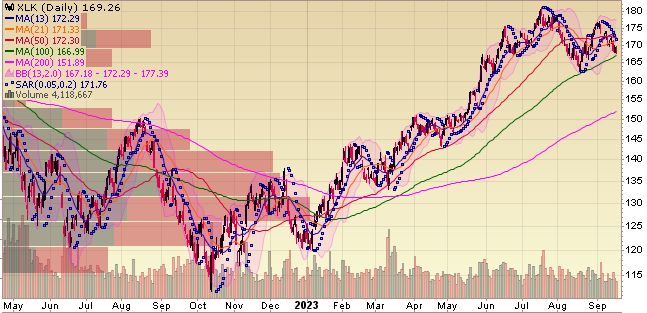
Christina Aguilera had it right when she said this:
“In the United States, the song spent 24 weeks on the US Billboard Hot 100 during which time it topped the chart, becoming her second consecutive US number one single after topping the chart on the issue date of January 15, 2000, for two consecutive weeks, becoming the first new number-one entry of the 2000s on the Hot 100.” Wikipedia
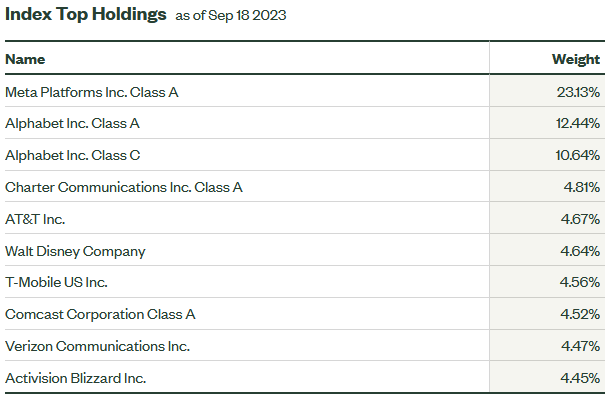
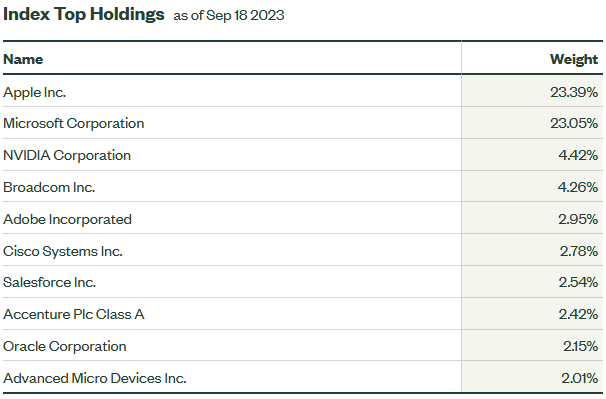
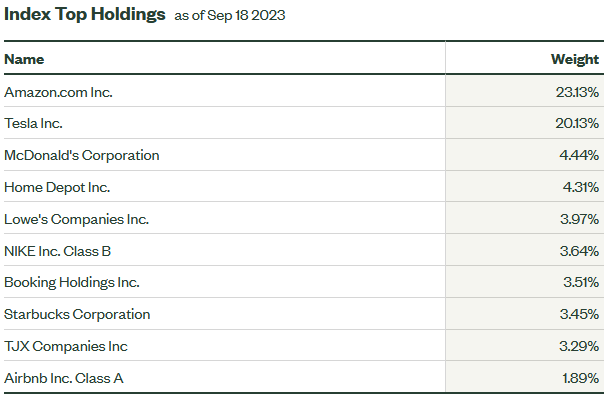
So while we believe in the intermediate term secular story in Oil, we made our play from 2020-2022. The top holdings of the five sectors that will have faster earnings growth than the S&P 500 in 2024 are:
Communication Services
Info Tech
Consumer Discretionary
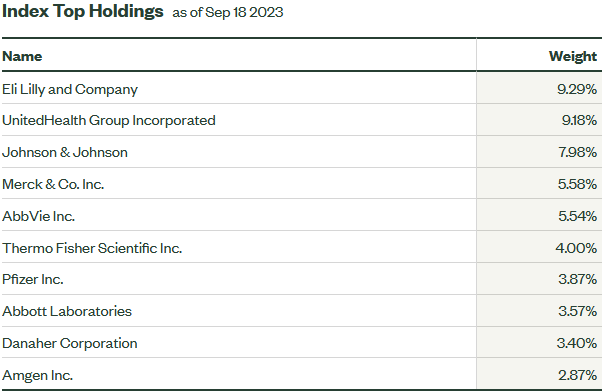
Healthcare
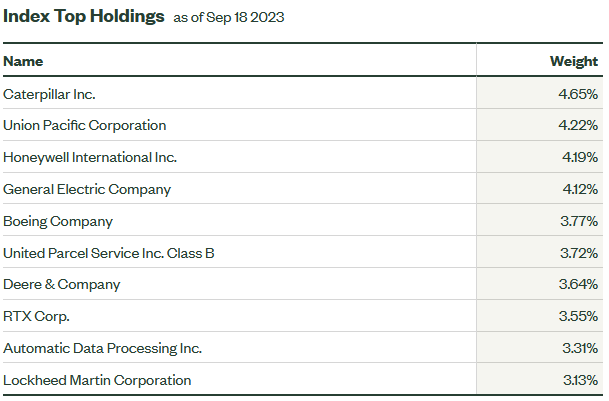
Industrials
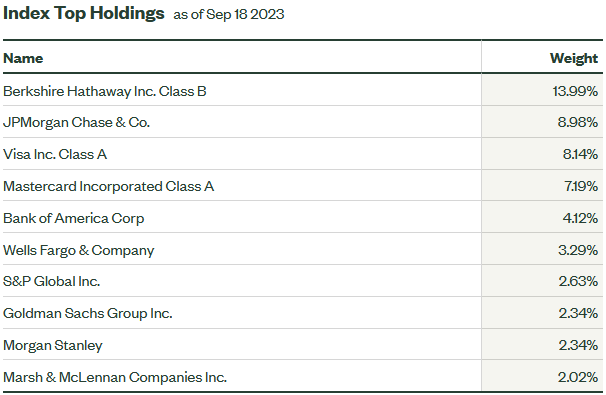
And Financials (because we like them):
The key is finding the companies in these groups that are the most undervalued relative to peers – with growth prospects ahead and taking advantage of the recovery. If you’re a regular listener of our podcast|videocast you know a number of the stocks we own along with our clients.
So while everyone else chases energy UP “buy the breakout”, you can take solace in skating to where the puck is going, versus chasing after the bulk of the move has occurred.
On Thursday evening, I joined Phil Yin on CGTN America to discuss stock market outlook, US consumer, China, Banks, Earnings, Inflation, the Fed and more. Thanks to Phil and Ryan Gallagher for having me on. You can view it here 👇
I also joined Syarifah Rahma on CNBC “Closing Bell” Indonesia to discuss Central Banks’ policy, inflation and Outlook for US and Emerging Markets and what I would do if I were “king for a day!” Thanks to Fitria Anggrayni and Syarifah Rahma for having me on:
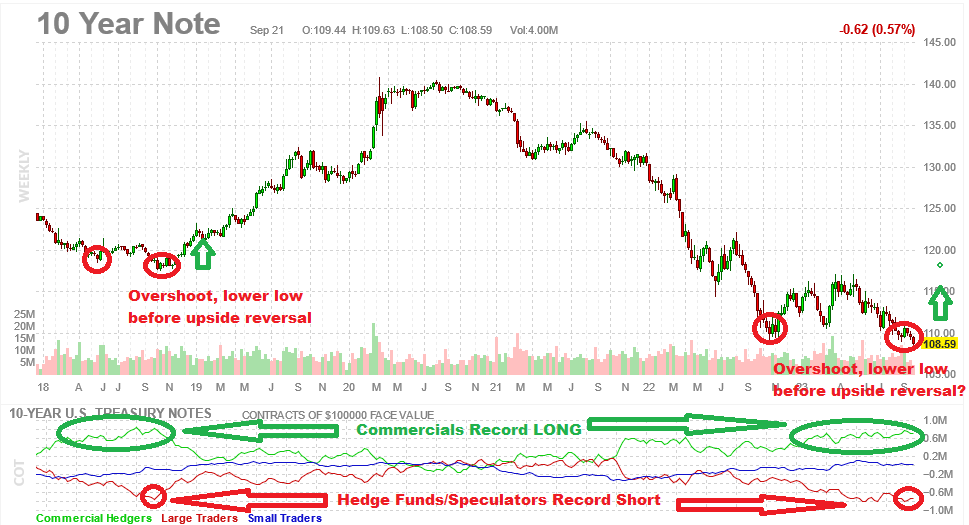
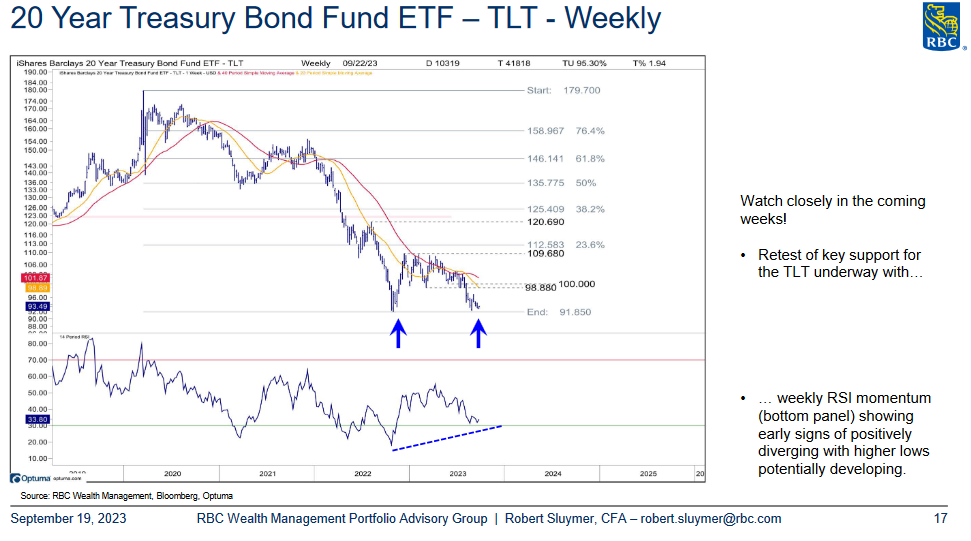
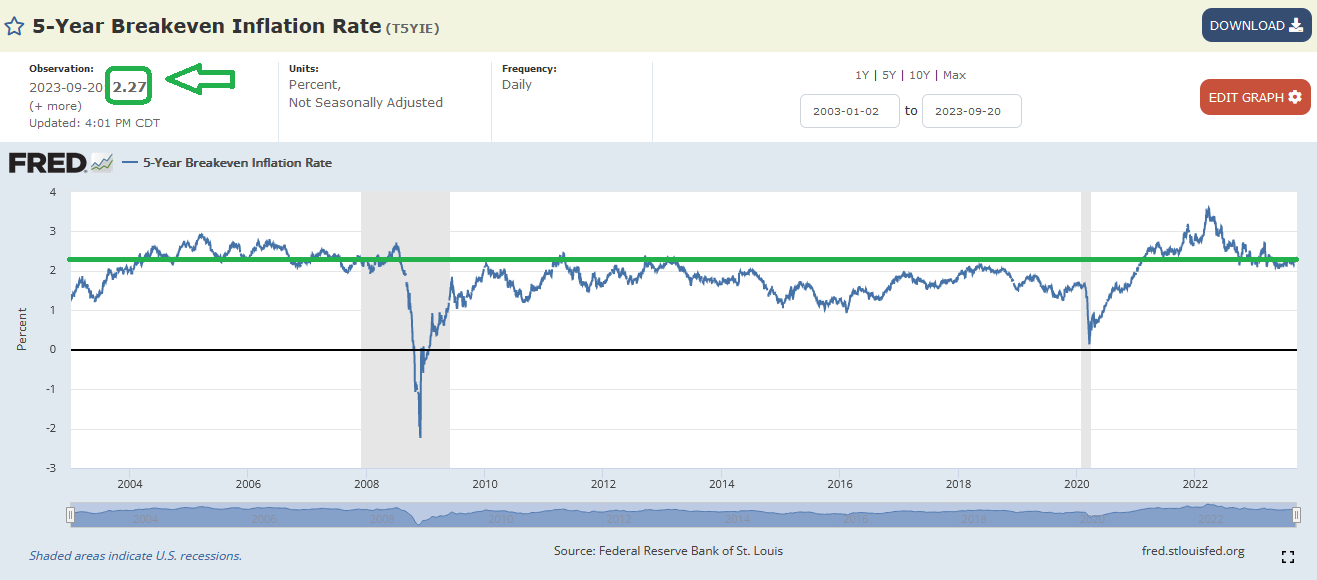
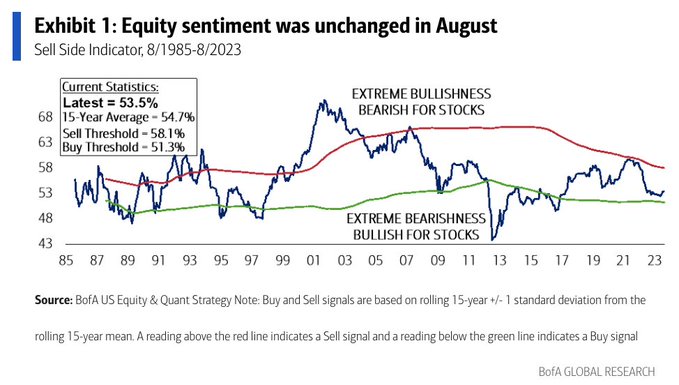
As it relates to this outlook, these are the two most important charts to watch in coming weeks:
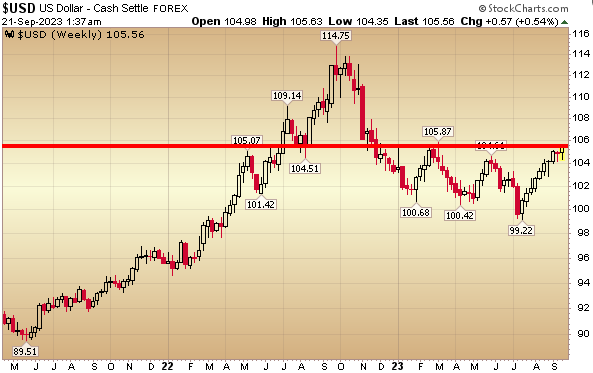
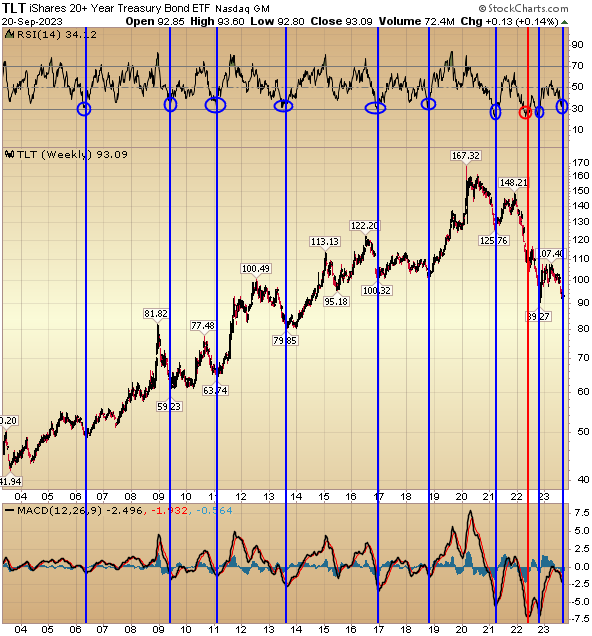
If past is any prologue, we could see an “overshoot” before a reversal like in 2018:
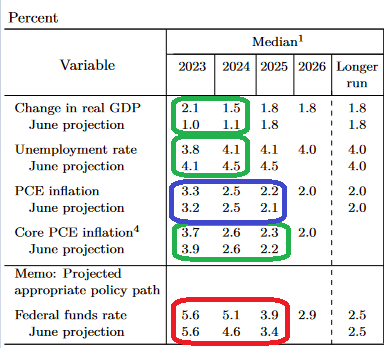
 Fed Economic Projections:
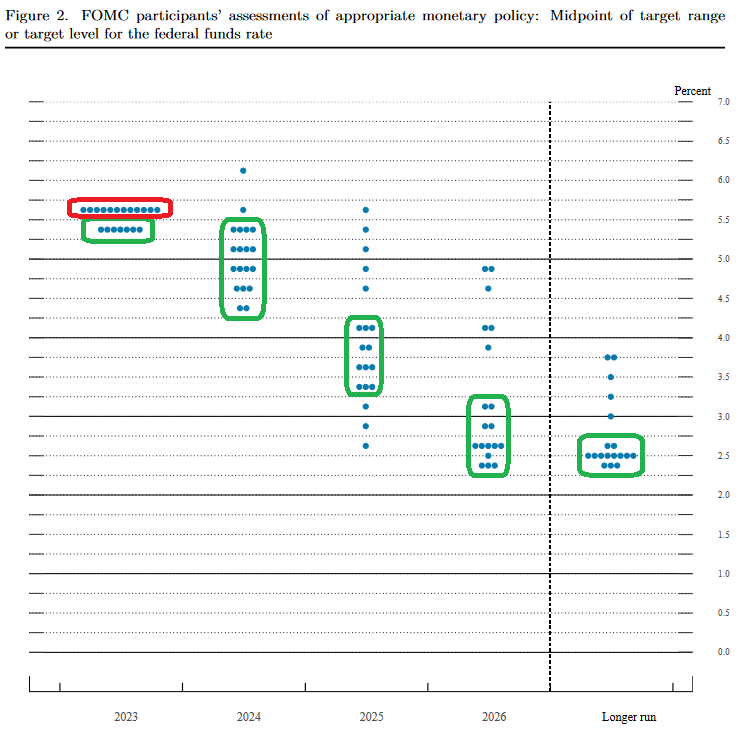
Dot Plot:
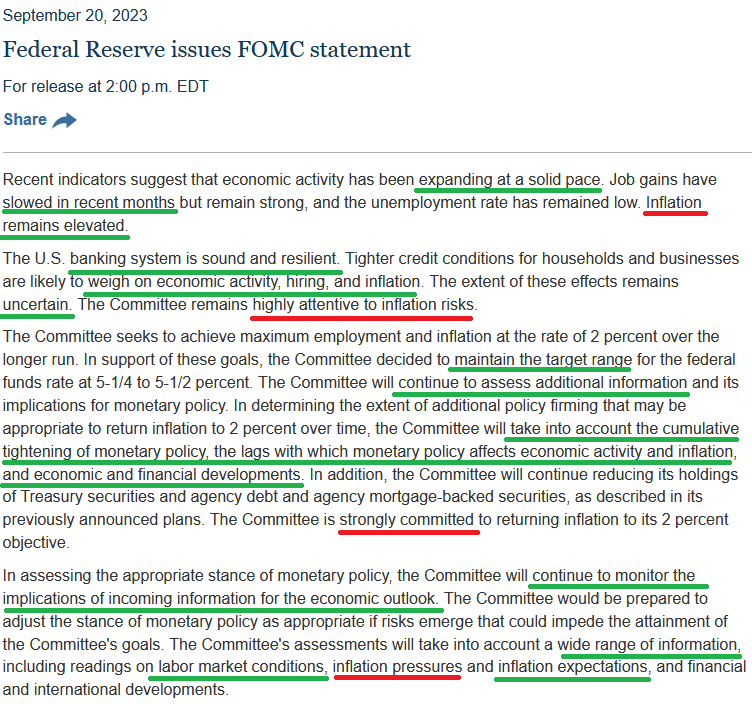
Fed Statement:
Always remember, the first move is not always the right move. Despite equities selling off, bonds selling off and USD climbing after the press conference, the ODDS of a hike before the end of the year actually came DOWN:
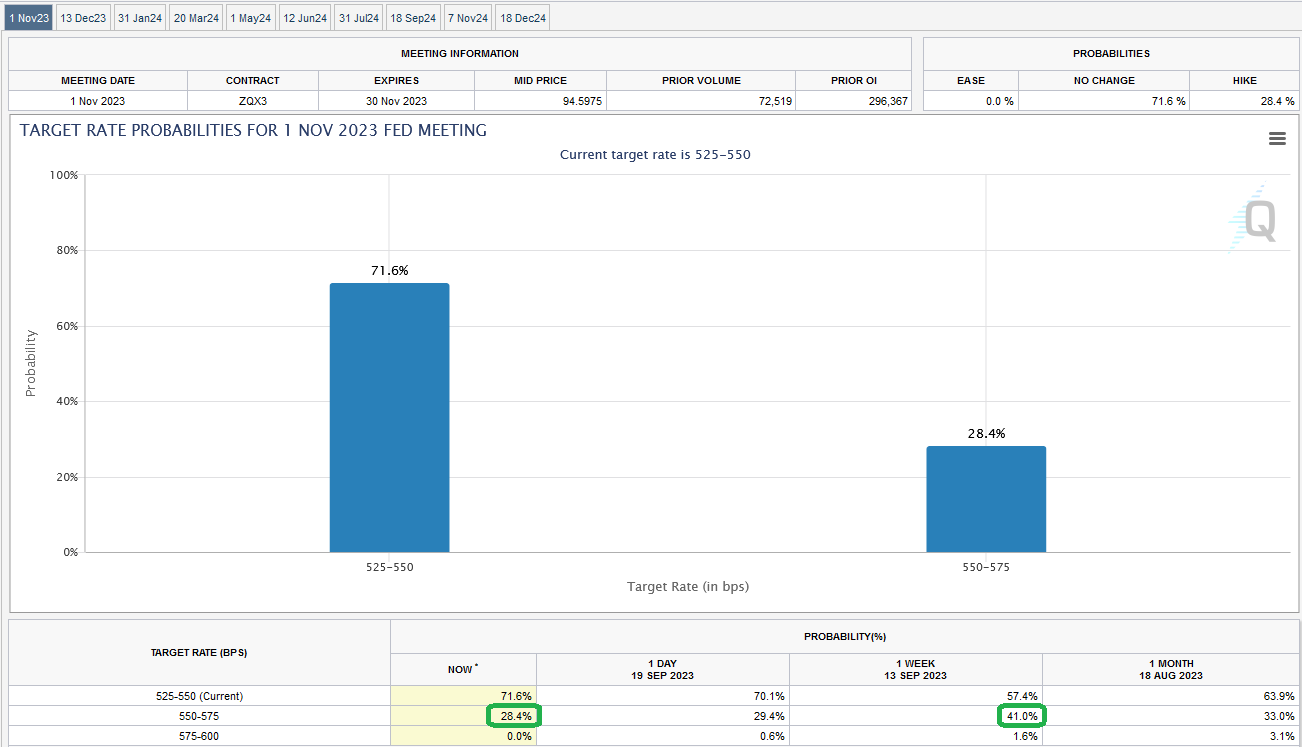
Odds of a 25bps hike in November dropped from ~41% a week ago to ~28% now.
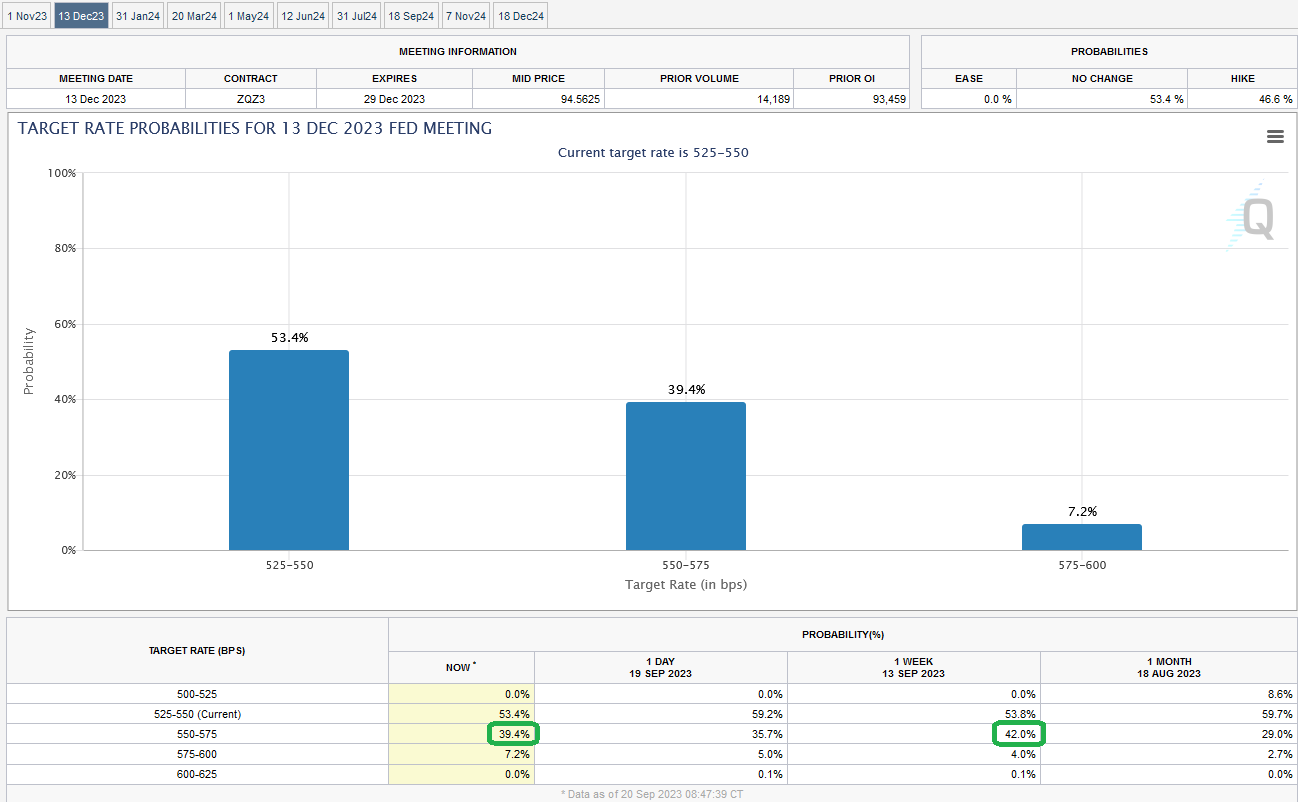
Odds of a 25bps hike by the December meeting dropped from ~42% a week ago to ~39% now.
Sell Rosh Hashanah, buy Yom Kippur
The Fed gave us what was expected. Pause hikes and threaten to do more. No major surprises. But, we are where we are in the calendar and just need to sit through a little air pocket:
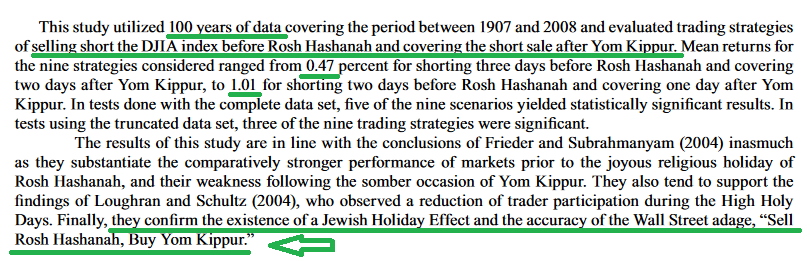
source: Yatrakis and Williams, “Sell Rosh Hashanah, buy Yom Kippur”
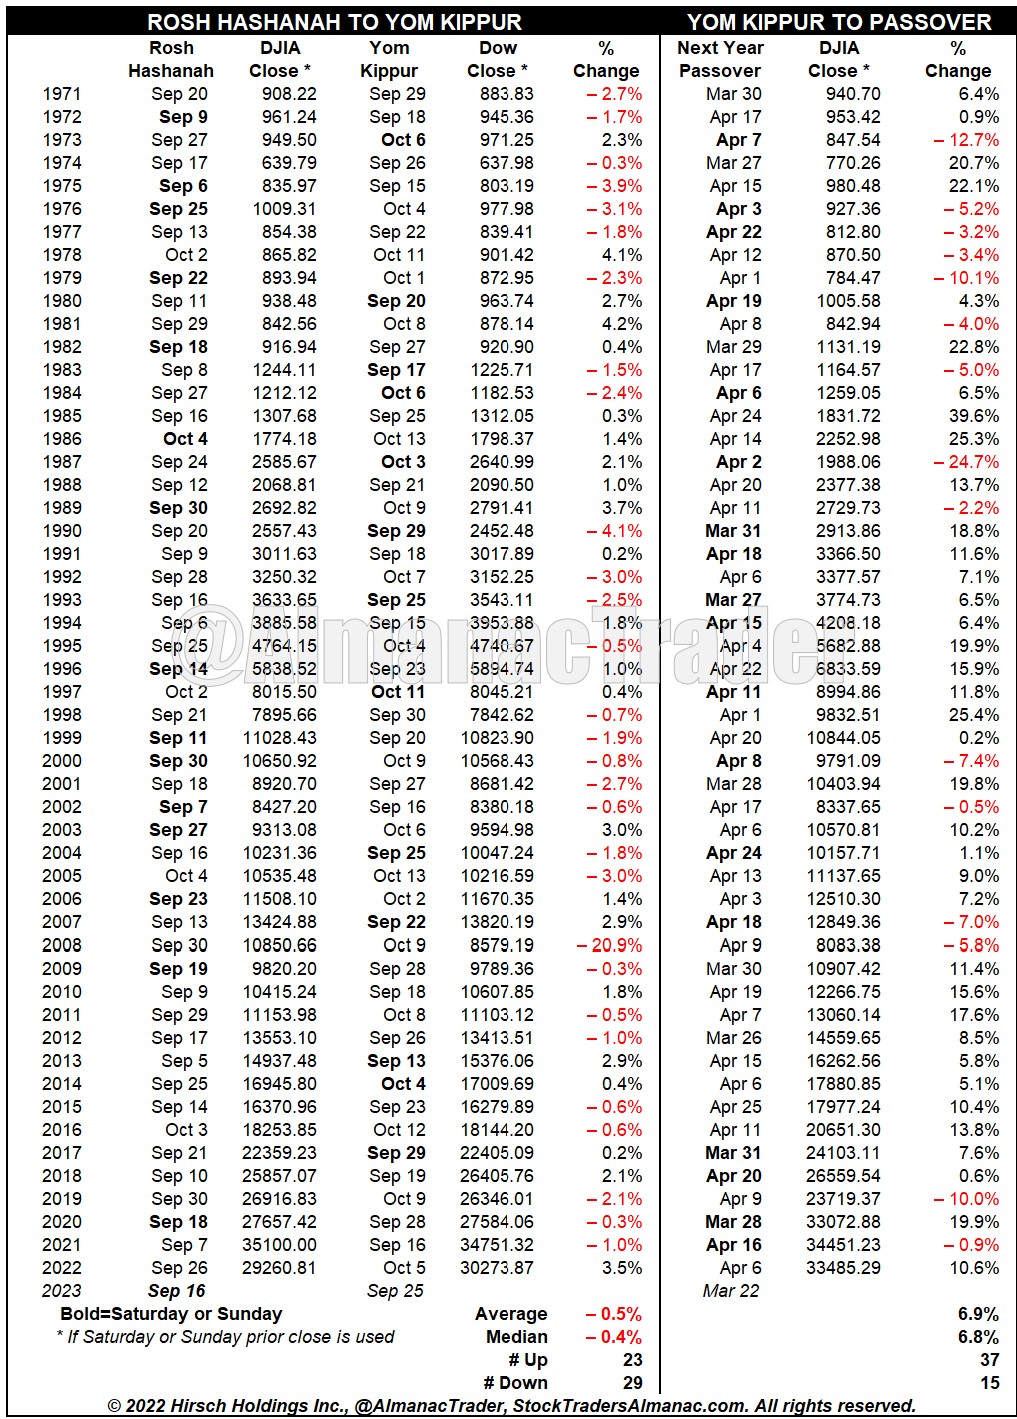
Source: Almanac Trader/Jeff Hirsch
In case you are wondering, Yom Kippur is the Evening of Sun, Sep 24, 2023 – Mon, Sep 25, 2023
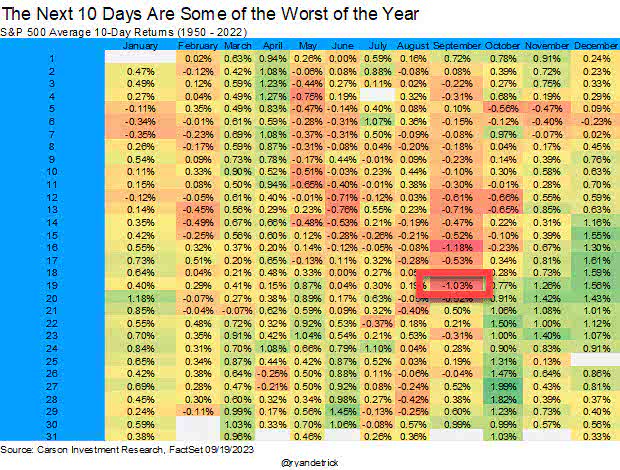
source: Ryan Detrick – Carson
What about the possible Shutdown?
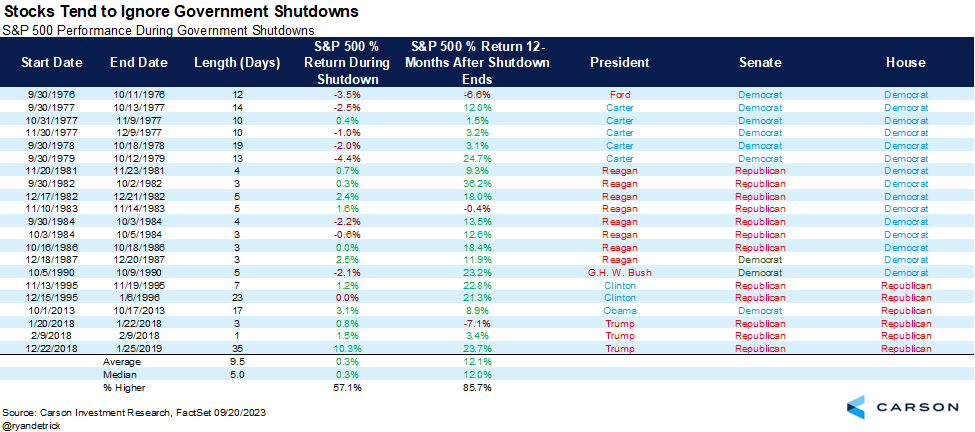
source: Ryan Detrick – Carson
Now onto the shorter term view for the General Market:
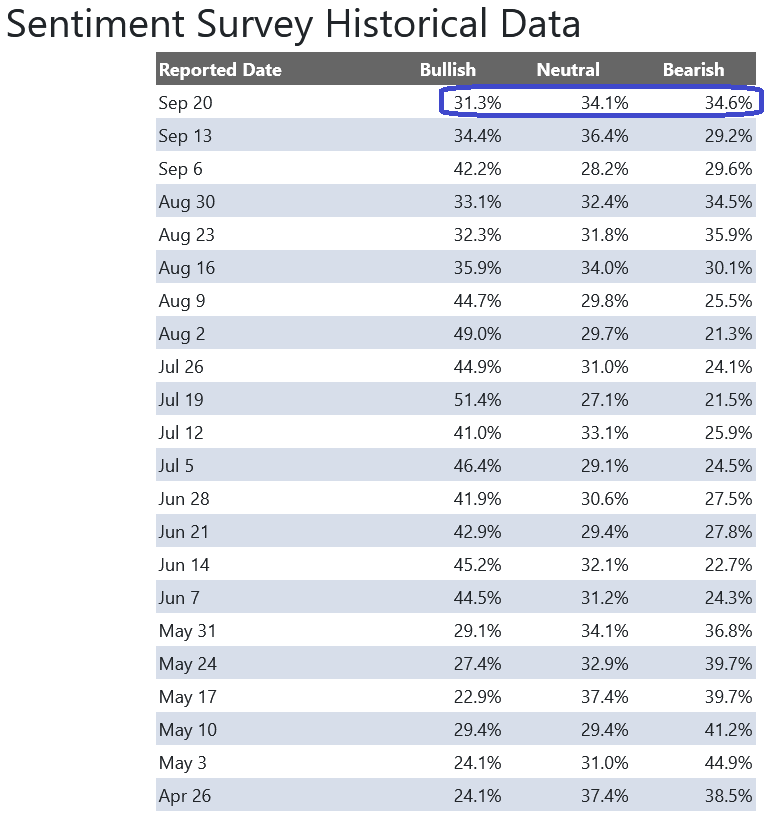
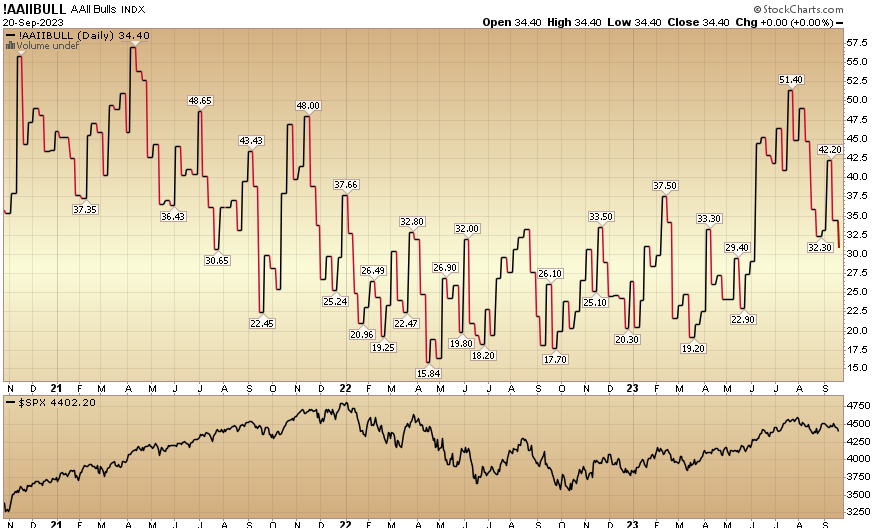
In this week’s AAII Sentiment Survey result, Bullish Percent (Video Explanation) dropped to 31.3% from 34.4% the previous week. Bearish Percent ticked up to 34.6% from 29.2%.
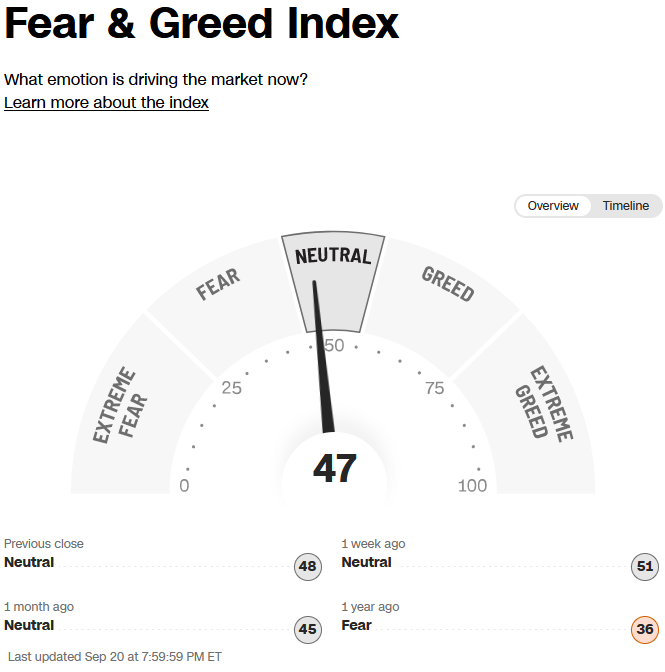
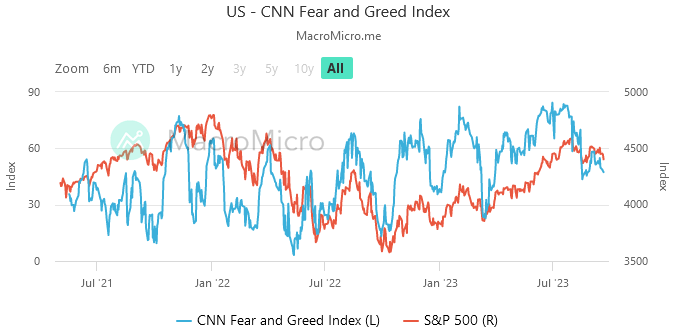
 The CNN “Fear and Greed” ticked down from 51 last week to 47 this week. You can learn how this indicator is calculated and how it works here: (Video Explanation)
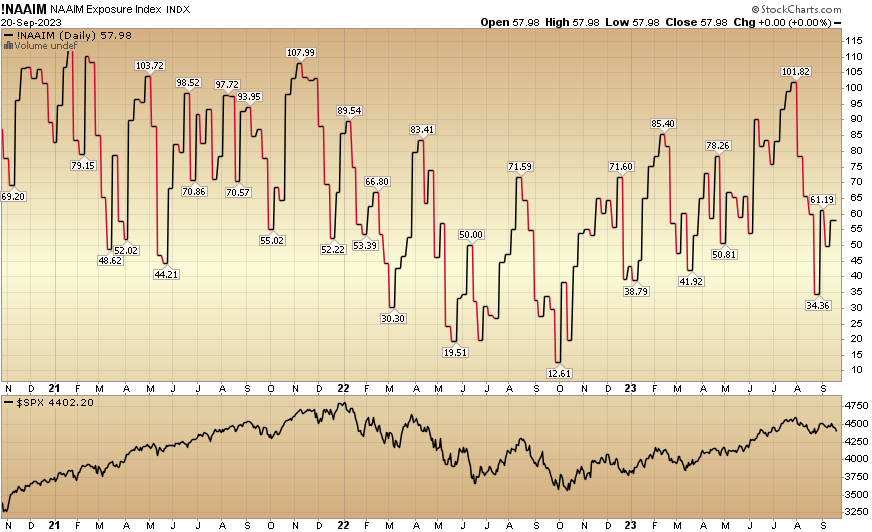
 And finally, the NAAIM (National Association of Active Investment Managers Index) (Video Explanation) rose to 57.98% this week from 49.73% equity exposure last week.
Our podcast|videocast will be out late today or tomorrow. Each week, we have a segment called “Ask Me Anything (AMA)” where we answer questions sent in by our audience. If you have a question for this week’s episode, please send it in at the contact form here.


