

Yesterday I joined Paul Vigna on Public.com to discuss my latest views on the market as well as opportunities/risks moving forward. Thanks to Mike Teich and Paul for having me on:
Despite a weekend of swim meets for our girls, we decided to pull together a last-minute Super Bowl party for a few friends and families at the house. My friend Bill was over and asked me a question that sparked the following line of thought:
“Tom, what are your thoughts on constructing a bond ladder with short-term rates so high?”
My immediate instinct is to look for the risk. Where can you get hurt? I told him, it’s interesting you bring that up because everyone has moved in that direction. Now Bill is a “hitter” and he was only asking regarding a small position in his portfolio (he has plenty of equities), but most have moved in that direction IN SIZE.
So to answer my own question, “if everyone is doing it, where’s the pain?” If rates go UP higher than expected, you have a temporary decline in the price of your bonds, but it doesn’t matter as they mature in less than a year. If yields compress, the price of your bonds goes up before maturity. Seems like a “no brainer” right?
Here’s where the pain is hidden:
1) You are receiving a negative real yield. After inflation, your real return is approximately (-1.50%).
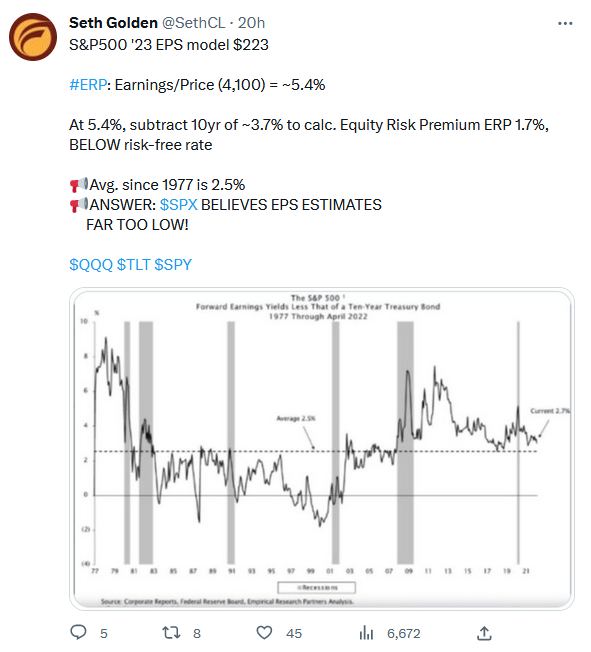
2) This is where ALL the pain is and no one is even considering it: While the masses “get paid to wait” in bonds “until the storm has come and gone” they may be missing the big joke. What’s the big joke? The market already discounted the storm (they are waiting for) last year and while earnings may come down a tad more in the short term, the “discounting mechanism” (that is the stock market) priced it in 6-9 months ahead of time as it does every cycle:
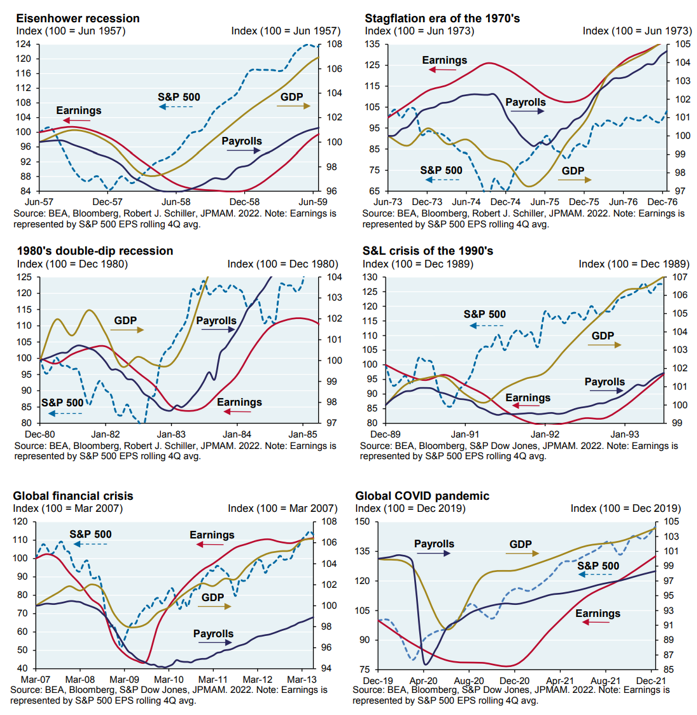
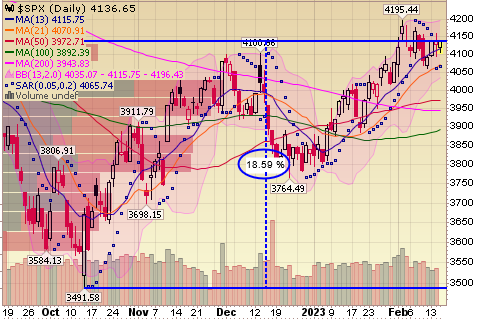
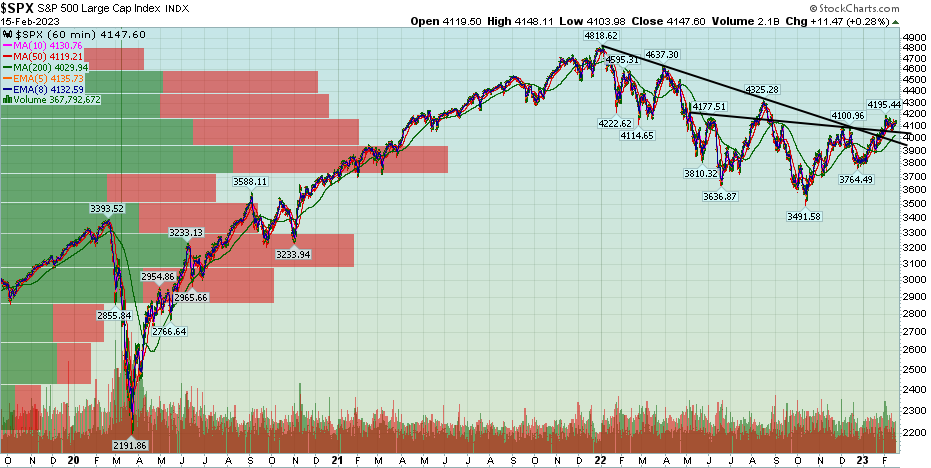
***THE PAIN THEN IS BEING IN “SAFE SECURE BONDS” WAITING FOR A STORM THAT HAS ALREADY PASSED. WHAT DO YOU DO IF YOU WAKE UP IN 6 MONTHS AND THE S&P 500 HAS RUN TO 4500, 4600, 4700, 4800? YOU WILL HAVE MISSED ANOTHER ~15-20% move in equities. Why do I say “ANOTHER?” Because most people sold “in the hole” in October when we were pounding the table to buy and already missed the first 18.5%:
Errors of omission are acceptable. If you were down because there was no place for you to hide last year and it was one of the 4 worst years for Stocks/Bonds in 100 years – that is 100% understandable. Errors of commission however are unacceptable and can be deadly. If you “sold in the hole” in October, or didn’t take advantage of the opportunity to add to quality positions that were down, you may never get that opportunity back. Moves of 18.5% in ~3 months are rare. Moves of 40% in 12 months are rarer still. If you are in t-bills and markets press higher against the “wall of worry”, missing a 30-40% move in 12 months is unlikely to be recovered without taking excess risk. Unfortunately, these big moves usually only come out of large corrections like we had in 2022.
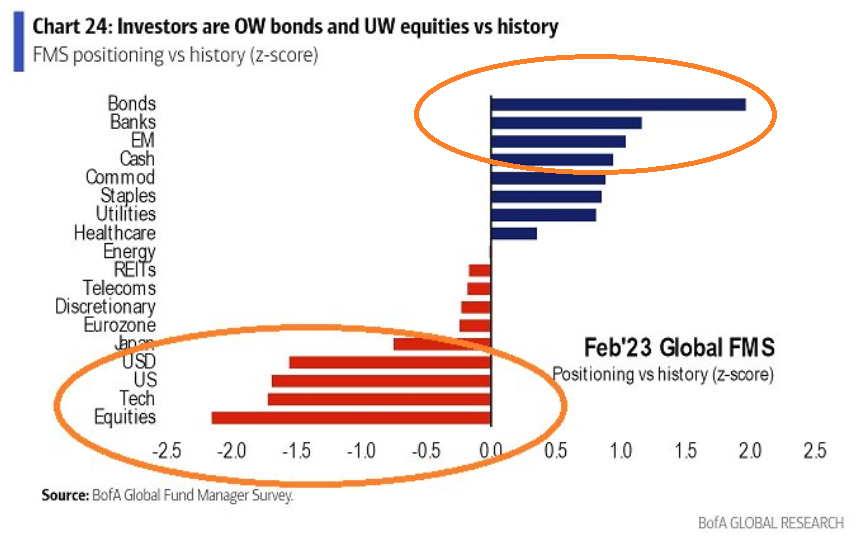
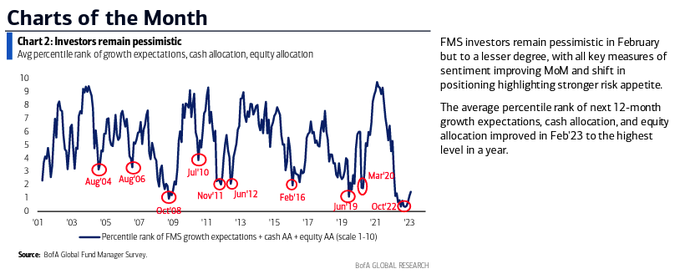
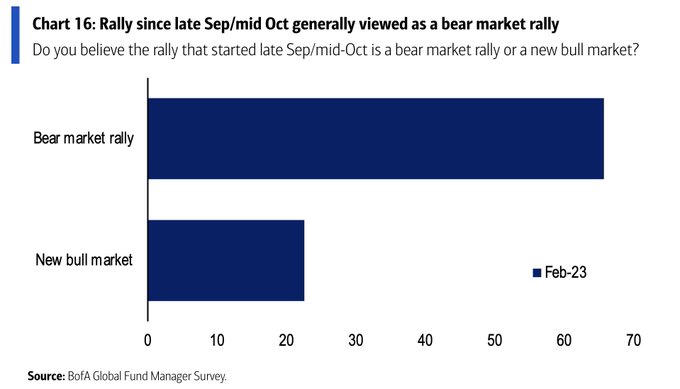
If you’ve been listening to our podcast|videocast for some time, you took advantage of the weakness this past fall and have had an amazing move off the lows. If you delegated to other managers (per the BofA survey below), they may still be on the wrong side of the trade and switched to bonds at the exact wrong time. Not only did they switch “in the hole”, they have doubled down on the error of late. Here’s all you need to know from this week’s Bank of America Fund Manager Survey:
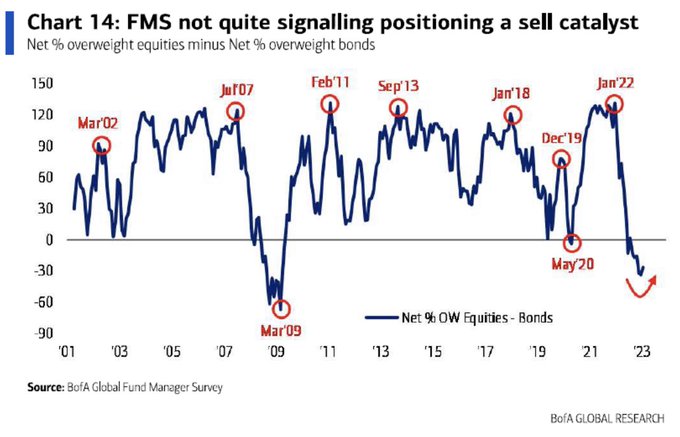
I am fully aware that after taking such an unconventional position in the Fall – and following up with this note prospectively – that the market is likely to consolidate/pull back within minutes of me hitting the “publish” button! However, what may or may not happen in the short term has nothing to do with what happens in the next 6-12 months and we are constructive irrespective of any short-term noise/digestion:
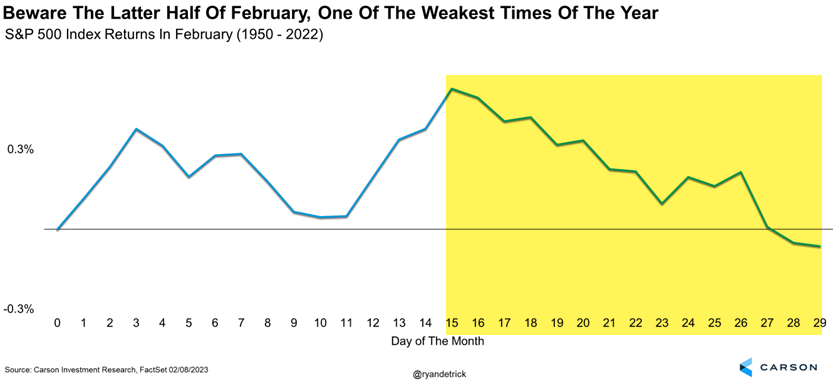
source: Ryan Detrick
Source: HedgeFundTips.com
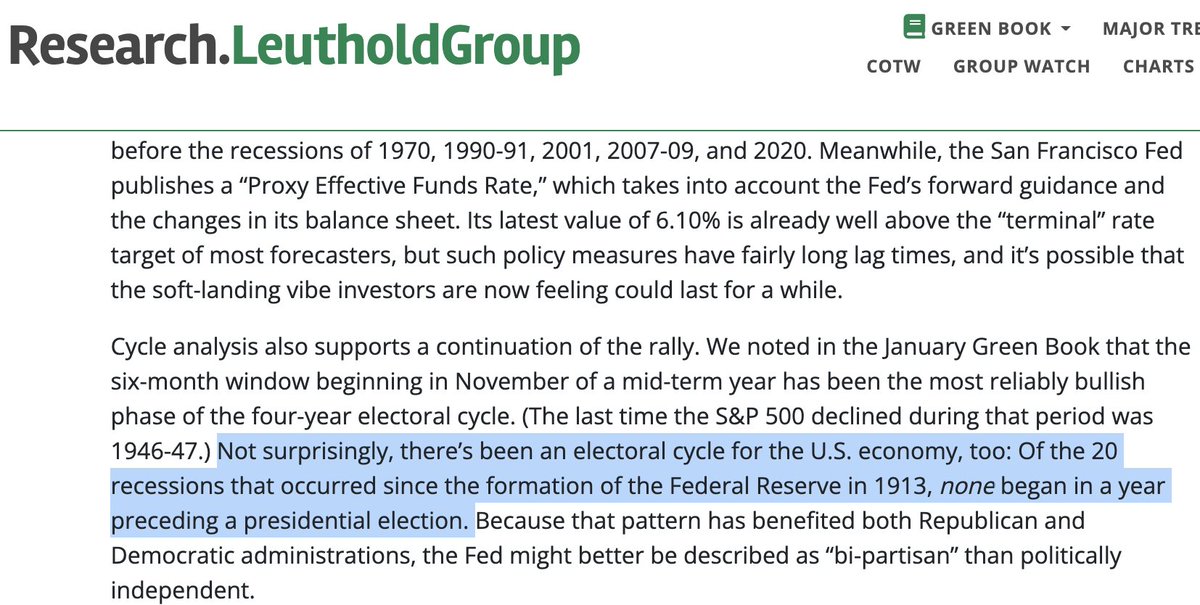
Markets always rebound on HIGH MULTIPLES (due to trough earnings), not LOW MULTIPLES. Every commentator you see on TV has been telling you not to buy equities the entire ride up because “multiples are too high and earnings have to come down.” Now that 2022 earnings are done, the market is starting to look forward to 2024. What are 2024 estimates today? ~$250 on the S&P which means we are trading ~16.5x forward estimates. Just as the market discounted the decline for 2023 earnings in 2022, it will discount the rebound for 2024 earnings in 2023. Check out the Equity Risk Premium below. Of further note, if we did get the recession that everyone’s looking for in 2023, it would be the first time in history that one came in a pre-election year:
CHINA
As we have said on the last two podcast|videocast(s), when Alibaba hit around $120, everyone finally started piling in (after it was up 100% off the lows). Maximum pain then was to shake out all of the late money. It is happening now. I am hopeful we can get a print in the mid-90’s to buy for new/add for existing clients because at those levels, the $120 (late) money will be sufficiently flushed. The next leg higher will not stop at $120… More likely it will force those weak hands back in at the $140-160 range before the next flush. We have Alibaba earnings next week. Expect them to be bad as the country was closed in Q4. The key will be guidance moving forward.
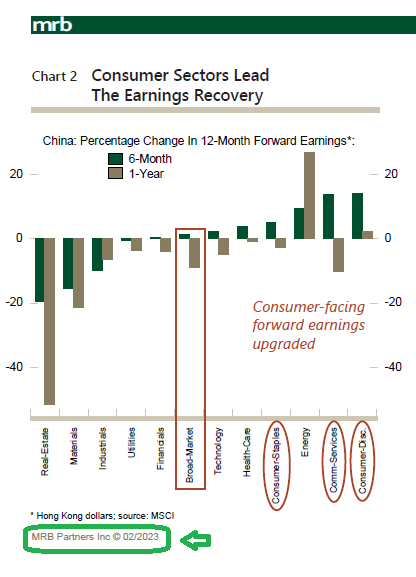
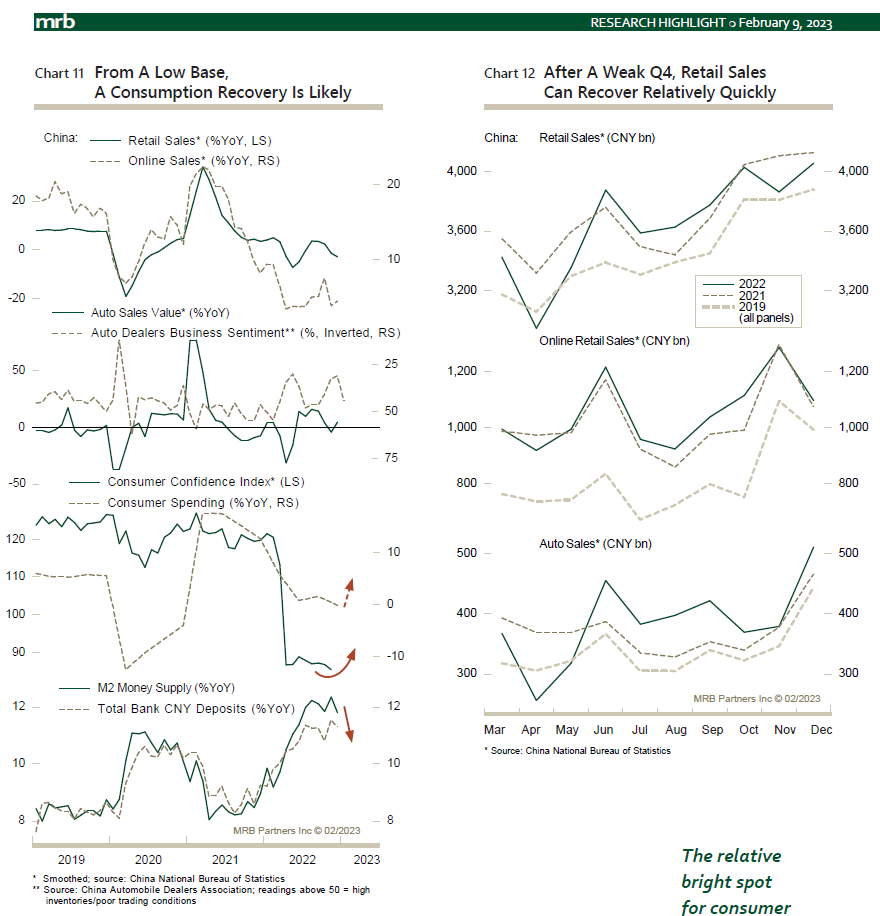
As for China equities as a whole (including Alibaba), markets are likely to bounce back in March as the National People’s Congress will guide the markets with more policy support in the form of consumption stimulus (Alibaba is the “toll taker” for consumption in China) and more relaxed real estate measures. In the meantime, we have to get rid of some of these “johnny come latelies” before we resume higher:
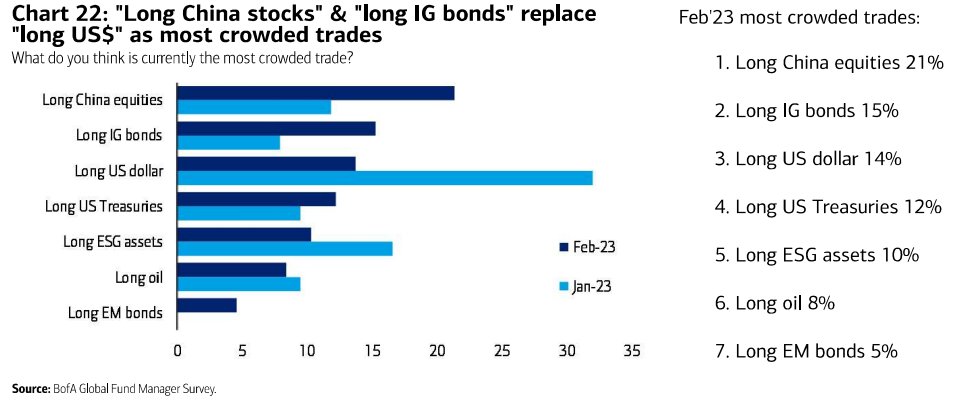
This is not a major concern, as when US Tech held the “most crowded trade” spot it did so for years, not weeks or months.
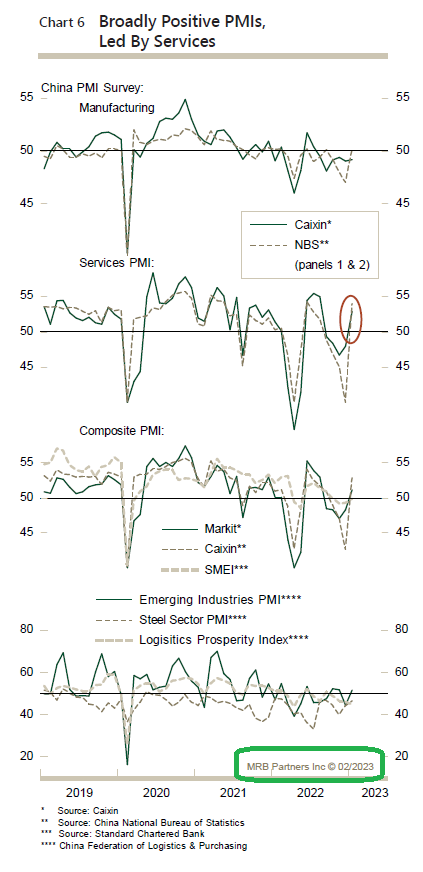
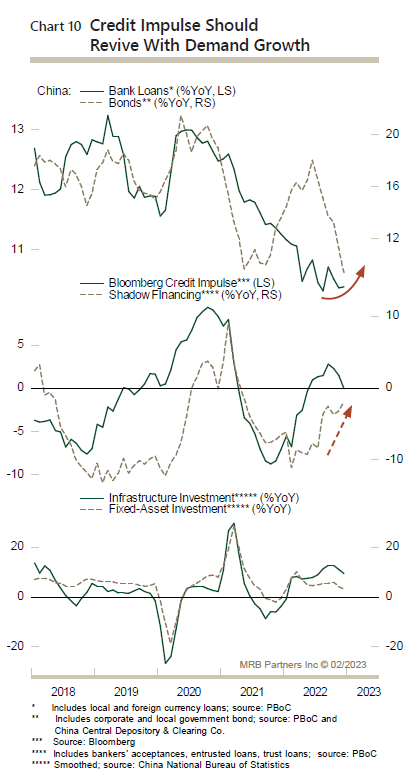
In the meantime, Chinese data are all beginning their ascent in the the right direction toward 5%+ GDP growth in 2023. Just a handful of weeks ago the country was completely locked down. The patient (China) had a two year heart attack (lockdown). Give him time to walk around in the hallway with his IV on wheels and find his sea legs (let the stimulus work through the system) before you send him home in his sports car at 110 mph (5%+ GDP)!
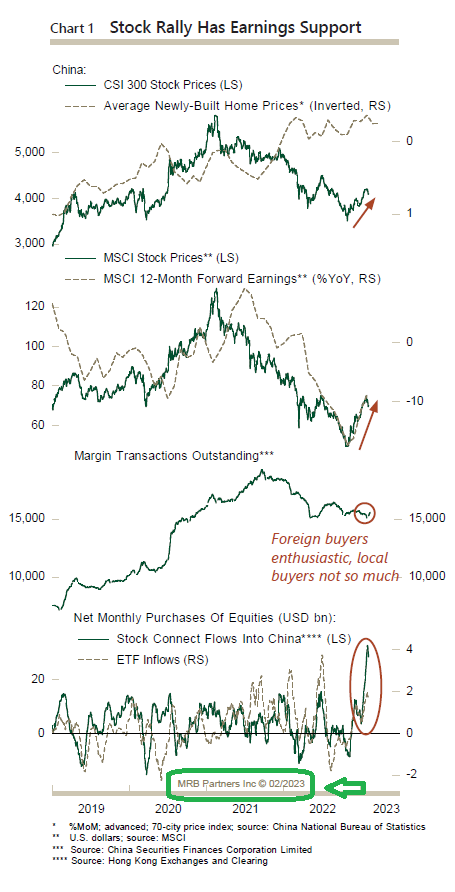
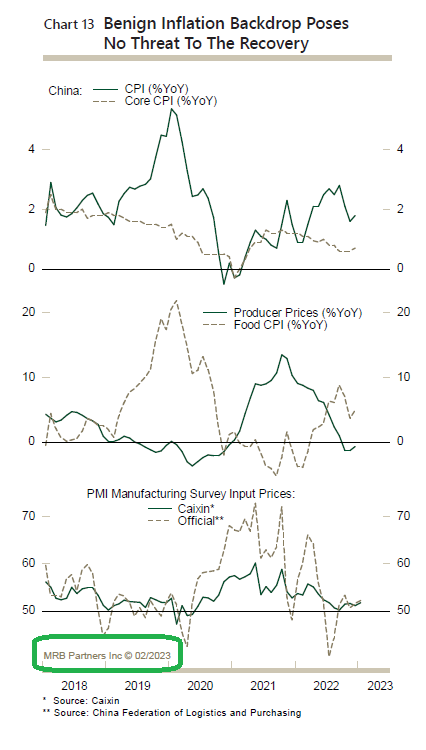
All Tables Above Sourced By: MRB Partners
Auto-Supplier
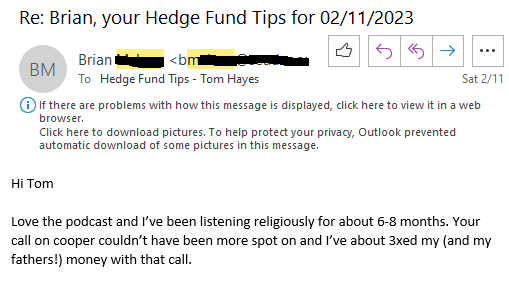
Here is a nice note I received from one of my podcast|videocast listeners who got into CPS when we put it out in May (scroll down this article to see Fox Business hit from June 7):
Source: MUFG – Joyce, Orr, Kendal
Cooper Standard reports tonight after the bell and will host their conference call on Friday Morning. Whether Q4 earnings came in good or bad is immaterial. The only number that matters is whether INDUSTRY production starts to move back toward 2017 peak levels over the next few years. See thesis here (scroll down).
Our base case (with the average car at its oldest age in history ~13.1yrs) is that this is a high probability outcome. For the big US OEMs who think they are going to hold back supply for higher margins – like they got away with in 2018-2022, good luck. With semiconductors now flowing in, Hyundai, Nissan, Toyota, Kia and others will flood the US market and start to take share – first at the low-end, then mid, then high-end (that US OEMs have dominated). The days of managed scarcity are now over alongside the supply shortage. Get ready for the days of non-stop TV ads, dealer incentives, fuller lots and low APR deals coming non-stop to a theater near you:
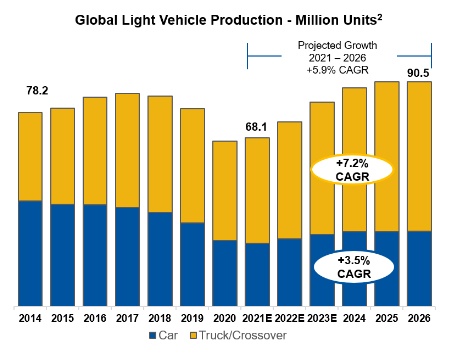
If volumes return by 2024-2025, we estimate CPS can earn between $5-8+ per share. Applying a trough (10x) or peak (20x) historic multiple implies meaningful upside from here. Our view on tonight’s Q4 earnings report? Pray they are terrible so the stock comes in meaningfully to buy more, but don’t hold your breath because it may not happen… The time to buy was at MAXIMUM PESSIMISM in May/June.
Now onto the shorter term view for the General Market:
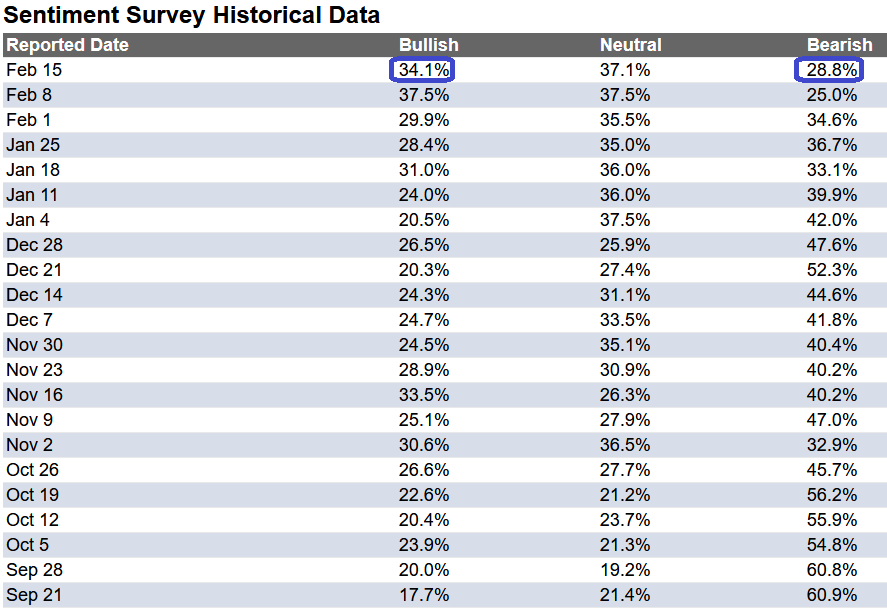
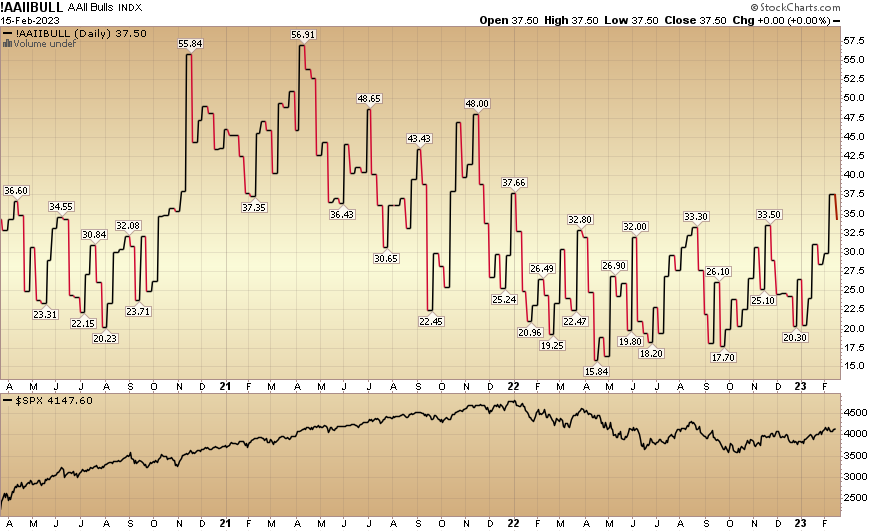
In this week’s AAII Sentiment Survey result, Bullish Percent (Video Explanation) ticked down to 34.1% from 37.5% the previous week. Bearish Percent ticked up to 28.8% from 25%. Sentiment is warming up, but could run even hotter.
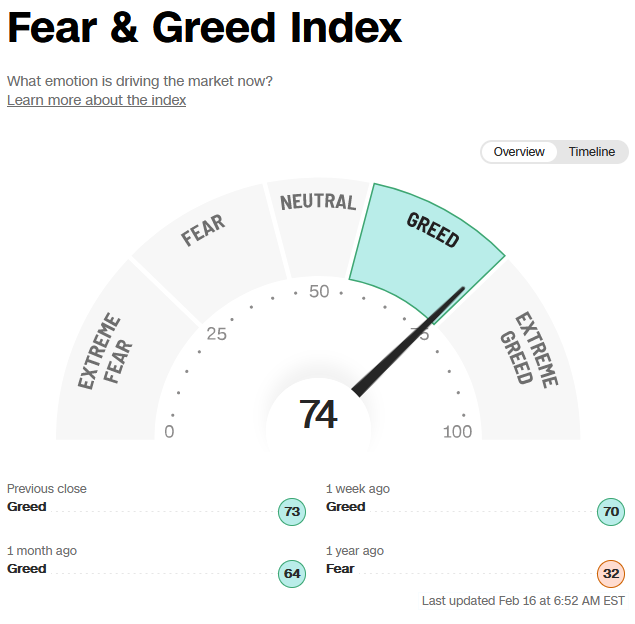
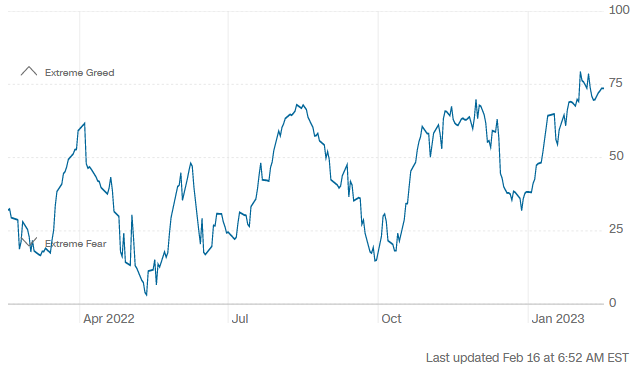
The CNN “Fear and Greed” ticked up from 73 last week to 74 this week. Sentiment is getting hotter. You can learn how this indicator is calculated and how it works here: (Video Explanation)
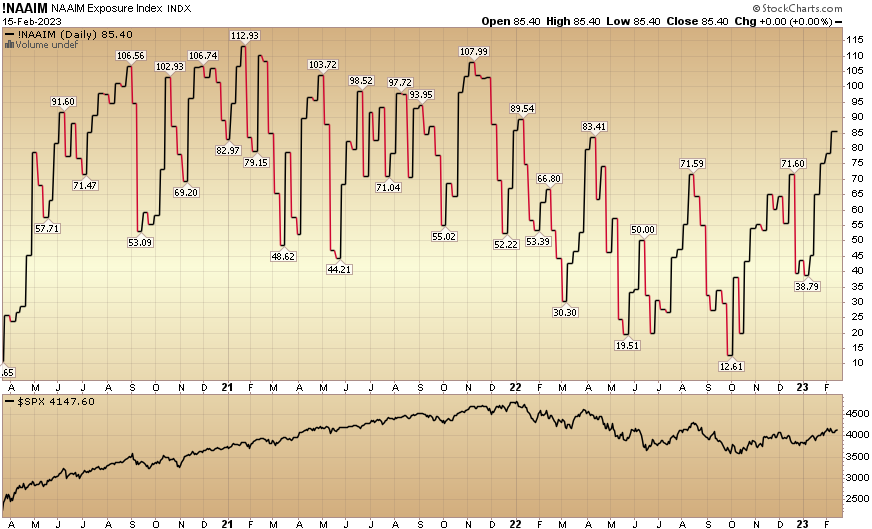
And finally, the NAAIM (National Association of Active Investment Managers Index) (Video Explanation) moved up to 85.4% this week from 78.37% equity exposure last week. Managers are now chasing as they came into the year with record levels of cash.
Our podcast|videocast will be out today or tomorrow. Each week, we have a segment called “Ask Me Anything (AMA)” where we answer questions sent in by our audience. If you have a question for this week’s episode, please send it in at the contact form here.
*Opinion, not advice. See “terms” above.


