Here’s what everyone feels like doing after the last few weeks of market action:
Here’s what it felt like holding most equities over the past week:
@sportsnet Nurse said SEE YA, JAMIE. 💥👋 #nhl #nhlonsn #hockeytiktoks #hockeyhits ♬ original sound – Kate 💥
Take two…
@user1737488226 bad day to be a golf club #onlyinmycalvins #PringlesCanHands #TalkingTree ♬ original sound – user1737488226
In 2017, Country Star Jon Pardi released his hit “Heartache on the Dance Floor.” It peaked at #3 and #5 on both the Billboard Country Airplay and Hot Country Songs charts respectively. It also reached number 47 on the Hot 100 chart.
While not a perfect metaphor for the recent stock market climate, it’s pretty darn close. So many companies and sectors now trading down at big discounts but unwilling to bounce YET…
So while it’s a heartache eyeing these undervalued stocks that don’t yet want to recover, we need to bear in mind the wisdom of Cody Johnson in his recent hit, “‘Til you can’t”:
If you got a chance, take it, take it while you got a chance
If you got a dream, chase it, ’cause a dream won’t chase you back…
So while dip buyers – trying to pick up stocks on the cheap – have not been rewarded so far this year, that may be about to change. Particularly in those sectors trading with a huge margin of safety when you apply the proper time horizon…
We bought/added to selective stocks and sectors this week.
The Generals’ Last Stand
On Wednesday morning I joined Alicia Nieves on Cheddar News to discuss Microsoft and Alphabet’s earnings. Thanks to Ally Thompson and Alicia for having me on. As these were the first two “generals” of the market to report, they were critical to set the tone as to whether rising earnings estimates have been justified (or wrong):
Here were my show notes ahead of the segment:
MICROSOFT: EPS 2.22 act | 2.19 est – REV 49.4B act | 49B est
- Revenue: $49.4B up 18%
- Operating Income: $20.4B up 19%
- Net Income: $16.7B up 8%
- Diluted EPS: $2.22 up 9%
CLOUD: better than expected cloud commercial bookings growth of 28% and Microsoft Cloud revenue of $23.4 billion, up 32% year over year.
-Revenue in Productivity and Business Processes was $15.8B ($15.8B est) and increased 17%:
- Office 365 Commercial revenue growth of 17%
- Microsoft 365 Consumer subscribers grew to 58.4 million
- LinkedIn revenue increased 34%
-Revenue in Intelligent Cloud was $19.1B ($18.9B est) billion and increased 26%:
- Server products and cloud services revenue increased 29% driven by Azure and other cloud services revenue growth of 46%
-Revenue in More Personal Computing was $14.5B ($14.3B est) and increased 11%
- Windows OEM revenue increased 11%
- Xbox content and services revenue increased 4%
BUYBACK: Microsoft returned $12.4 billion to shareholders in the form of share repurchases and dividends in the third quarter of fiscal year 2022, an increase of 25%.
“This is a good bellwether for the rest of software, there’s no big slowdown in the spending environment.”
Strong Guidance: $52.4B-$53.2B vs $52.95B consensus.
ALPHABET: EPS 24.62 act | 25.75 est – REV 68.01B act | 68.08B est
- Revenue: $68B up 23%. lowest growth rate since late 2020.
- Operating Income: $20.1B up 30%
- Net Income: $16.43B down (8.3)%
(weighed down by accounting factors linked to some investments)
- Diluted EPS: $24.62 down (6.3)%
Revenues:
-Google Services $ 61.5B up 20.1%
-Google Cloud $5.8B up 43.82%
-Other Bets $440M up 122%
______________
Google Services Breakdown:
- Google Search & other – $39.6B up 28%
A rebound in travel as pandemic restrictions continued to ease helped underpin the company’s revenue growth. Travel searches were above what the company had seen in the pre-pandemic first quarter of 2019.
- YouTube ads – $6.9B up 39%. (missed expectations by $600M $7.5B est)
CFO Ruth Porat: Russia’s assault on its neighbor, which kicked off in the first quarter, had “an outsize impact on YouTube ads relative to the rest of Google” Reduction in spending primarily by brand advertisers in Europe.
The Shorts feature had grown to more than 30B daily views, or four times the year-earlier figure.
- Google Network – $8.2B up 20.21%
Alphabet also said it would repurchase up to an additional $70 billion of some of its stock.
Weak Guidance:
Chief Financial Officer Ruth Porat said revenue growth in the company’s advertising business will face a tough comparison in the second quarter of 2022. The results will also reflect the suspension of commercial activities in Russia, Porat added.
META/FACEBOOK
Expectations LOW: “Sell the rumor, buy the news?” Expected to Post Slowest Revenue Growth Since IPO. $2.56 EPS est. $28.32B rev (up 8%). Below 10.7% is slowest since IPO.
Headwinds: growing competition for users and privacy headwinds in its advertising business.
Shares down 44% since last report.
Key: any signs Meta can show of progress minimizing the effect that ad-tracking changes introduced by Apple Inc. last year.
Company warned that those changes would cost Meta some $10 billion in 2022.
Analysts predict Meta’s advertising revenue will rise to $28.3 billion in the first quarter of 2022, up a little more than 8%.
FB is also expected to report a $7.1 billion profit, which would represent a decline in net income for the second quarter in a row.
FB expected to report an uptick in its daily users to 1.95 billion, from 1.93 billion reported in February.
Meta has responded to the threat of TikTok by expanding the availability of its own short-form video format, known as Reels.
AMAZON
Consensus EPS $8.35, down sharply from $15.79 last year. Amazon has beaten estimates six of the last seven quarters.
Consensus Revenue $116.5B, up from $108.5B last year.
AMZN will get a boost from fuel surcharges, Prime membership hikes.
Amazon has spent more money on e-commerce-focused CapEx in the last two years than it has in the prior decade preceding the pandemic: ~$81.7 billion during 1Q20-4Q21 versus ~$73.8 billion for all of 2009-2019.
-Expect online sales growth to decelerate in the first quarter with strong results for the AWS and advertising arms.
_______________________________________
We were pleased to see that not only were MSFT and GOOGL earnings solid, but FB/Meta bounced back strongly after reporting after the close last night. Here were the key points:
- Facebook daily active users (DAUs) – DAUs were 1.96 billion on average for March 2022, an increase of 4% year-over-year.
- Facebook monthly active users (MAUs) – MAUs were 2.94 billion as of March 31, 2022, an increase of 3% year-over-year.
- Share repurchases – We repurchased $9.39 billion of our Class A common stock in the first quarter of 2022. As of March 31, 2022, we had $29.41 billion available and authorized for repurchases.
Sentiment Washout
On Monday I joined Brad Smith, David Briggs and Rachelle Akuffo on Yahoo! Finance. Thanks to Taylor Clothier for having me on.
In the segment I was scheduled to speak about the general stock market and outlook, but a few minutes before I went on Musk’s deal to buy Twitter was announced and they asked if we could shift gears. We certainly did after I started the interview with, “Elon Musk is the best thing that’s ever happened to Twitter. Twitter had become an abandoned building in a bad neighborhood – with graffiti all over it. Musk is going to rehab this distressed property and make it much, much bigger.” This was a lively impromptu segment:
Here were my original notes for the segment:
Expect mild RECESSION next year:
Bad News: 2/10 spread inverted in recent weeks which likely means we will have a shallow recession in mid to late 2023.
Good News: Stock Market can still work up to new highs in coming months.
Why? Just as stimulus hits economy on a lagged basis (6-12 months after it starts), the same is true with tightening.
Inversions are historically BUY signals (not sell signals):
–Since 1977, there have been 8 yield curve inversions. The S&P 500’s average return in the following year was +11.5%, with dividends +15.2%. Inversions are not a good signal to short stocks.
-The last 4 times the 2/10 yr yield curve inverted shows the S&P 500 rallied for another 17 months and gained 28.8% until the ultimate peak.
EARNINGS
-Earnings Estimates still going UP S&P 500: Up from $225 to $229.76 for 2022 in last 2 months.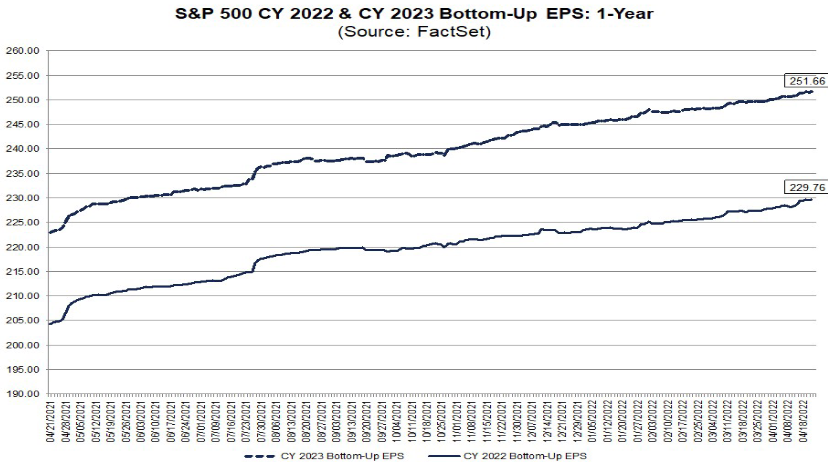
-For CY 2022, analysts are projecting earnings growth of 10.9% and revenue growth of 9.5%. S&P was over 4800. Imp: 5200 high.
-For Q1 2022 (with 20% of S&P 500 companies reporting actual results), 79% of S&P 500 companies have reported a positive EPS surprise and 69% of S&P 500 companies have reported a positive revenue surprise. For Q1 2022, the blended earnings growth rate for the S&P 500 is 6.6%.
The forward 12-month P/E ratio for the S&P 500 is 18.6. This P/E ratio is equal to the 5-year average (18.6)
– CITI Economic Surprise Index ~70 in its most recent read. Highest Levels in over a year.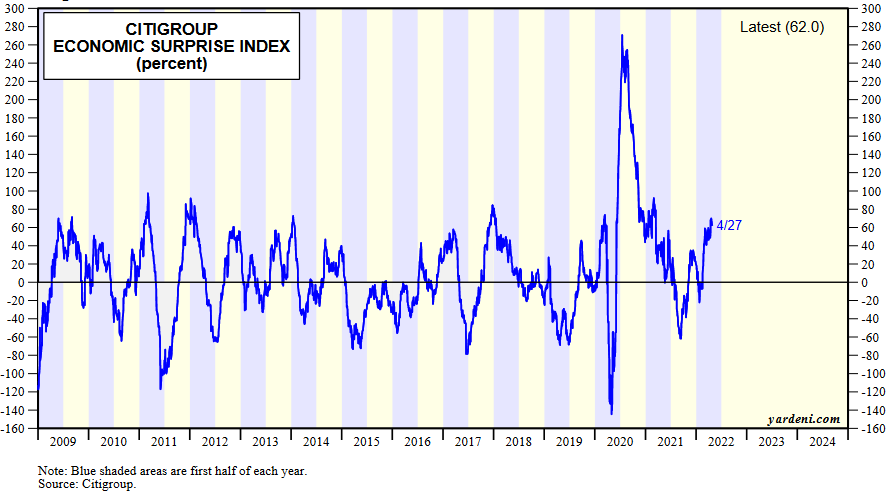
–US Factory Activity Growth Highest in 7 Months: Manufacturing PMI 59.7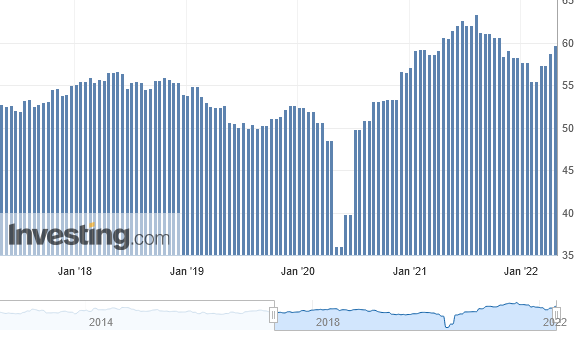
–Michigan Consumer Sentiment ticked up last week: 65.7 vs. 59 est.
-Unemployment rate still at 3.6%.
Tuesday (MSFT & GOOGL), Wednesday (FB) and Thursday (AAPL) are Critical: They are the generals of the market. Their reports and guidance will dictate what the market does in coming weeks. EXPECTATIONS ARE LOW. All have been trading DOWN into the print, which may be good, “Sell the rumor, buy the news.” We’ll see.
Bonds (The “Magic Chart)
If you are wondering when Value Tech, China Tech, Biotech, etc. are going to finish their bear markets and roar higher, you need only look at a chart of long bonds (testing a long term uptrend line)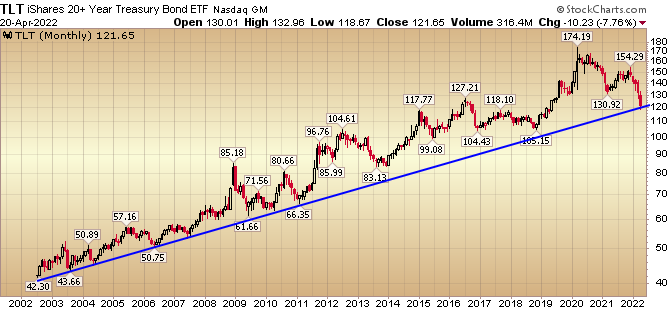
Just look at sentiment today (towards bonds) versus where it was near other inflection points throughout history (@MacroCharts on Twitter):
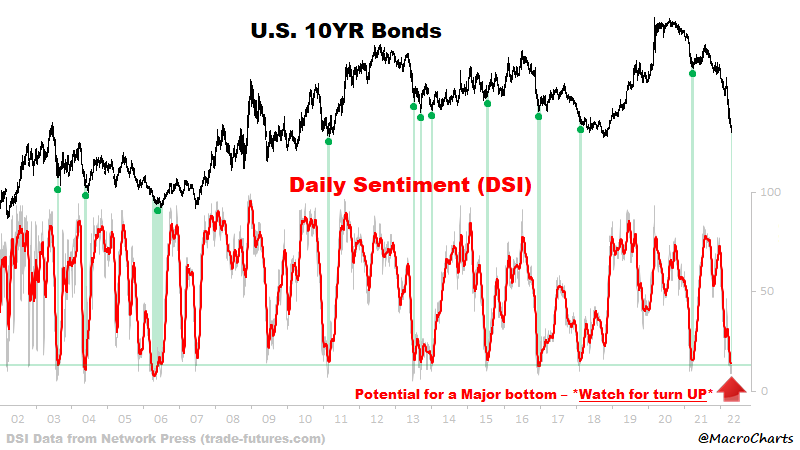
– Perspective: 10yr yield peaked at 3.25% in Oct. 2018 and 3.03% in Jan. 2014.
-US 10yr Treasury yields are becoming too attractive to foreign buyers at these levels. One can borrow in yen or euros and mint money buying our Treasuries at these levels. I think we’re at a “sell the (Quant Tightening) rumor, buy the news” point in time.
-Treasury issuance will decline in coming months as receipts from income tax are used to fund government. Seasonality: This is one of the reasons that bonds outperform from April to Oct (on average last 20 years)
-Any relief in yields will begin to favor that which no one is currently positioned for: 1) biotech, and 2) value (low multiple) tech. Out of Crowded Trade: Commodities/Cyclicals
-We have now come to a point where the market has priced in MORE RATE HIKES THAN ARE LIKELY TO OCCUR. As a result, we believe (regarding yields) that either a) the rate of change will grind to a halt, or more likely b) reverse. Once bonds get bid it will be an abrupt rotation as no one is positioned for it.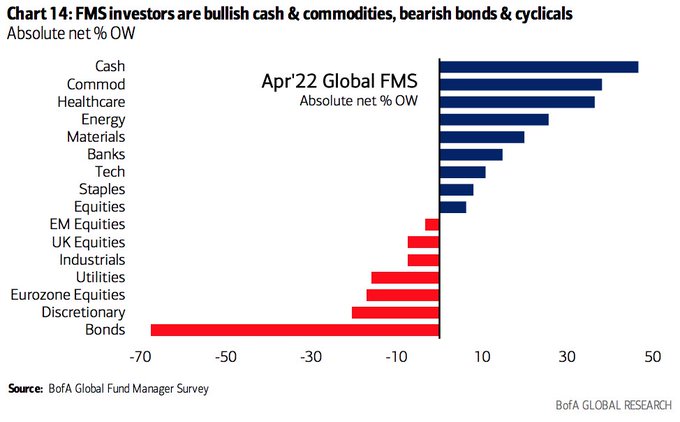
Everything managers have been crowding into (commodities, cash) will get sold down. Everything they’ve been puking out will get bid (Biotech, China Tech, Value Tech). So if you want to know when the tide will turn, WATCH BONDS – then buy what no one has wanted of late.
CROWDED TRADES:
Managers have been panicking out of bonds into Commodities and Cash. As we always say, when the boat gets too crowded on one side of the trade, it’s time to take the other side.
Managers are the most overweight commodities since February 2011. The peak was just eight weeks later.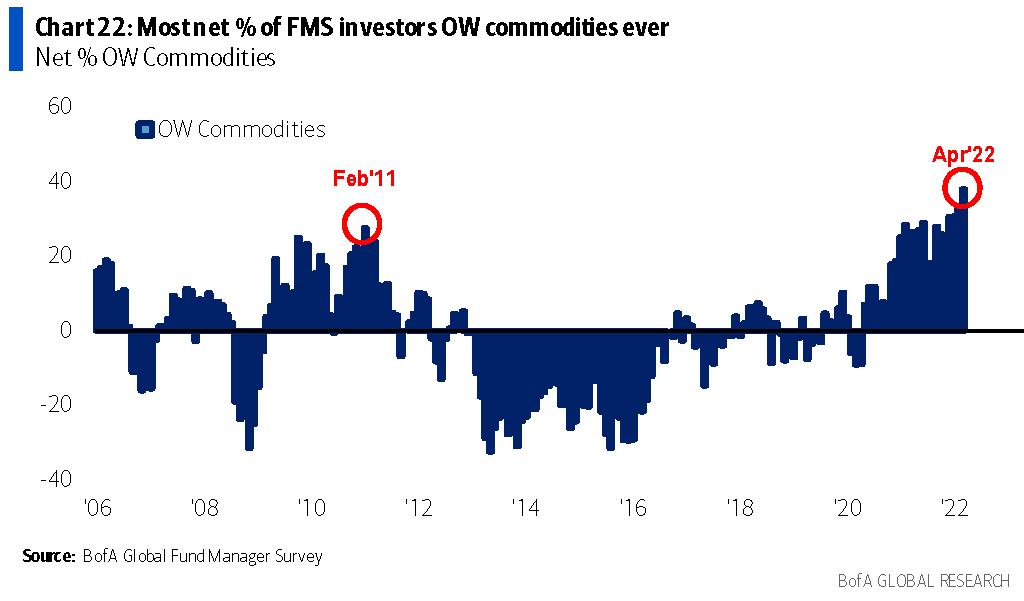
As was the case in 2011, this crowded positioning and euphoric outlook can persist for a couple more months before rolling over, but why pick up the last few nickels in front of a steam roller? The time to “crowd into” energy was fall 2020 when we were pounding the table, not today. We could revisit later in the year after a material pullback, but for now WE SIT ON OUR HANDS and focus on brighter horizons. We look through the windshield to see where the puck may be GOING, not the rear-view mirror where it has already GONE. We are now out of most energy stocks EXCEPT several natural gas names.
Sentiment Very Pessimistic:
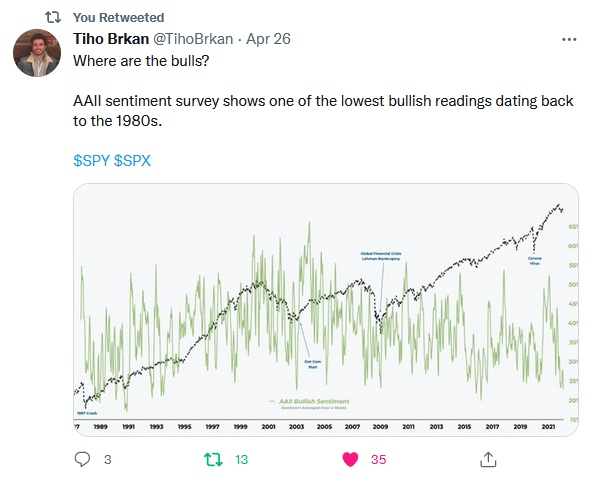
2 weeks ago AAII sentiment survey dropped to a 30 year low at 15.8% bullish. Last week it ticked up modestly to 18.9%.
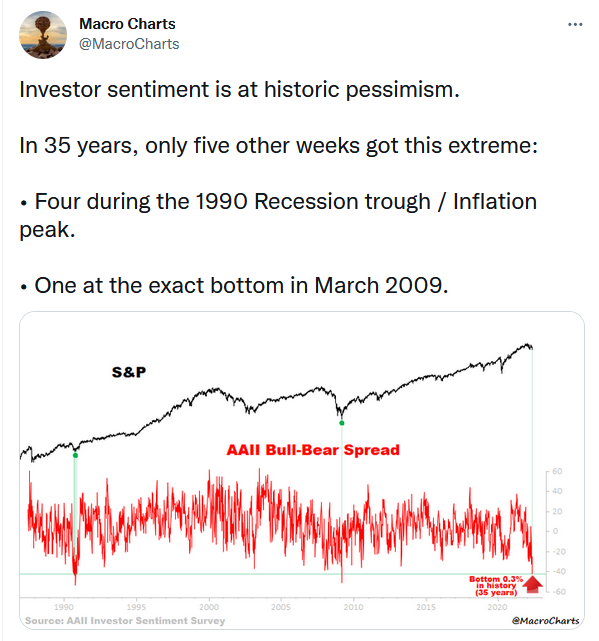
When sentiment gets this low, over the last 25 years, 30 out of 31 times the S&P 500 is up 6 and 12 months later.
6mo later avg = +12.6% 12mo later avg = +19.8%
Here’s a long term sentiment visual from my friend Tiho:
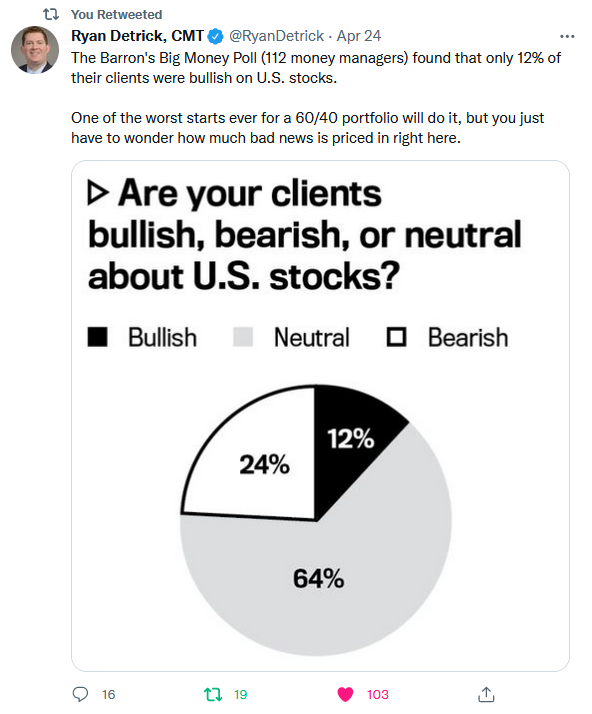
Here’s another barometer from Ryan Detrick:
Don’t Listen to This One…
Unless you are a fan of Elon Musk, you might want to skip this interview I did for mobile brokerage Public.com. As one listener so aptly commented:

Thanks to Michael Teich and Kinsey Grant for having me on. I was a bit passionate in my views on this one…
Now onto the shorter term view for the General Market:
In this week’s AAII Sentiment Survey result, Bullish Percent (Video Explanation) ticked down to 16.4% this week from 18.9% last week. This is still near the most pessimistic sentiment in the history of the survey. Bearish Percent skyrocketed to 59.4% from 43.9%. Retail investors are fearful.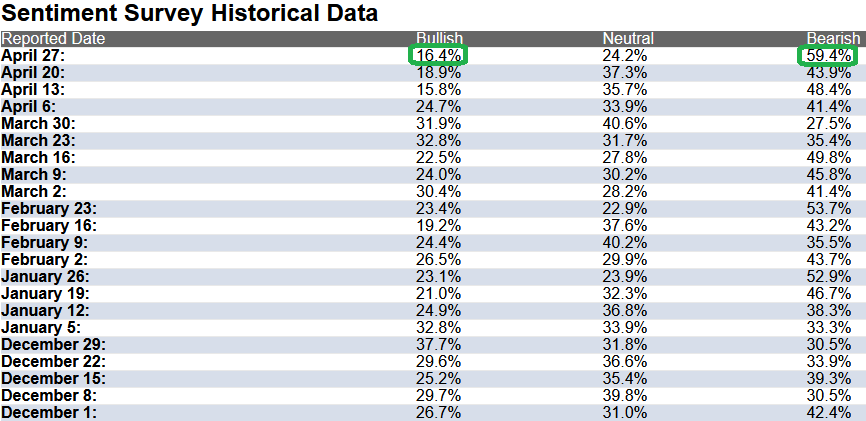

Here’s all you need to know about this level of pessimism:
The CNN “Fear and Greed” Index dropped from 39 last week to 29 this week. Sentiment is fearful in the market. You can learn how this indicator is calculated and how it works here: (Video Explanation)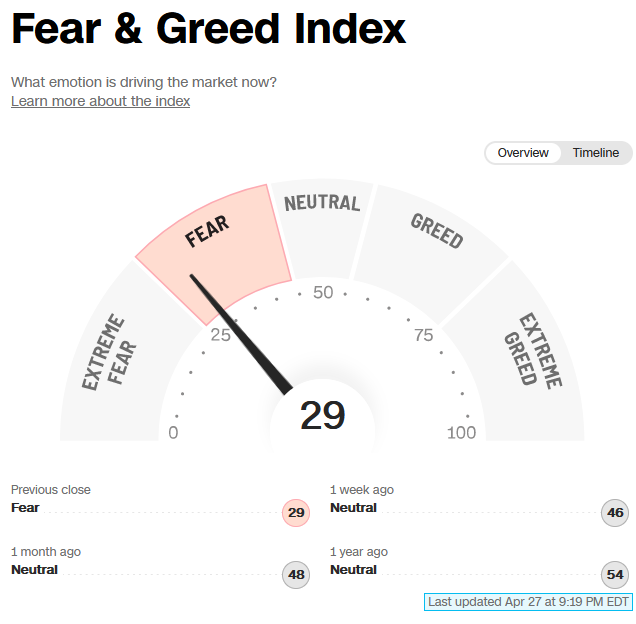
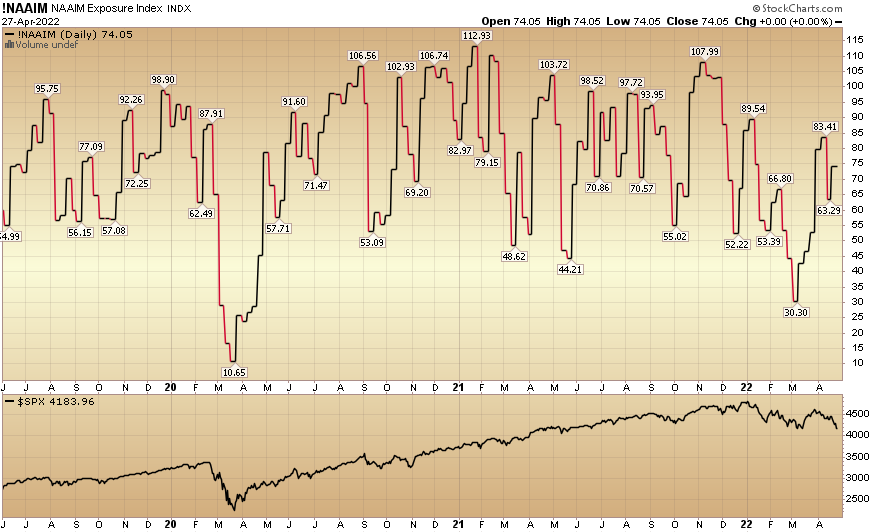
And finally, the NAAIM (National Association of Active Investment Managers Index) (Video Explanation) rose to 74.05% this week from 63.29% equity exposure last week. This is neutral.
Our podcast|videocast will be out on Thursday or Friday this week. Each week, we have a segment called “Ask Me Anything (AMA)” where we answer questions sent in by our audience. If you have a question for this week’s episode, please send it in at the contact form here.
