

The song we chose to capture this week’s market sentiment is Luke Combs’ “Lovin’ on You.” These lyrics accurately describe managers’ (and retail investors’) feelings for the market as of late:
But I’m in love and lovin’ on you
I feel that rush soon as you walk in a room
I can’t get enough of you, honey
You’re right on the money…
We’re seeing signs of froth and euphoria everywhere we look – but no place is it more evident than in IPO valuations. Does that necessarily mean we must correct now as many are calling for in recent days/weeks?
Last Thursday I was on Fox Business with Liz Claman. Thanks to Liz and Jacqueline D’Ambrosi Scales for having me on (as well as Stu Oppenheim for sending me a copy of the segment on Monday). In this segment Liz asked me about the two big IPOs (DASH and ABNB). In line with my verbalized expectations, these names have taken a breather since the interview. Here were my thoughts:
This week we were able to get more granular on the IPO froth with Rachelle Akuffo on CGTN America. Thanks to Rachelle and Stephanie Savage for having me on:
On Tuesday morning, I was on CGTN Global Business with Michael Wang. Thanks to Michael and Liang Rui for having me on. In this segment I discussed the EU’s “Digital Service Act” proposal and the onerous penalties/responsibilities that may be coming down the pike for GOOGL, FB, AMZN, AAPL and TWTR:
This Tuesday, Bank of America published its monthly “Global Fund Managers Survey.” They interview ~200 managers each month (with ~$500B AUM) to get a gauge on sentiment and positioning. I posted a summary here:
December Bank of America Global Fund Manager Survey Results (Summary)
The key takeaways were:
Yield Curve Steepening
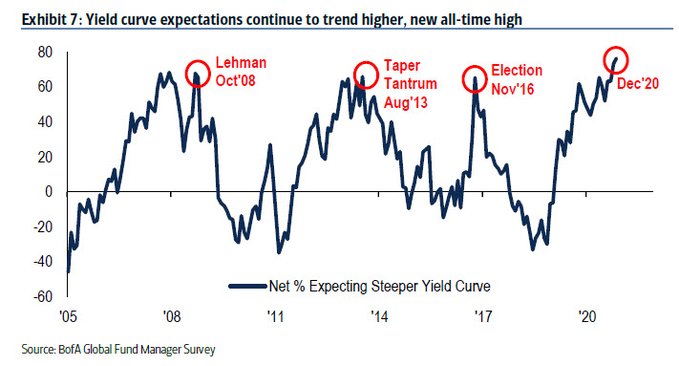
Yield Curve Steepening Expectations Continue to Climb:
We talked about this survey result today (Thursday) on Fox Business with Liz Claman, as well as where we are in the cycle:
This has been a central part of our “buy banks” thesis since the Summer. The second tenet of our thesis is that banks are over-reserved by ~$50B as an industry and that these reserve releases will come back as earnings in the next 4-8 quarters (it is NOT priced in at present):
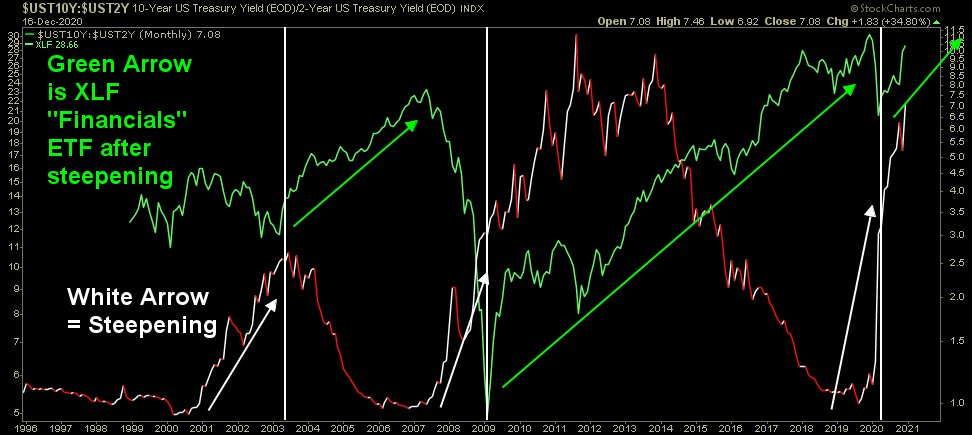
As you can see above, the yield curve has steepened tremendously since the “inversion” in August 2019. This will help NIM (net interest margin) in coming quarters. You can also see that the last three times that managers were this optimistic about steepening (Oct 2008, Aug 2013, Nov 2016) it was a GREAT time to buy banks (see green line above for XLF Financials ETF).
Here’s an update on our favorite (and largest) bank holding:
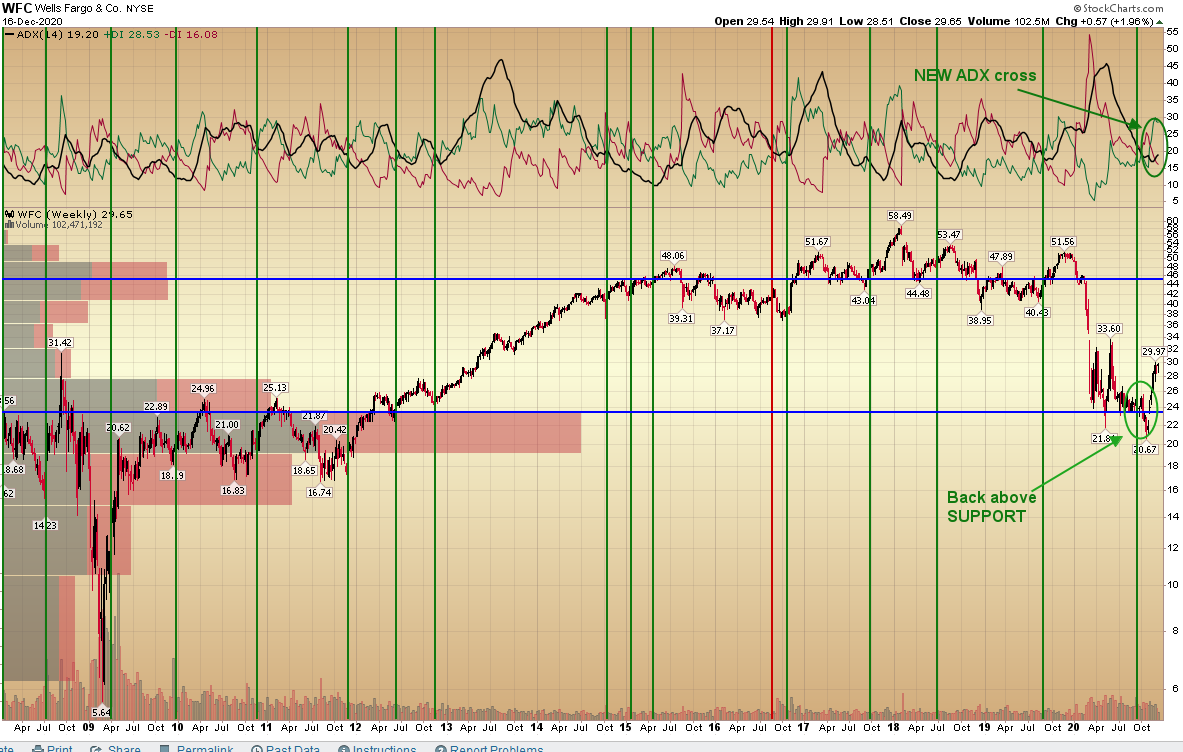
It continues to make progress (up ~43% off its lows in the past 7 weeks). “Opinion Follows Trend.” The same analysts/commentators who were bashing it at $21-$25 are starting to like it now that it’s ~$30. They will love it at $40 and be tripping over themselves to buy the breakout at ~$52.
The good news is they will probably make money even buying up ~$50 – so long as they take a 3-5 year view – as this can be a $70-$80 stock in this next cycle 3-5 years out (in our view). We have covered the reasons in previous notes.
Out of Cash and Into Value
With such dramatic move from flat-footedness/caution prior to the election (which we suggested against in our October 29, 2020 article);
The “Back to the Future” Stock Market (and Sentiment Results)…
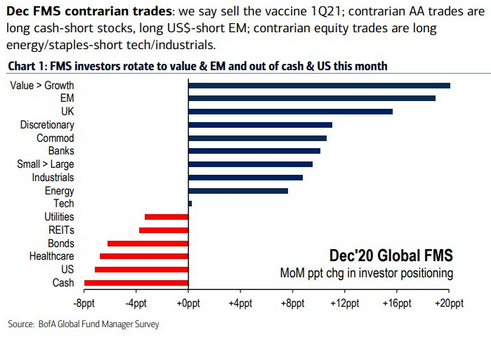
I think the case BofA makes for a “sell the vaccine” contrarian trade at some point in Q1 makes sense. An 8-10% pullback would be healthy in a new business cycle, and would make more sense in Q1 2021 than happening right now.
Why is that? Because every other analyst note and TV commentator is saying to be cautious in the near term due to sentiment, case count, IPO euphoria, etc. Any when everyone is expecting a pullback, you’re less likely to get it.
On the other hand, if we melt up into year-end (which we proposed as a possibility in our December 3, 2020 note below), managers would be too busy chasing to focus on the correction and by Q1 – when “correction” leaves the daily narrative (and everyone starts saying “cash is trash” + TINA – There Is No Alternative – to equities), is when we are more likely to get the correction we need to consolidate huge gains off the March lows. Seasonality favors February, but who knows…
BofA’s contrarian trades are long Energy/Staples and short Tech. I agree. This is not the way the market is positioned. In fact it is just the opposite. In the past week, New York State set a goal to be 100% carbon neutral in their pension funds by 2040. Many others have followed suit.
So my question is, how will they reverse that underweight positioning and explain it to their pensioners when the sector doubles and they under-perform their benchmarks – requiring additional contributions from taxpayers and municipalities to fund the shortfall? Sure, Energy is a small weight now (and that’s what managers are banking on to ignore it), but when it reverts back to a double digit weighting (in the S&P 500) over the next 3-5 years, how will these managers deal with it?
There are no atheists in the fox hole…perhaps they’ll have to find religion once again – just as they did from 2003-2007 when the sector gained >300% off its last depression period…
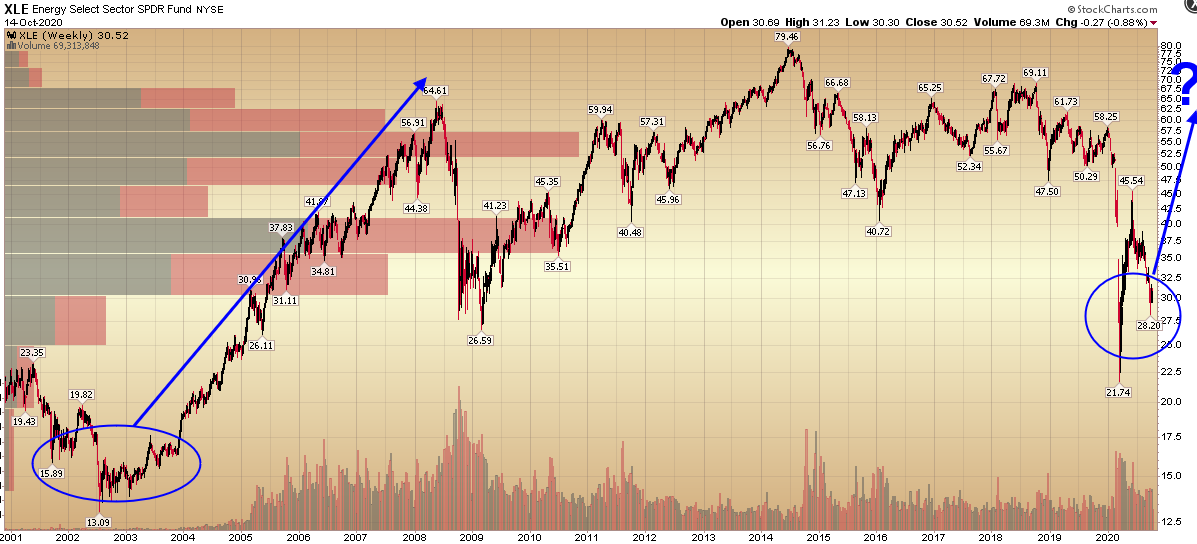
In out October 15 article, we put out the following chart – when XLE was at $30.52:
The “I’m an Accountant” Stock Market (and Sentiment Results)…
How it’s going since:
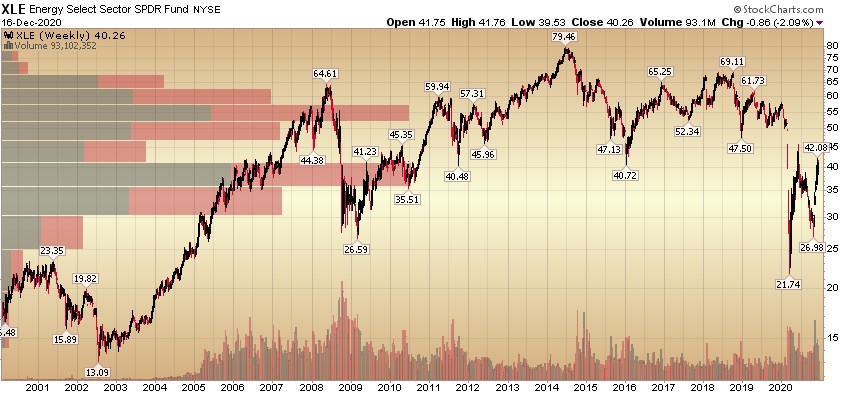
The Energy Sector rose >37% in the past two months since that article. Some names are up over 50% or more. We believe it’s just the beginning of a 3-5 year commodity cycle and those who dismiss the sector based on its current weighting will be left behind (their benchmark).
Optimism
Winston Churchill
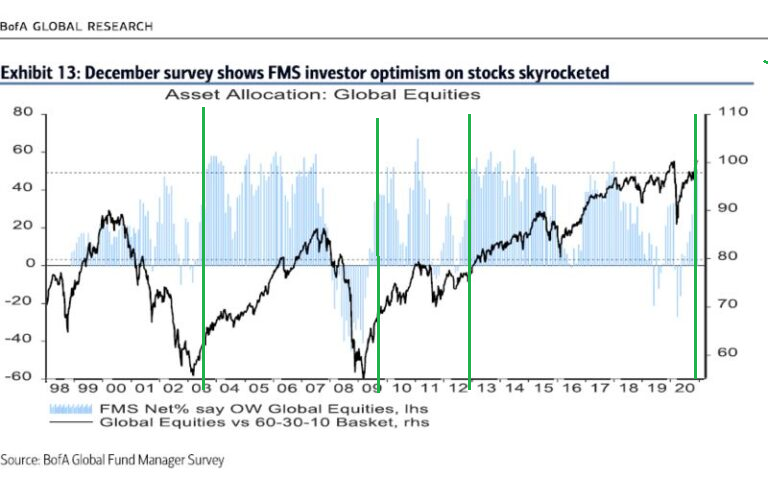
Another finding from this month’s BofA survey was that investor optimism skyrocketed to levels not seen in almost a decade. However, when you look closely to the last three times (green vertical lines I added) that optimism (Fund Managers Over-Weight Equities) jumped above the top horizontal dotted line after being below the bottom dotted horizontal line (2012, 2009, 2003) it was a great time to be buying equities (even after the big initial move).
What’s Bad is Good?
Last week we went through a number of factors that people were pointing to in order to justify why we are due for an immediate crash. We pointed out that if you take a few steps back and take a longer view, many of the “negatives” where actually BULLISH in the intermediate term:
The Frankie Valli, “Can’t Take My Eyes Off You” Stock Market (and Sentiment Results)…
This week, there are a couple more:
Sarah Ponczek from Bloomberg posts great charts/tables. You can follow her on Twitter:
90% of stocks in the Russell 3000 are trading above their 200-day moving averages, the most since 2009
For the Russell 2000, it’s 89%, the most since 2004 pic.twitter.com/0CijTL683k
— Sarah Ponczek (@SarahPonczek) December 16, 2020
So while the short-term “90% of stocks above 200 DMA” looks overbought, the last time it got this “overbought” was 2009. Would you want to be a buyer or seller in 2009?
My latest Chart In Focus article, “Fosback Absolute Breadth Ratio Says This Is Not A Top”, is posted at https://t.co/opC6EsIzrt. pic.twitter.com/ZjAfEvUbyK
— Tom McClellan (@McClellanOsc) December 10, 2020
Now onto the shorter term view for the General Market:
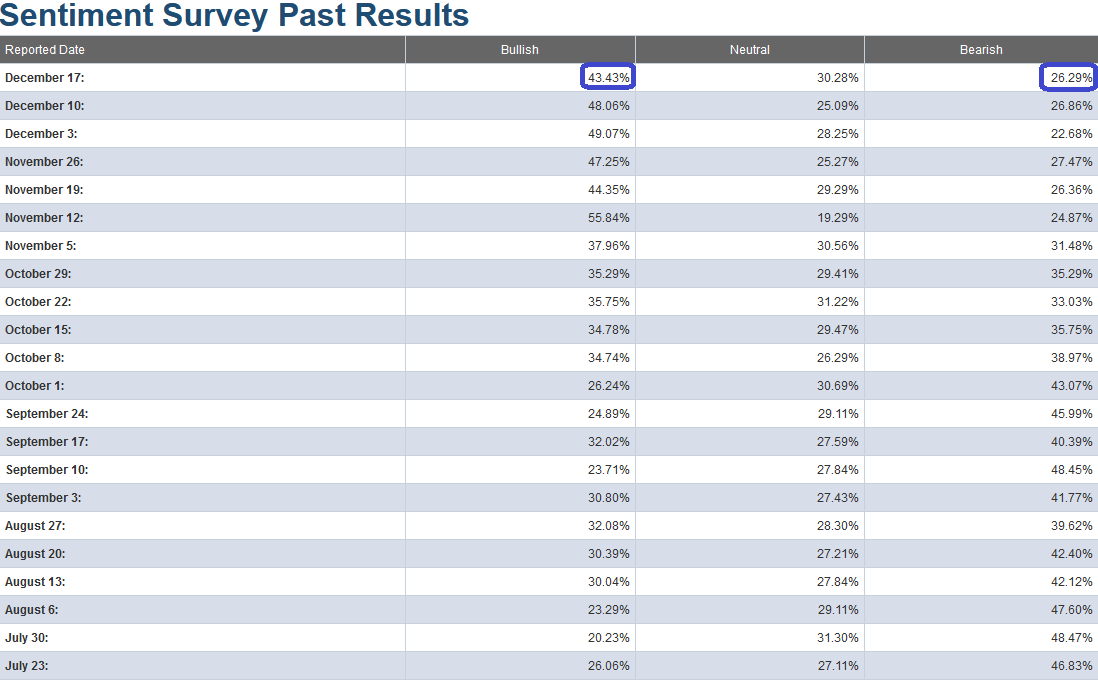
In this week’s AAII Sentiment Survey result, Bullish Percent (Video Explanation) dropped to 43.43% from 48.06% last week. Bearish Percent flat-lined to 26.29% from 26.86% last week. We are still at an extreme in sentiment for retail investors.
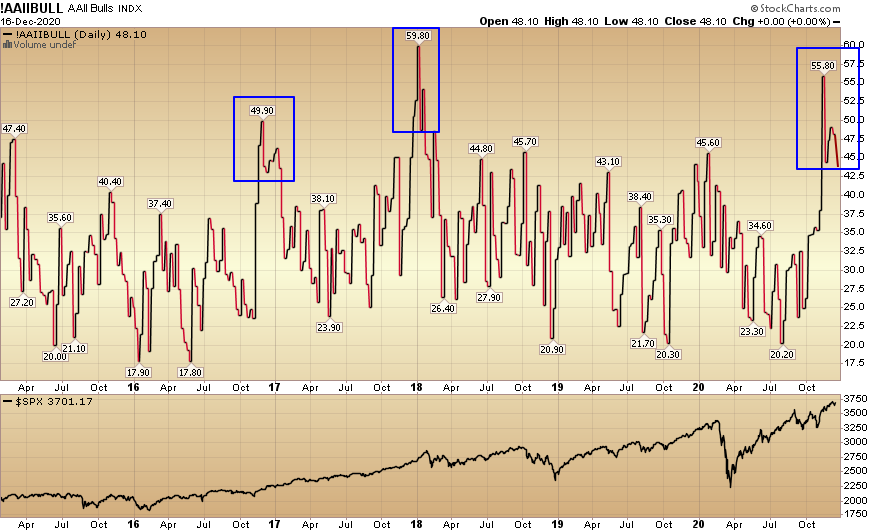
Just like last week – while this is still an extreme in short-term sentiment and should be heeded in the short-term – it is important to note in the chart below, that while similar levels presaged a short term top in early 2018, they occurred near the beginning of a longer term uptrend at the end of 2016-2017 (right after the last Presidential election).
We noted the similarities between the pre-election stock-market in 2016 versus 2020 in our October 29, 2020 note. It has played out exactly according to script ever since, which is why I am inclined to give this extreme level in sentiment the same “benefit of the doubt” as late 2016. Just like then, most managers were off-sides and flat-footed going into the election and had to panic into the market to play “catch up” before year-end.
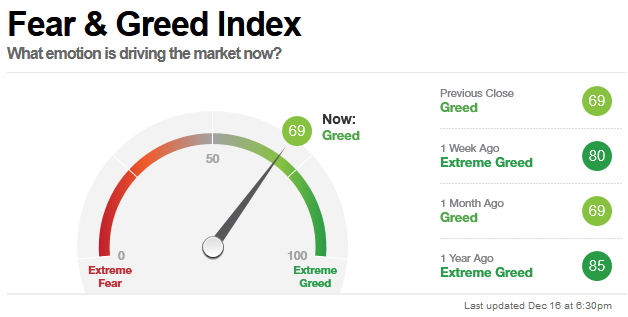
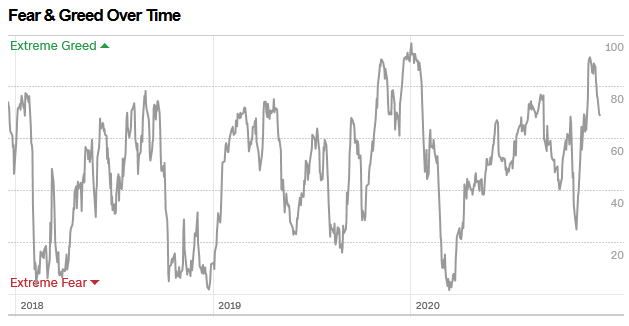
The CNN “Fear and Greed” Index dropped from 80 last week to 69 this week. You can learn how this indicator is calculated and how it works here: (Video Explanation)
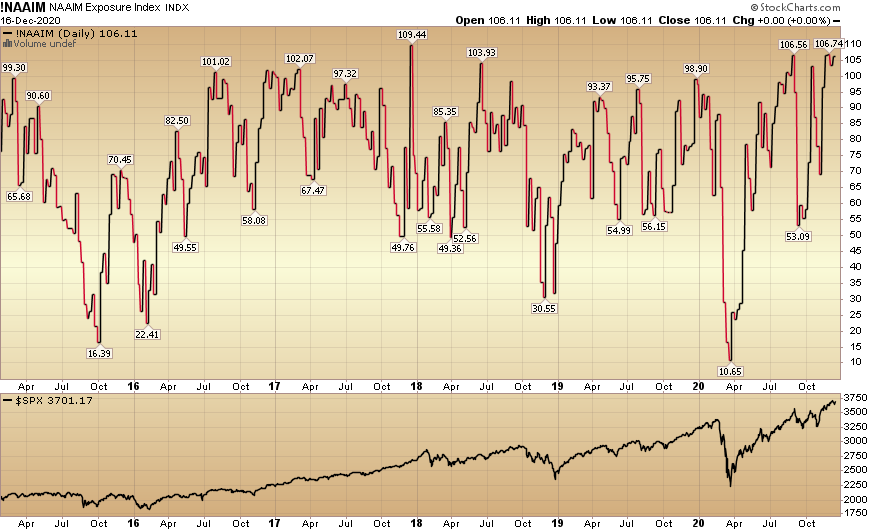
And finally, this week the NAAIM (National Association of Active Investment Managers Index) (Video Explanation) flat-lined at 106.11% this week from 106.74% equity exposure last week. As we said before the election, managers would have to chase into year end – and they are now doing just that. As you can see over the past five years, this level of extreme warrants caution but is not always indicative of a top.
Our message for this week:
Our view has stayed consistent:
“While the (short-term) “easy money” has been made in the general indices (since the March lows), I think the easy money is just getting started in “left for dead” sectors/stocks. I believe Banks, Defense Stocks and pockets of Energy will be as good – if not “orders of magnitude” better (in coming quarters) – than buying the general market in late March.”
While many worry that institutional managers – and retail investors alike – are, “in love and lovin’ on you (stock market),” it just may be the case that we’ll get the anticipated correction when everyone has forgotten about the “euphoria” narrative.
While everyone’s looking for NOW, I think the odds favor a Q1 pullback – after most managers have given up on a correction and followed the chase. Only when everyone’s in can they open the trap door…
That said, if you take a few steps back (like we covered last week), it may be too cute to try to play it – considering we have just started a new business cycle. There were fierce corrections in 2010 and 2011 after the huge move off the March 2009 lows.
It did not pay to play the short term moves in 2010 and 2011 – as you may very well have missed out on a decade long run. That long cycle ended with the 2019 yield curve inversion, and the 2020 ~35% correction plus 1H recession (2 quarters of negative GDP growth). The recession ended with positive GDP growth in Q3 2020 (33.1% annualized) and began the new business cycle.
We’ll be using any weakness that potentially comes our way in Q1 to add more value/cyclical names to hold for the next 3-5 years…


