
Short Term Pain (maybe)?
Yesterday’s sell-off in equity markets coincided with another weak Treasury bond auction. That minor catalyst was compounded by the low liquidity of holiday markets.
Friday’s Core PCE inflation numbers should put the final nail in the coffin for any Fed Cut doubters. I doubt you will see any more officials paraded out (with a straight face) to try to walk back Powell’s dovish pivot after Friday’s print.
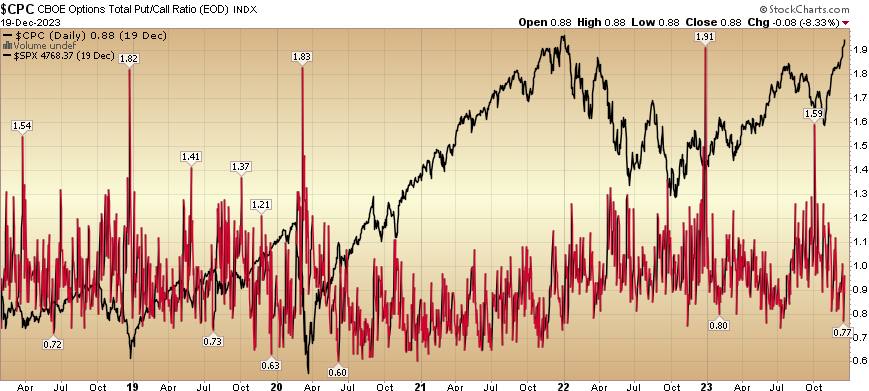
There is good instinct from many market participants that we’ve come “too far, too fast” – in recent weeks – and must now have a correction. They are probably right – to a degree… Here’s what they are looking at:
Put/Call Ratio-
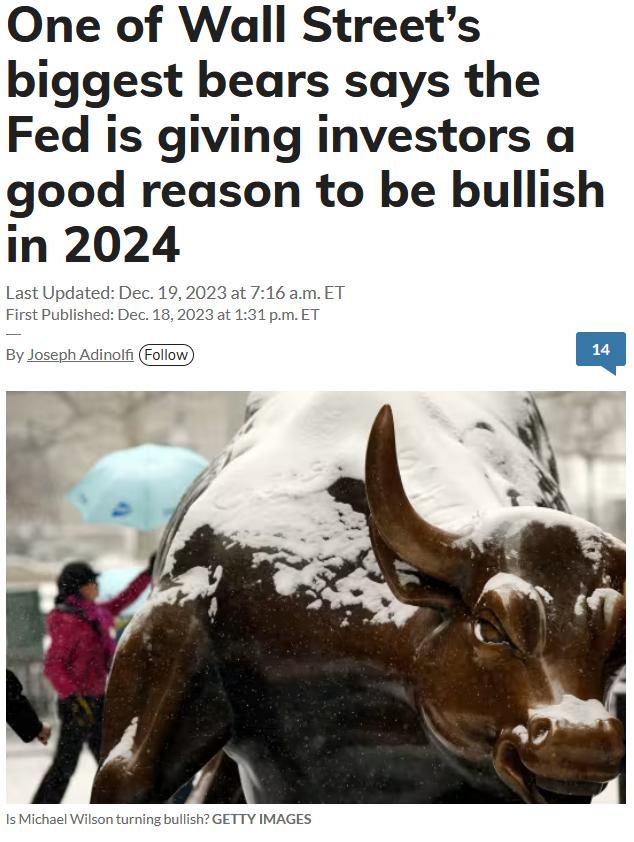
All of the biggest bears who have missed the rally since the October 2022 (and Oct 2023) lows are now reluctantly and resistantly turning bullish “opinion follows trend”:
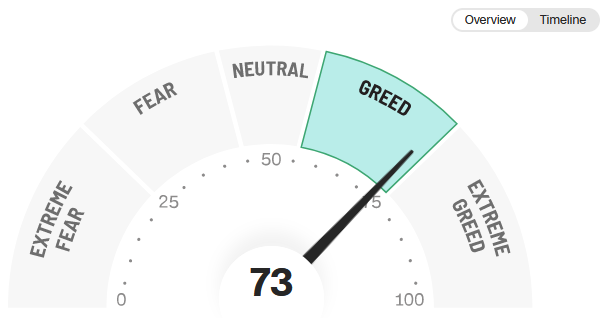
CNN Fear and Greed:
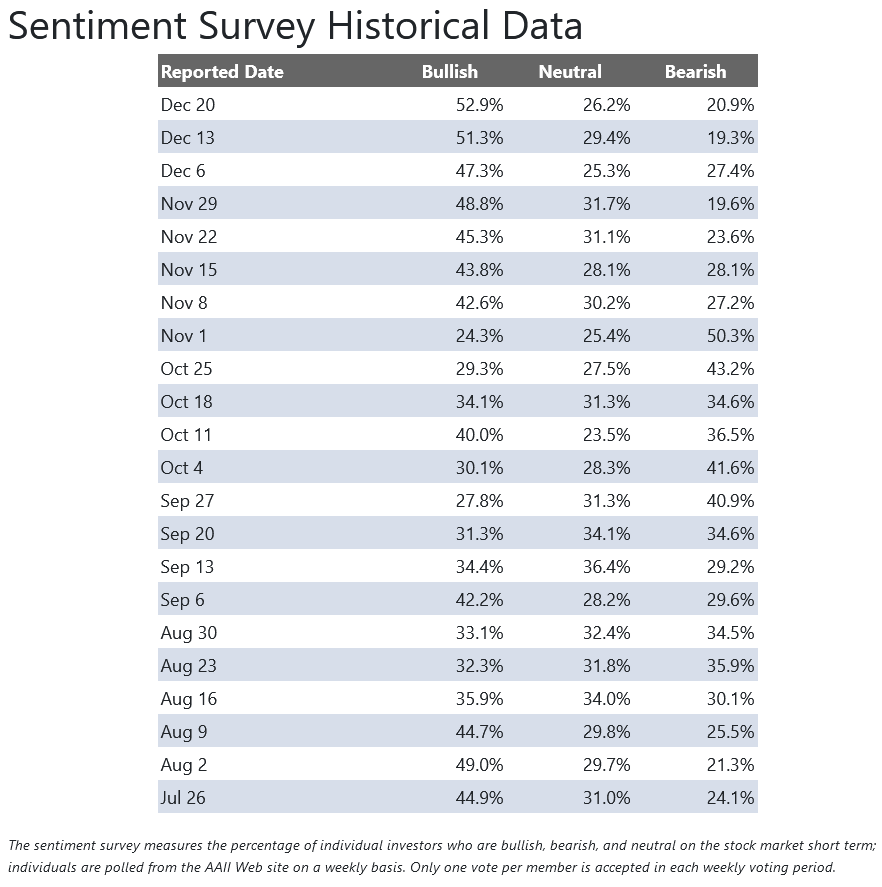
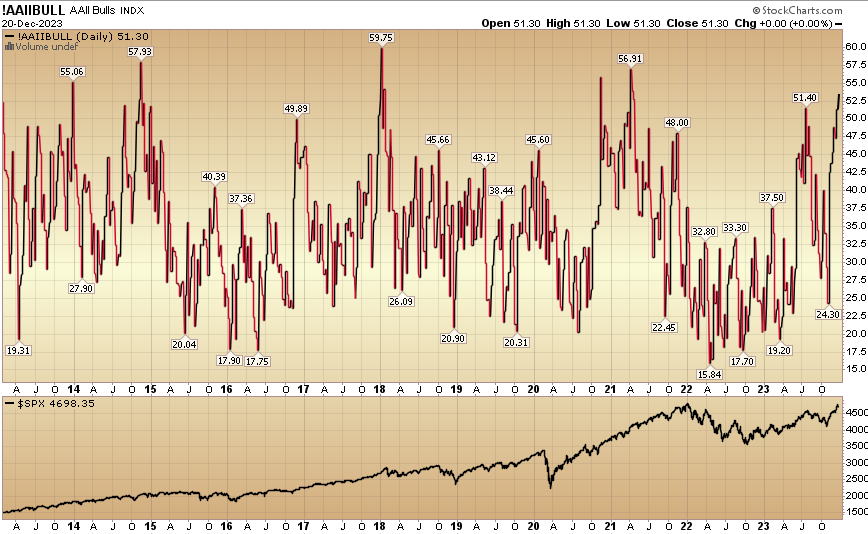
AAII Sentiment Survey Stretched:
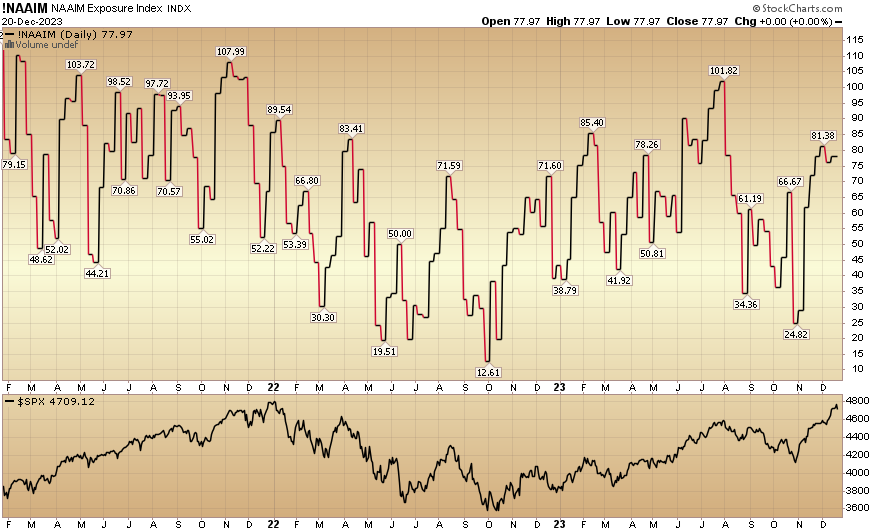
 National Association of Active Investment Managers Equity Exposure Index:
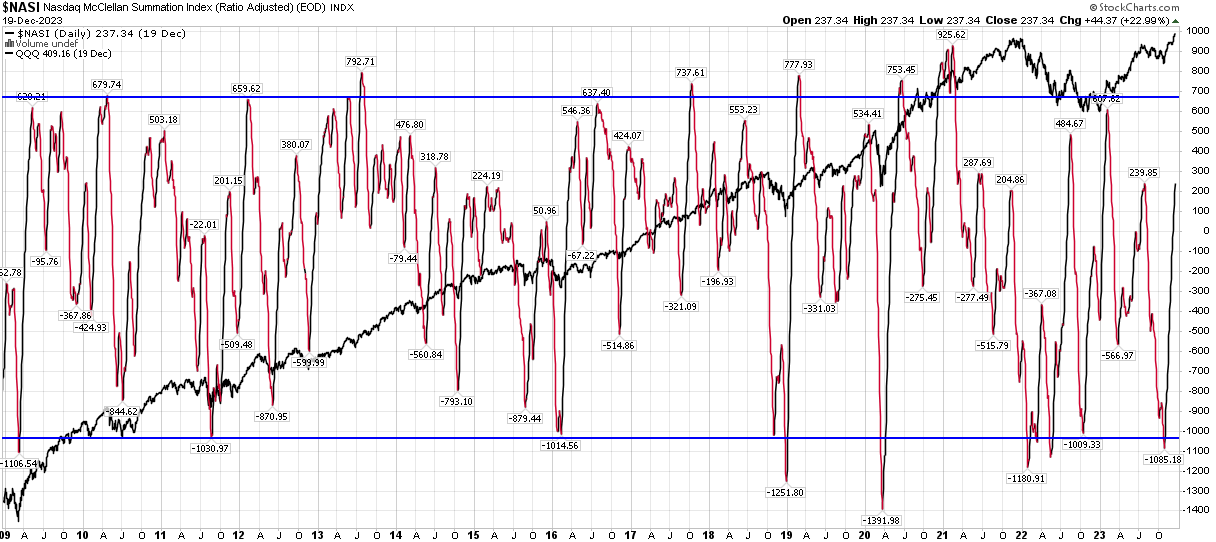
Nasdaq McClellan Summation Index:
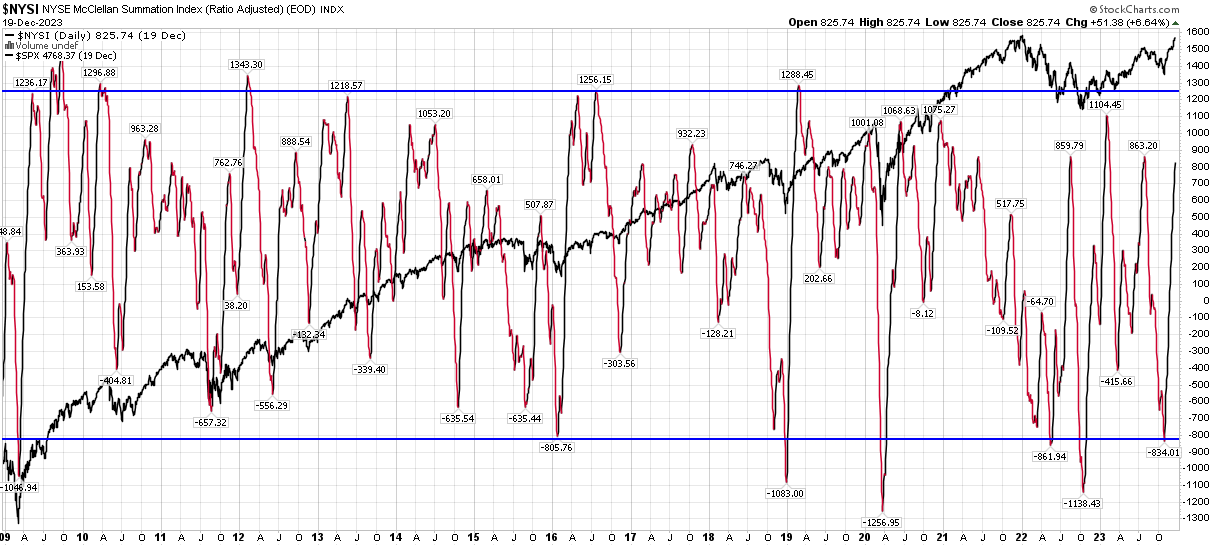
NYSE McClellan Summation Index: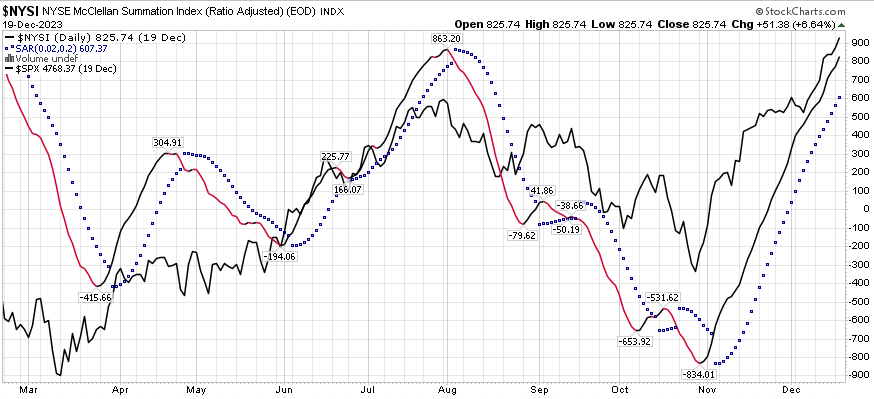
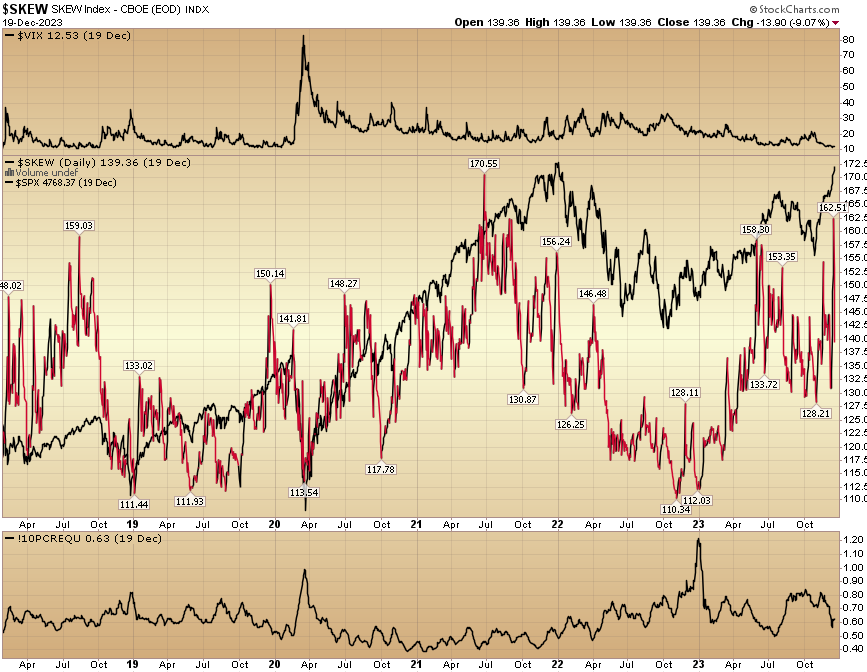
 Option Skew:
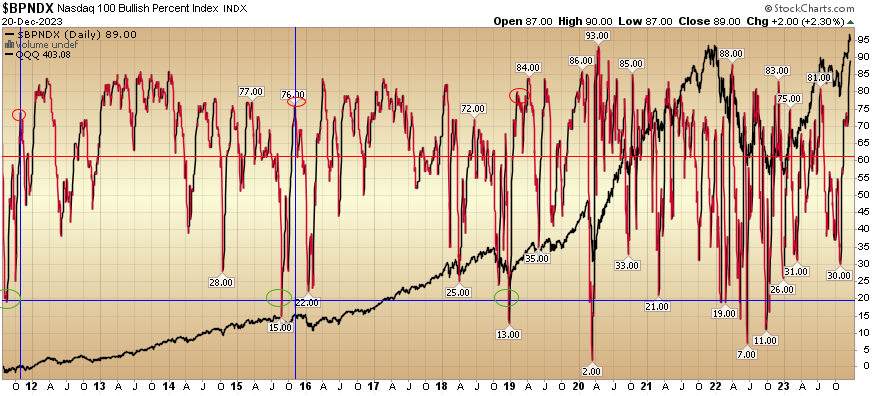
Nasdaq 100 Bullish Percent:
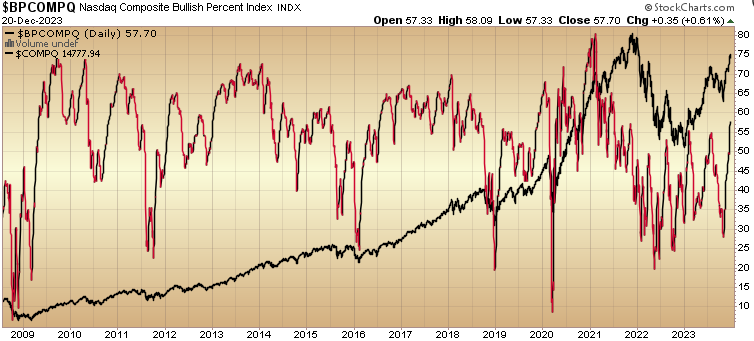
Nasdaq Composite Bullish Percent:
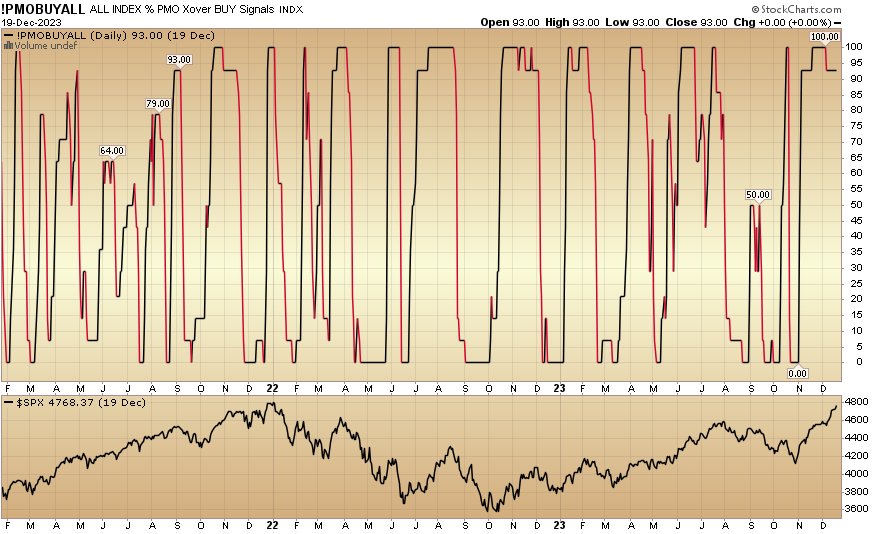
Percent of stocks on PMO crossover buy signal:
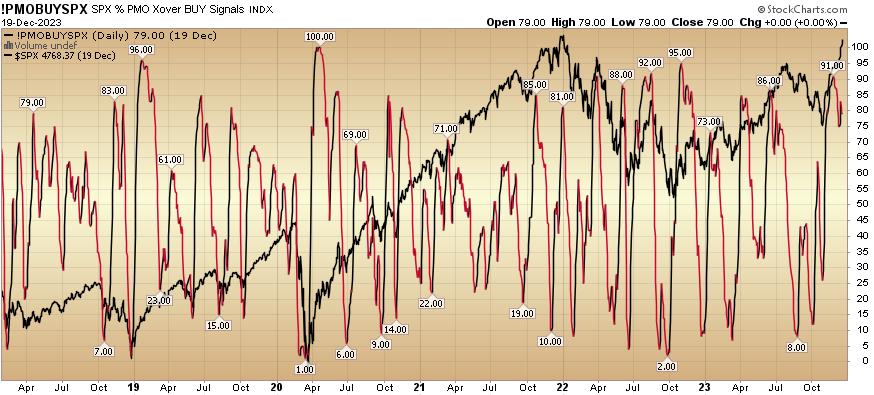
Percent of S&P 500 stocks on PMO crossover buy signal:
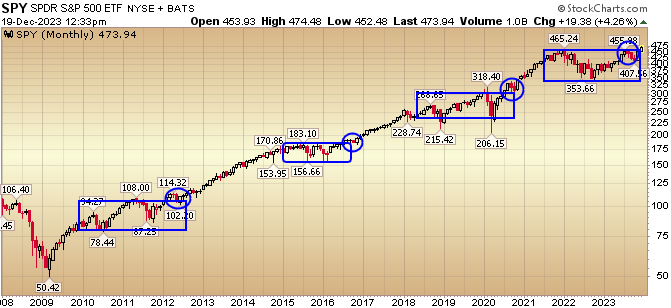
Or, Long Term Gain (our view)?
We are big proponents of “zooming out,” and while we acknowledge there are aspects that point to short term “overstretched” conditions, we don’t intend to get too cute with it. Here’s what WE are looking at:

The above chart shows the last 14 years of multi-year correction recoveries followed by ~2 year consolidations of gains (blue boxes). It appears we have just finished a 2 year consolidation (with ~0% gains for the S&P 500 since 2021) which will be followed by a few years of nice gains. You can also see at the end of each consolidation (blue box), you get 2-3 months of a check back before you see the next move higher. It appears we got our “check back” in the 3 circled red months from Aug-Oct. Most people are strangled by recency bias (because the last two years have been continuous “hope dashing” – leading to a view that this time can’t be real and it’s time to “take profits”).
They may be right for a few percent move, but I would not get too cute trying to play it. Sure there may be some profit taking in Jan (or Feb), but do you really want to be out of great companies if they have not yet reached your predetermined target of intrinsic value – just to save you a couple of tums tablets for short term volatility? I don’t. Do you want to give up 1-3% of your equity upside so that your “monthly” statement looks pretty (with low volatility), when it will only cost you compounding in the intermediate to long-term? I don’t.
Here’s the lens we are looking through and have shared with you since 2020. We believe we are mid-cycle in a normal secular bull market (18-20 years) that broke out to new highs ~2013:
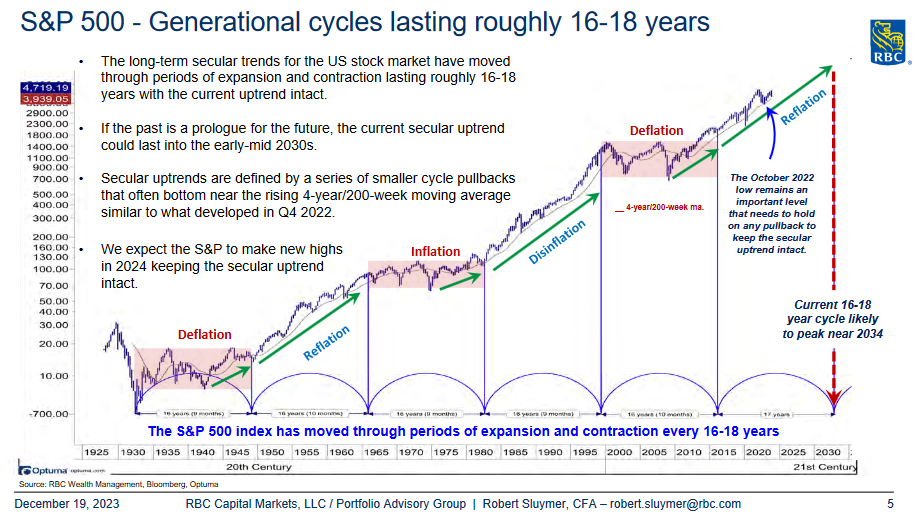
Robert Sluymer version RBC
This is predicated on the largest portion of the population being ~33-34 years old (Millennials) and beginning housing and family formation. History shows this consumption level persists until they reach their early 40’s and then slows down dramatically. That takes us to the early 2030’s. Prior to then, it remains a “buy the dips/corrections” environment. There will be plenty of bumps in the road but the trend is up and it will be a period where fortunes are made due to consumption, innovation and productivity tailwinds.
Put simply, fortunes will be made and multiplied over the next 6-8 years. If you do not have money allocated to equities or a good equity manager you will miss out on a rare period in history. Maybe not in the next few days or weeks (you may even feel smart missing a few percent of volatility), but over months or years you will kick yourself. These opportunities show up a couple times in a lifetime. If you snooze, waiting for the perfect “dip” you will loose. You only have to ride these opportunities correctly ONCE…
We’ve talked about some of the specific names in recent weeks’ podcast|videocast(s) and our clients can see a number of them in their portfolios.
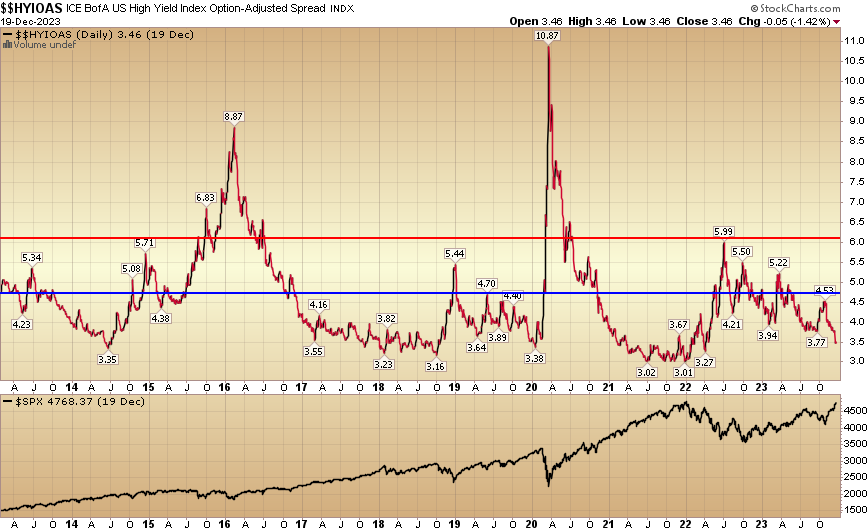
High Yield Credit Spreads declining (cost/availability of capital):
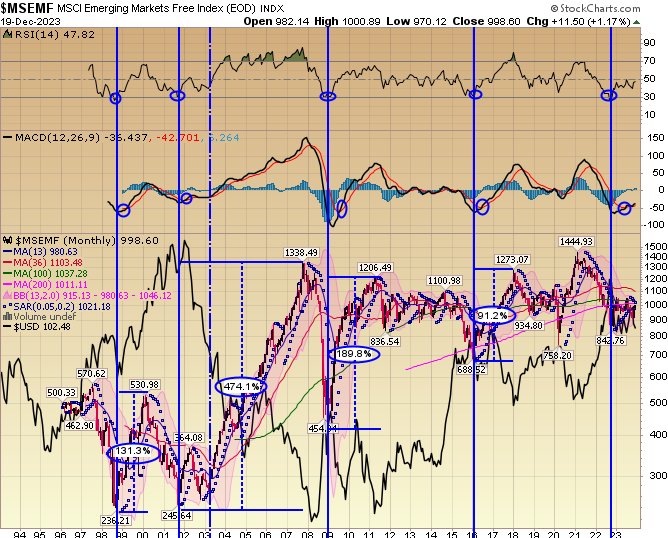
Emerging Markets Starting turn up as Fed steps back and Dollar weakens (a big focus prospectively):
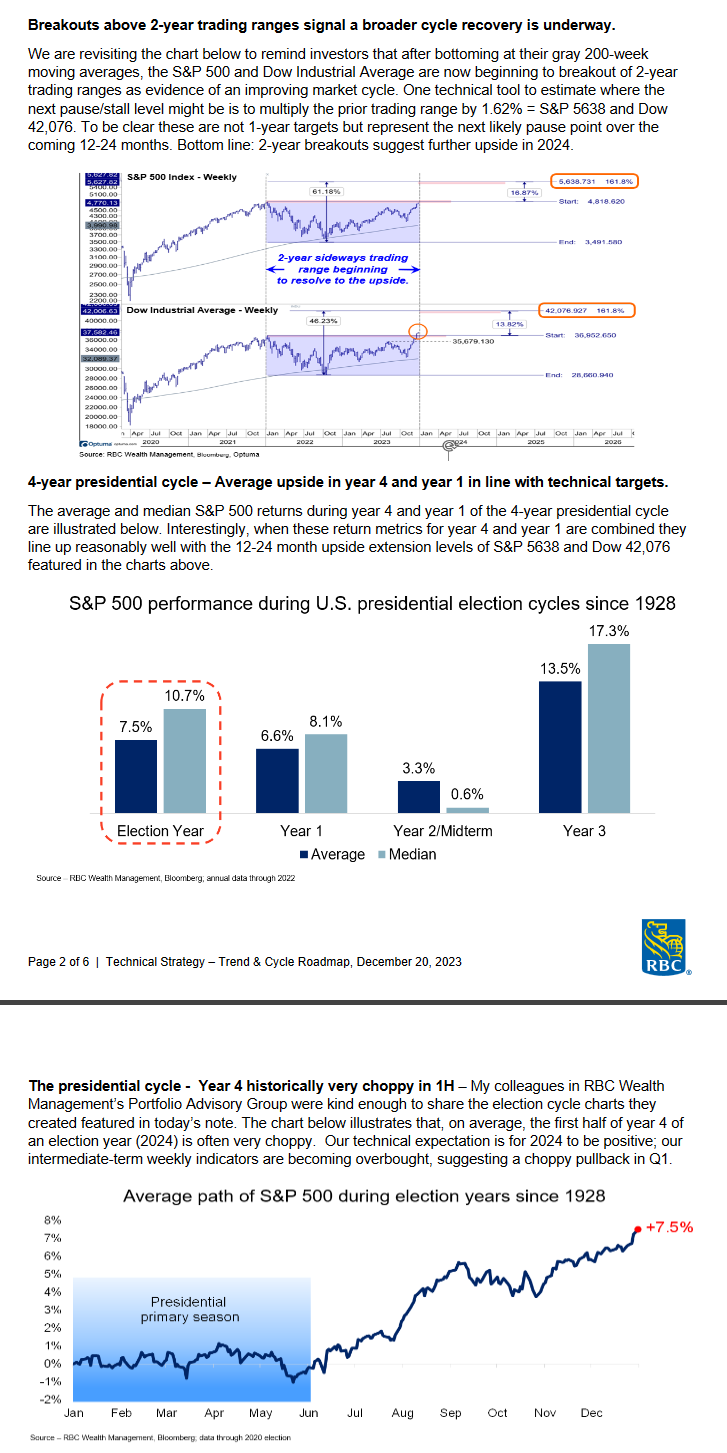
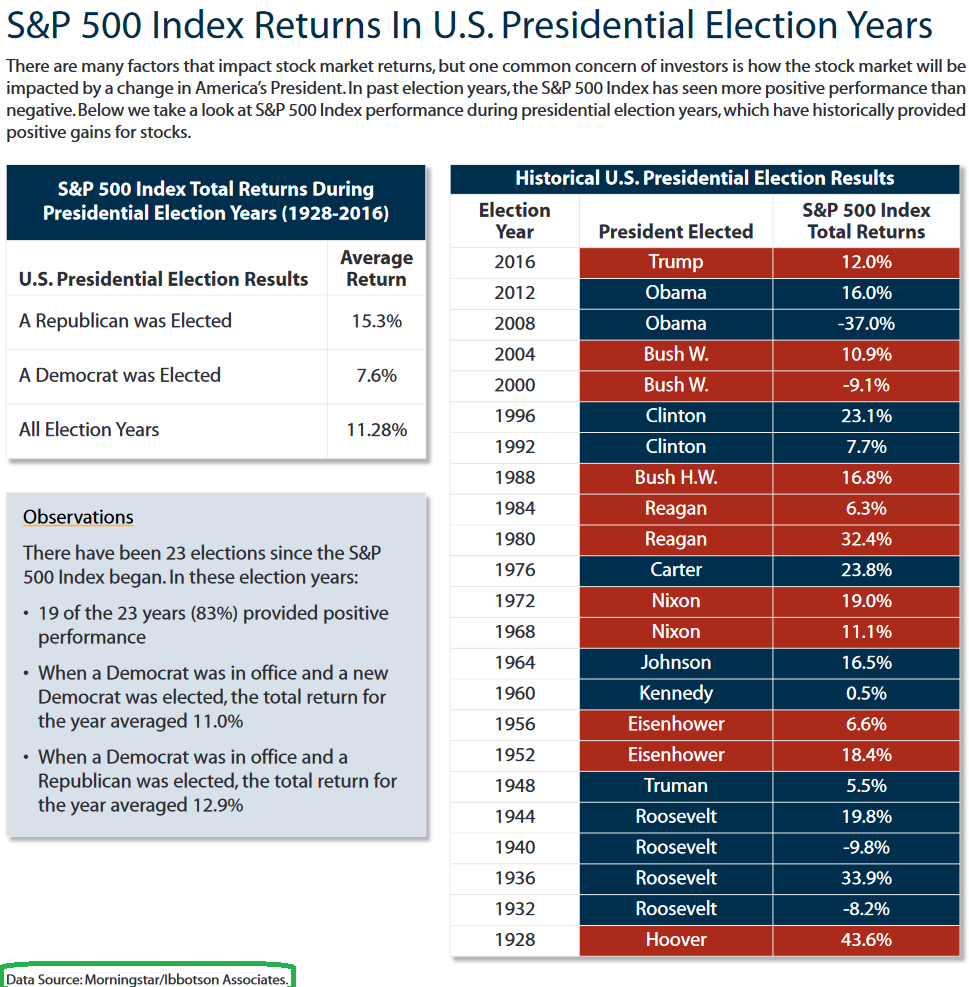
Breakouts and Election Years (Robert Sluymer RBC):
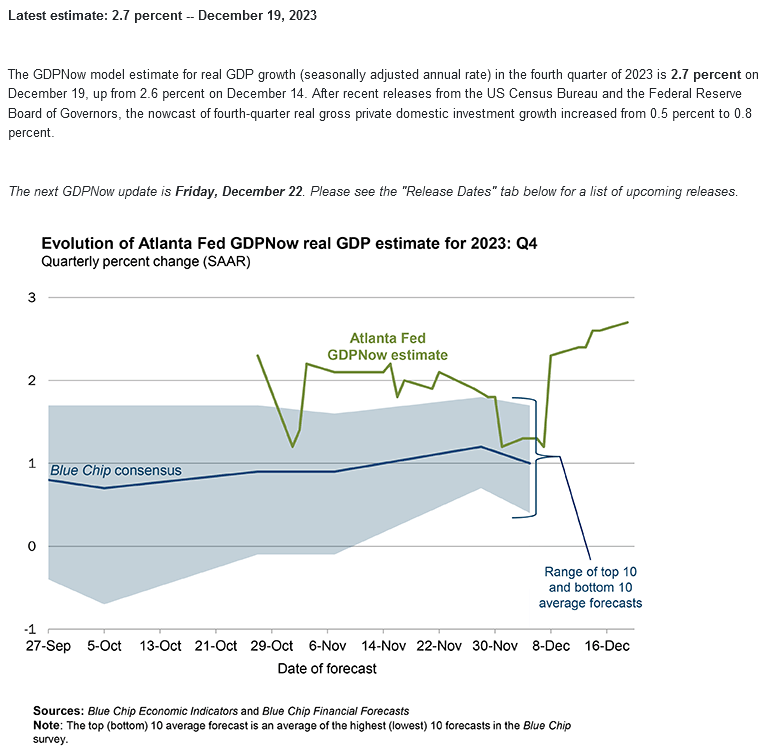
 GDP continues to trend UP:
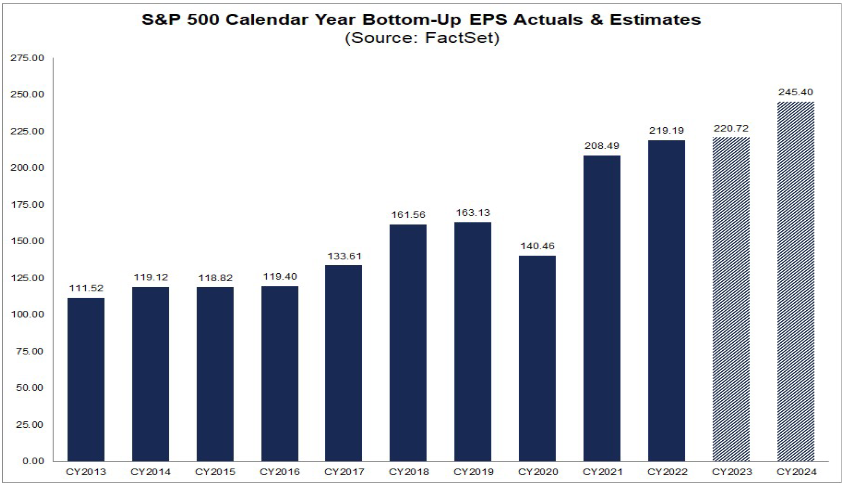
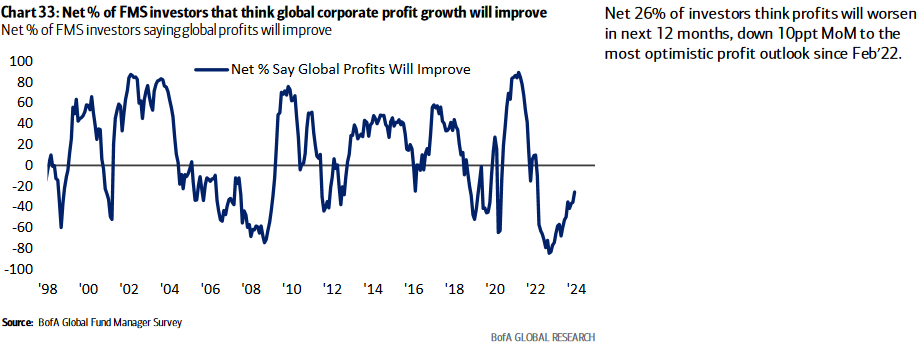
Earnings growth (and margins) re-accelerate(s) in 2024:
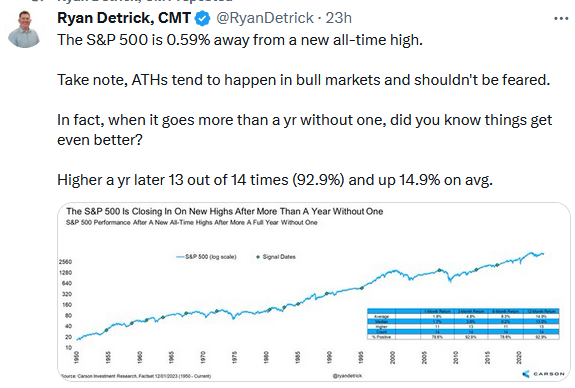
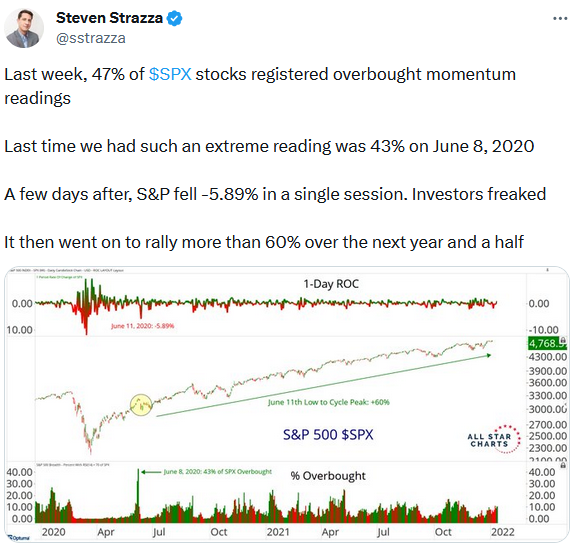
Quantitative stats. Like 2020 (and 2009) when you get a violent move off the lows – people always expect a leg down because they either missed the move or are fooled by recency bias:
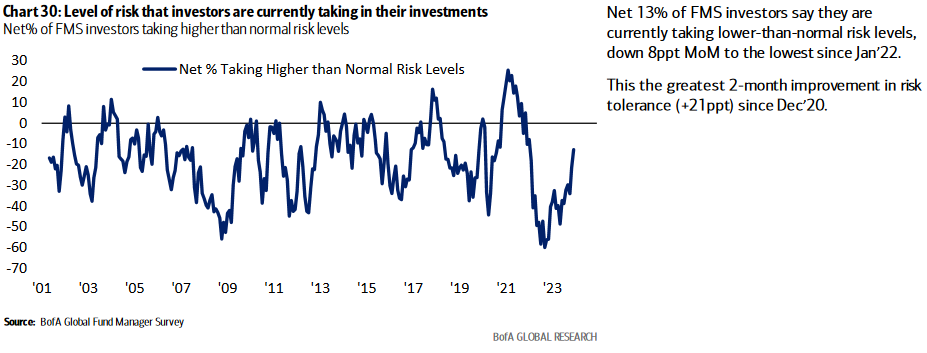
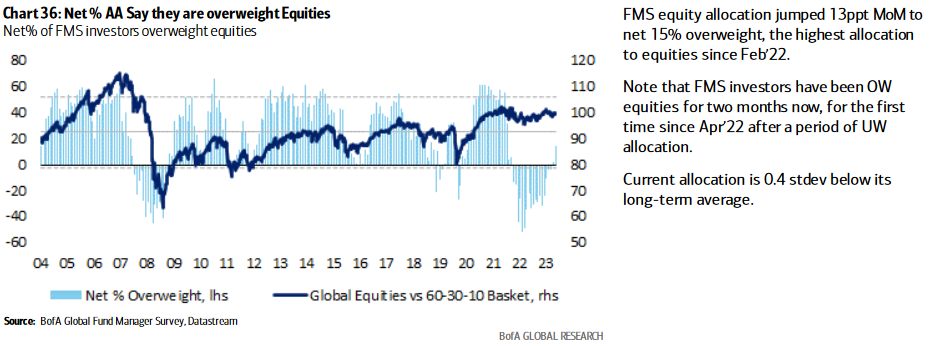
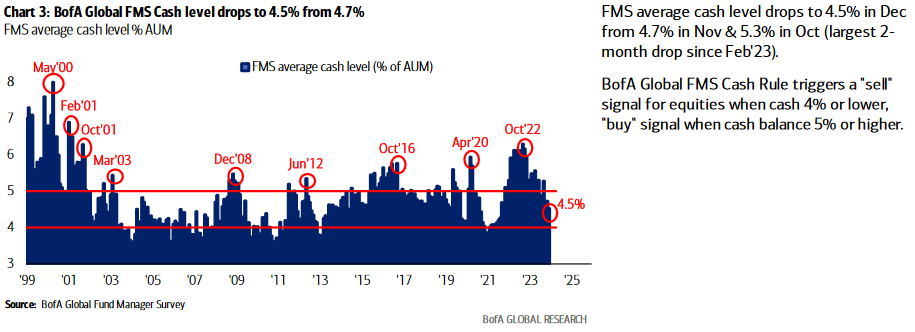
Institutional Positioning, Sentiment and Outlook JUST GETTING OFF THE MAT (full summary for Bank of America Survey HERE):
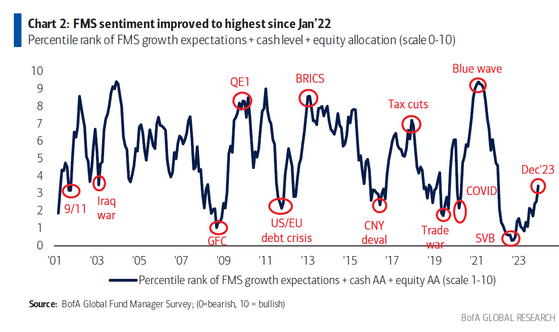
Always remember, the market is designed to cause the most pain to the most amount of people at any one point in time. Where is the “pain trade?”
If >65% of managers are still behind their benchmarks because they sold in the hole in October (or were skeptical all year), “would the market going UP more or back DOWN cause – the herd that missed most of the move – the most pain?”
Once you figure out the answer, make sure you’re on the other side.
Podcast
Our podcast|videocast will be out late today or tomorrow. Each week, we have a segment called “Ask Me Anything (AMA)” where we answer questions sent in by our audience. If you have a question for this week’s episode, please send it in at the contact form here.
*Opinion, Not Advice. See Terms


