
Data Source: Factset
Yogi Berra, “If you don’t know where you’re going, you might not get there.”
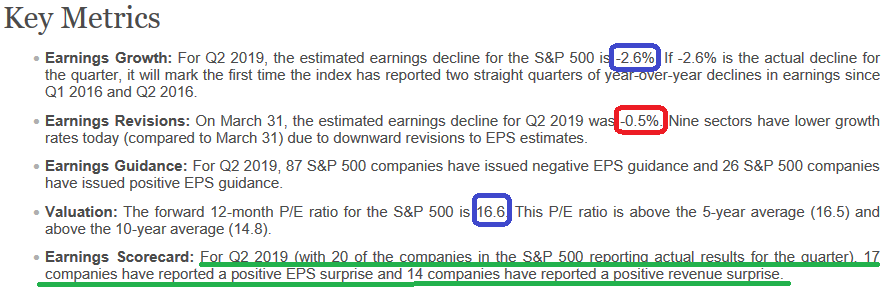
Not much has changed with Q2 Earnings Estimates in the past week. Factset still has them at -2.6% year on year. This low bar likely implies a slightly positive year on year outcome – similar to the beat rate of Q1.
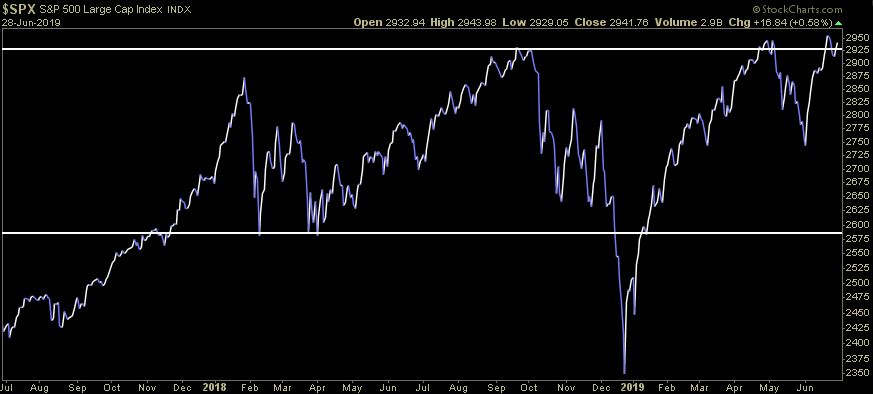
It makes sense that earnings have been flat as the market has effectively done nothing in 18 months (barely eking out new highs after 18 months – see featured S&P 500 chart above). But that’s the rear view mirror – and in some sense the market was discounting this (quantitative tightening/rate hikes/impact of trade war/slowing growth) based on its performance: flat earnings = flat choppy trading for the past 18 months.
The question now becomes what will the market discount moving forward (looking through the windshield at what’s ahead)?
With the China talks yielding a positive outcome this weekend (but not too positive to take the Fed out of the picture) we are likely faced with the best of both worlds:
- EPS will beat and come in slightly positive yoy.
- Guidance will be less pessimistic with the tariff increases on hold.
- The Fed is still in a position – with slower growth and the lagged impact of tightening too quickly in 2018 – that they have plenty of cover to start cuts at the July meeting.
- Forward guidance is still strong: For Q4 2019, analysts are projecting earnings growth of 6.3%. For Q1 2020, analysts are projecting earnings growth of 9.9%. For Q2 2020, analysts are projecting earnings growth of 12.9%.
- The market will start discounting this forward hockey stick in growth coupled with (hopefully) a lower discount rate from the Fed (assuming they do the right thing for the next couple of meetings (starting in July)), and we should finally break out of this 18 month range of sideways price and earnings.
Howard Silverblatt over at S&P global has a similar view of forward growth in EPS: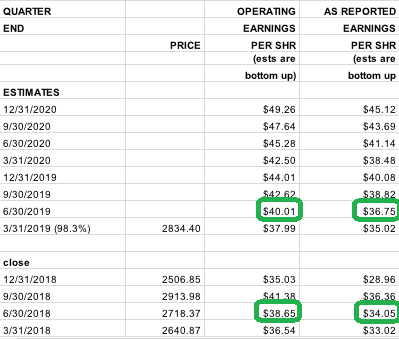 The 2/10 yield curve has not only (not yet inverted), but it is actually widening in recent weeks – starting to price in future cuts. Very tough to end a cycle without the Fed completely choking off credit by inverting the 2/10 spread. They are jawboning that they want to keep the expansion going. We will see if they put OUR money where THEIR mouth is in July.
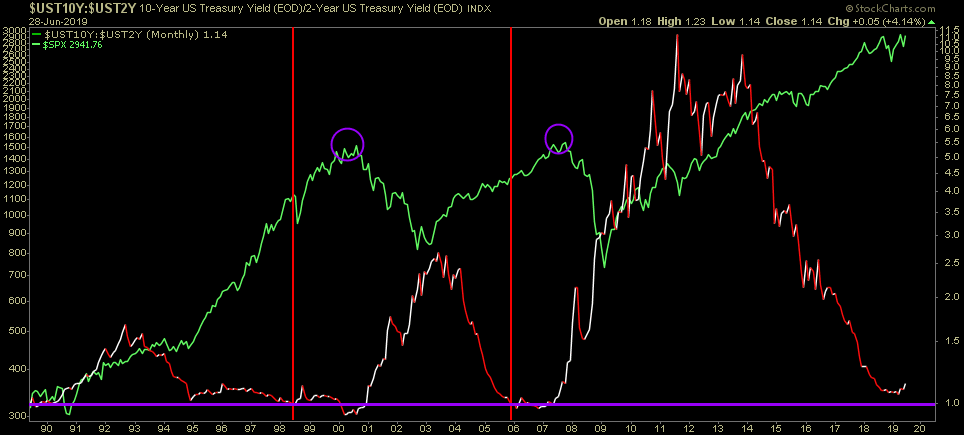 For everyone screaming “end of cycle, end of cycle” I would keep a few things in mind:
- The greatest stock market gains in the shortest amount of time over the past the past 40 years have come AFTER the 2/10 curve inverted in the last ~18 months before the market peaks. We have not started that countdown yet. See chart above (red vertical line = 2/10 inversion, purple circle = market peak).
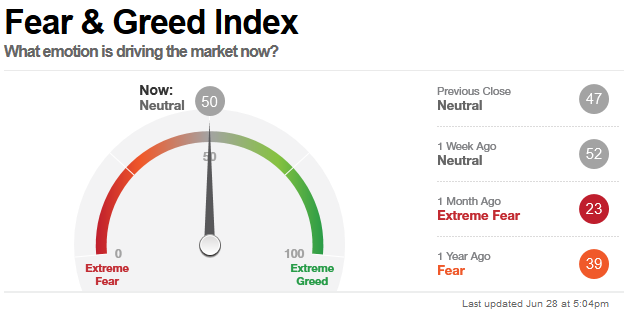
- A typical late cycle multiple reaches high teens to low 20’s before the blowoff. We are at 16.6x forward as of Friday’s close. We are breaking out to new highs with a CNN Fear/Greed gauge at an apathetic 50 level! Hardly a euphoric read…
 For more on sentiment/positioning, see our post from Thursday here: https://www.hedgefundtips.com/aaii-as-pessimism-persists-the-wall-of-worry-to-climb-remains-intact/
 - Be careful where you measure the beginning of the cycle. If a 20% drop is a “bear market,” we just had one in December and reset the clock. “But look how far the S&P 500 has come since the March 2009 lows” they say? Pick your points carefully. While the S&P has had a nice move off the bottom, it has not done well in the past 19 years – relative to history. The S&P peaked at 1553.11 in March of 2000. It closed on Friday at 2941.74. Do you know what the CAGR is for that??? How about 3.37% per year ex-dividends? Add the 2% in for dividends and you’re at 5.37%. The long run return (100yr) is ~8.5%/year. So if we just reverted back to the long run mean growth rate of the S&P 500 what would be the price target today (excluding dividends)? 5,220. That’s right 5,220 if we grew the S&P compounded at 6.5% (8.5% – 2% for dividends) since March 2000. That is where we would be. So for everyone extrapolating a “new normal” of subdued returns because we had a move off of depression levels in 2009, you are missing the bigger picture. We are playing CATCH up, NOT overshoot. And the target we missed was 5,220 – if 100 years of history matters.
So where will all of this catch up growth come from in coming years? Millennial housing formation. We had 80M boomers who drove the bus of growth from 1950-1968 and 1982-2000. Then my generation “Gen X” screwed everything up because we are only 65M (not enough housing formation to drive growth). The core reason why central banks could print trillions and not get any inflation (they were papering over a huge shortage in housing formation – which drives growth). But now, now mi amigos we have the Millenials who are even BIGGER than the baby boomers were with 85M in population. Yes, they are starting housing formation later, they have some debt, etc. but they have numbers – and numbers drive the story in a capitalist setup. Might there be a hiccup before the “game is on” a couple of years after the inversion (early 2020’s)? Sure – there was a huge recession from 1980-1982 when the boomers were just kicking into housing formation and peak earnings cycles. The millenials are just now knocking on the door and starting in the early 2020s through late 2030’s we could see population driven market growth along the likes of 1950-1968 and 1982-2000 once again.
This is hard for many in my generation (Gen X) to believe because it feels like every time we get going (2000, then 2008) a huge shoe drops – similar to 1930 and 1937, 1973 and 1977, but after dusk comes dawn and we have a ton of lost ground to make up in the next 20 years. Bumps, sure, but the direction is UP not sideways. Sideways is the rear view mirror and if you keep staring into it, you’re going to miss the ride forward.


